Village of Grosse Pointe Shores, MI Map & Demographics
Village of Grosse Pointe Shores Map
Village of Grosse Pointe Shores Overview
$101,364
PER CAPITA INCOME
$208,281
AVG FAMILY INCOME
$170,850
AVG HOUSEHOLD INCOME
46.9%
WAGE / INCOME GAP [ % ]
53.1¢/ $1
WAGE / INCOME GAP [ $ ]
0.52
INEQUALITY / GINI INDEX
2,610
TOTAL POPULATION
1,301
MALE POPULATION
1,309
FEMALE POPULATION
99.39
MALES / 100 FEMALES
100.61
FEMALES / 100 MALES
51.0
MEDIAN AGE
3.1
AVG FAMILY SIZE
2.6
AVG HOUSEHOLD SIZE
1,111
LABOR FORCE [ PEOPLE ]
54.2%
PERCENT IN LABOR FORCE
1.1%
UNEMPLOYMENT RATE
Income in Village of Grosse Pointe Shores
Income Overview in Village of Grosse Pointe Shores
Per Capita Income in Village of Grosse Pointe Shores is $101,364, while median incomes of families and households are $208,281 and $170,850 respectively.
| Characteristic | Number | Measure |
| Per Capita Income | 2,610 | $101,364 |
| Median Family Income | 741 | $208,281 |
| Mean Family Income | 741 | $314,371 |
| Median Household Income | 983 | $170,850 |
| Mean Household Income | 983 | $265,552 |
| Income Deficit | 741 | $0 |
| Wage / Income Gap (%) | 2,610 | 46.86% |
| Wage / Income Gap ($) | 2,610 | 53.14¢ per $1 |
| Gini / Inequality Index | 2,610 | 0.52 |
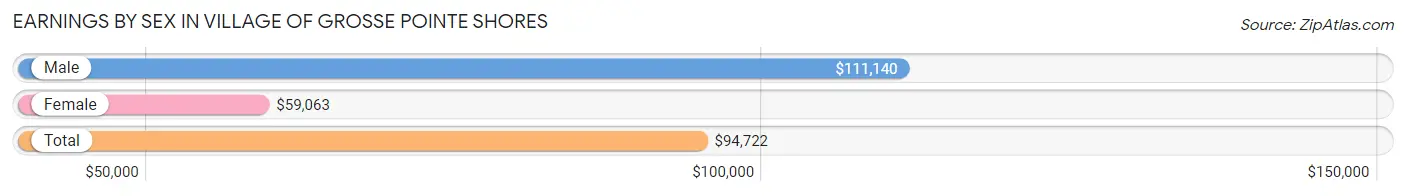
Earnings by Sex in Village of Grosse Pointe Shores
Average Earnings in Village of Grosse Pointe Shores are $94,722, $111,140 for men and $59,063 for women, a difference of 46.9%.
| Sex | Number | Average Earnings |
| Male | 739 (63.2%) | $111,140 |
| Female | 431 (36.8%) | $59,063 |
| Total | 1,170 (100.0%) | $94,722 |
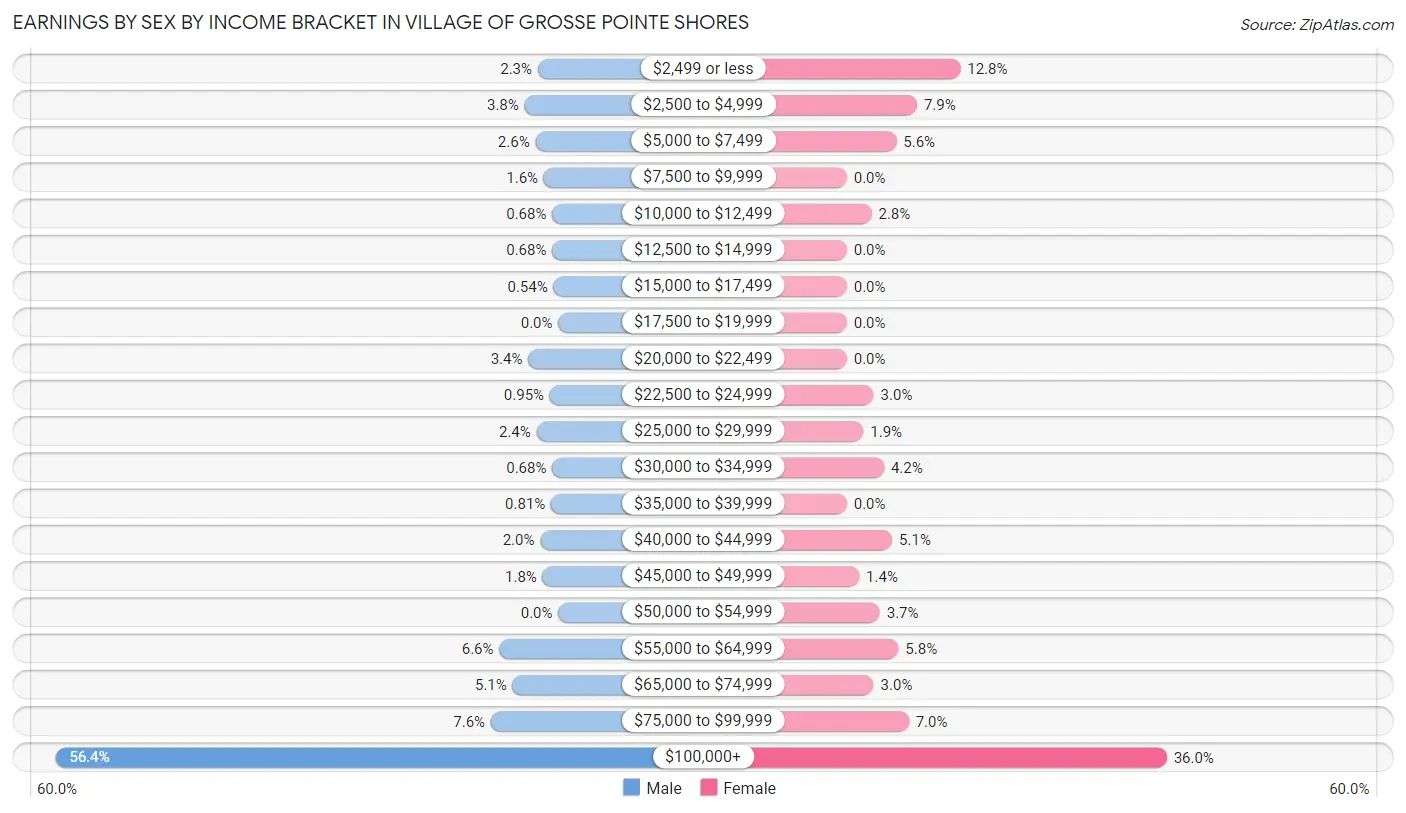
Earnings by Sex by Income Bracket in Village of Grosse Pointe Shores
The most common earnings brackets in Village of Grosse Pointe Shores are $100,000+ for men (417 | 56.4%) and $100,000+ for women (155 | 36.0%).
| Income | Male | Female |
| $2,499 or less | 17 (2.3%) | 55 (12.8%) |
| $2,500 to $4,999 | 28 (3.8%) | 34 (7.9%) |
| $5,000 to $7,499 | 19 (2.6%) | 24 (5.6%) |
| $7,500 to $9,999 | 12 (1.6%) | 0 (0.0%) |
| $10,000 to $12,499 | 5 (0.7%) | 12 (2.8%) |
| $12,500 to $14,999 | 5 (0.7%) | 0 (0.0%) |
| $15,000 to $17,499 | 4 (0.5%) | 0 (0.0%) |
| $17,500 to $19,999 | 0 (0.0%) | 0 (0.0%) |
| $20,000 to $22,499 | 25 (3.4%) | 0 (0.0%) |
| $22,500 to $24,999 | 7 (0.9%) | 13 (3.0%) |
| $25,000 to $29,999 | 18 (2.4%) | 8 (1.9%) |
| $30,000 to $34,999 | 5 (0.7%) | 18 (4.2%) |
| $35,000 to $39,999 | 6 (0.8%) | 0 (0.0%) |
| $40,000 to $44,999 | 15 (2.0%) | 22 (5.1%) |
| $45,000 to $49,999 | 13 (1.8%) | 6 (1.4%) |
| $50,000 to $54,999 | 0 (0.0%) | 16 (3.7%) |
| $55,000 to $64,999 | 49 (6.6%) | 25 (5.8%) |
| $65,000 to $74,999 | 38 (5.1%) | 13 (3.0%) |
| $75,000 to $99,999 | 56 (7.6%) | 30 (7.0%) |
| $100,000+ | 417 (56.4%) | 155 (36.0%) |
| Total | 739 (100.0%) | 431 (100.0%) |
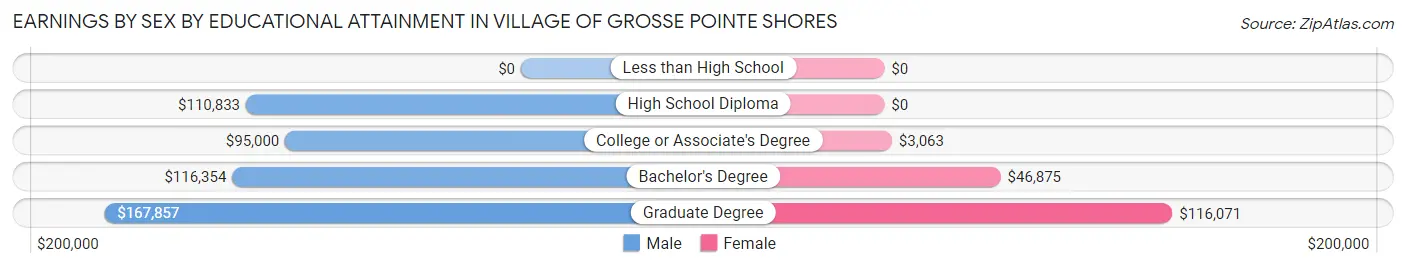
Earnings by Sex by Educational Attainment in Village of Grosse Pointe Shores
Average earnings in Village of Grosse Pointe Shores are $115,521 for men and $62,308 for women, a difference of 46.1%. Men with an educational attainment of graduate degree enjoy the highest average annual earnings of $167,857, while those with college or associate's degree education earn the least with $95,000. Women with an educational attainment of graduate degree earn the most with the average annual earnings of $116,071, while those with college or associate's degree education have the smallest earnings of $3,063.
| Educational Attainment | Male Income | Female Income |
| Less than High School | - | - |
| High School Diploma | $110,833 | $0 |
| College or Associate's Degree | $95,000 | $3,063 |
| Bachelor's Degree | $116,354 | $46,875 |
| Graduate Degree | $167,857 | $116,071 |
| Total | $115,521 | $62,308 |
Family Income in Village of Grosse Pointe Shores
Family Income Brackets in Village of Grosse Pointe Shores
According to the Village of Grosse Pointe Shores family income data, there are 382 families falling into the $200,000+ income range, which is the most common income bracket and makes up 51.5% of all families.
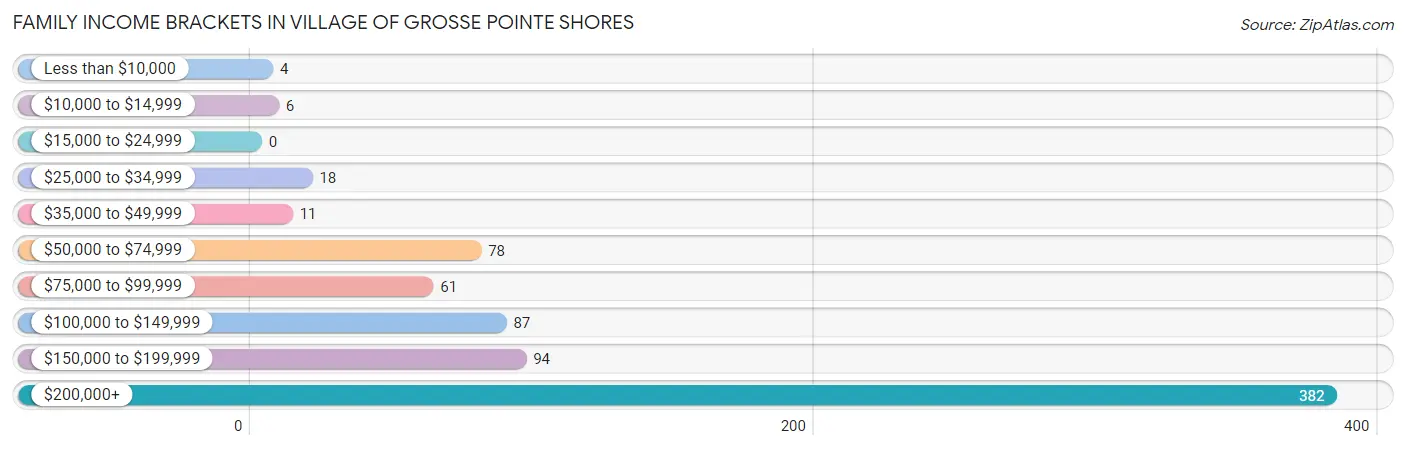
| Income Bracket | # Families | % Families |
| Less than $10,000 | 4 | 0.5% |
| $10,000 to $14,999 | 6 | 0.8% |
| $15,000 to $24,999 | 0 | 0.0% |
| $25,000 to $34,999 | 18 | 2.4% |
| $35,000 to $49,999 | 11 | 1.5% |
| $50,000 to $74,999 | 78 | 10.5% |
| $75,000 to $99,999 | 61 | 8.2% |
| $100,000 to $149,999 | 87 | 11.7% |
| $150,000 to $199,999 | 94 | 12.7% |
| $200,000+ | 382 | 51.6% |
Family Income by Famaliy Size in Village of Grosse Pointe Shores
4-person families (96 | 13.0%) account for the highest median family income in Village of Grosse Pointe Shores with $250,001 per family, while 2-person families (388 | 52.4%) have the highest median income of $96,389 per family member.
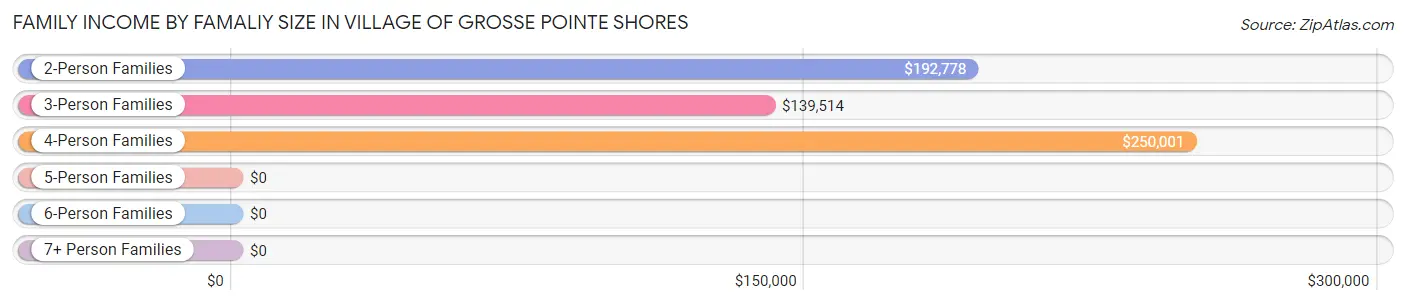
| Income Bracket | # Families | Median Income |
| 2-Person Families | 388 (52.4%) | $192,778 |
| 3-Person Families | 163 (22.0%) | $139,514 |
| 4-Person Families | 96 (13.0%) | $250,001 |
| 5-Person Families | 54 (7.3%) | $0 |
| 6-Person Families | 17 (2.3%) | $0 |
| 7+ Person Families | 23 (3.1%) | $0 |
| Total | 741 (100.0%) | $208,281 |
Family Income by Number of Earners in Village of Grosse Pointe Shores
The median family income in Village of Grosse Pointe Shores is $208,281, with families comprising 2 earners (290) having the highest median family income of $250,001, while families with no earners (154) have the lowest median family income of $87,019, accounting for 39.1% and 20.8% of families, respectively.
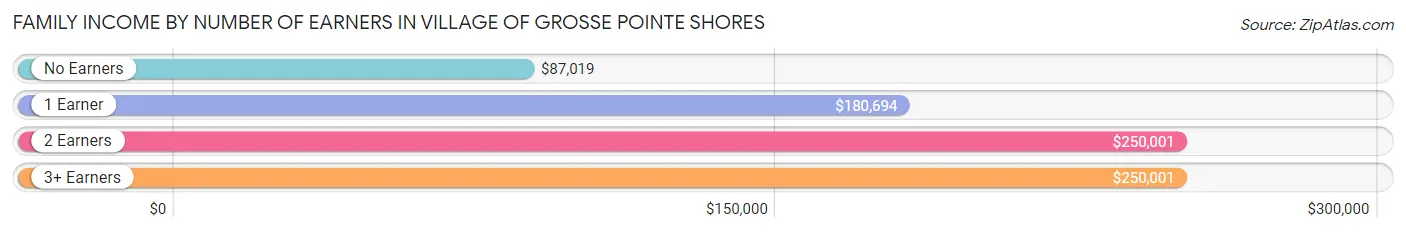
| Number of Earners | # Families | Median Income |
| No Earners | 154 (20.8%) | $87,019 |
| 1 Earner | 231 (31.2%) | $180,694 |
| 2 Earners | 290 (39.1%) | $250,001 |
| 3+ Earners | 66 (8.9%) | $250,001 |
| Total | 741 (100.0%) | $208,281 |
Household Income in Village of Grosse Pointe Shores
Household Income Brackets in Village of Grosse Pointe Shores
With 400 households falling in the category, the $200,000+ income range is the most frequent in Village of Grosse Pointe Shores, accounting for 40.7% of all households. In contrast, only 6 households (0.6%) fall into the $10,000 to $14,999 income bracket, making it the least populous group.
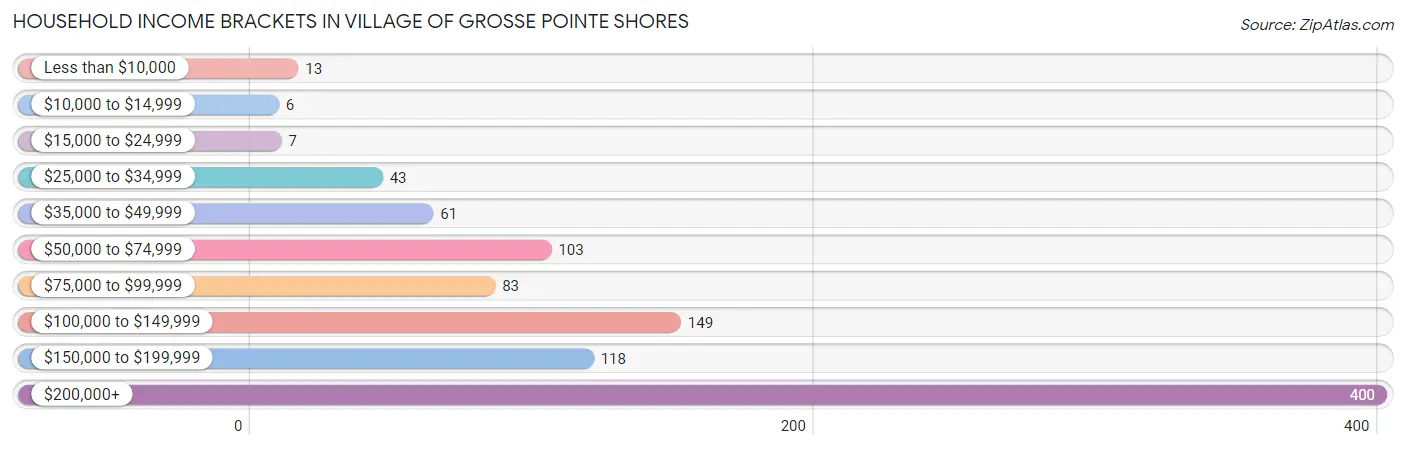
| Income Bracket | # Households | % Households |
| Less than $10,000 | 13 | 1.3% |
| $10,000 to $14,999 | 6 | 0.6% |
| $15,000 to $24,999 | 7 | 0.7% |
| $25,000 to $34,999 | 43 | 4.4% |
| $35,000 to $49,999 | 61 | 6.2% |
| $50,000 to $74,999 | 103 | 10.5% |
| $75,000 to $99,999 | 83 | 8.4% |
| $100,000 to $149,999 | 149 | 15.2% |
| $150,000 to $199,999 | 118 | 12.0% |
| $200,000+ | 400 | 40.7% |
Household Income by Householder Age in Village of Grosse Pointe Shores
The median household income in Village of Grosse Pointe Shores is $170,850, with the highest median household income of $247,273 found in the 45 to 64 years age bracket for the primary householder. A total of 330 households (33.6%) fall into this category.
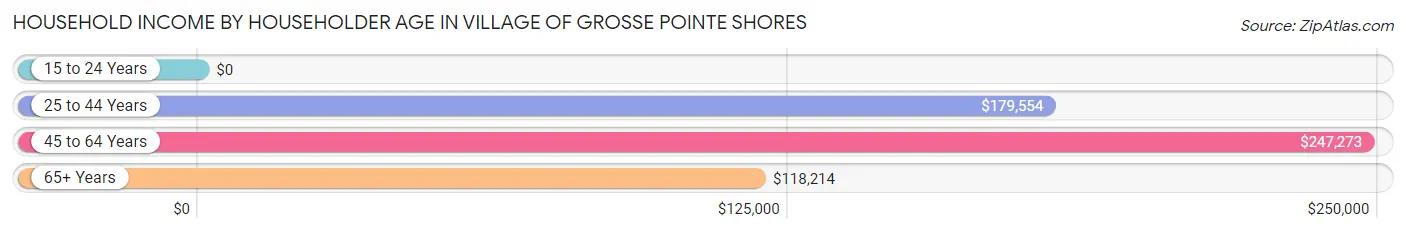
| Income Bracket | # Households | Median Income |
| 15 to 24 Years | 0 (0.0%) | $0 |
| 25 to 44 Years | 169 (17.2%) | $179,554 |
| 45 to 64 Years | 330 (33.6%) | $247,273 |
| 65+ Years | 484 (49.2%) | $118,214 |
| Total | 983 (100.0%) | $170,850 |
Poverty in Village of Grosse Pointe Shores
Income Below Poverty by Sex and Age in Village of Grosse Pointe Shores
With 1.5% poverty level for males and 2.1% for females among the residents of Village of Grosse Pointe Shores, 18 to 24 year old males and 25 to 34 year old females are the most vulnerable to poverty, with 5 males (5.9%) and 5 females (15.6%) in their respective age groups living below the poverty level.
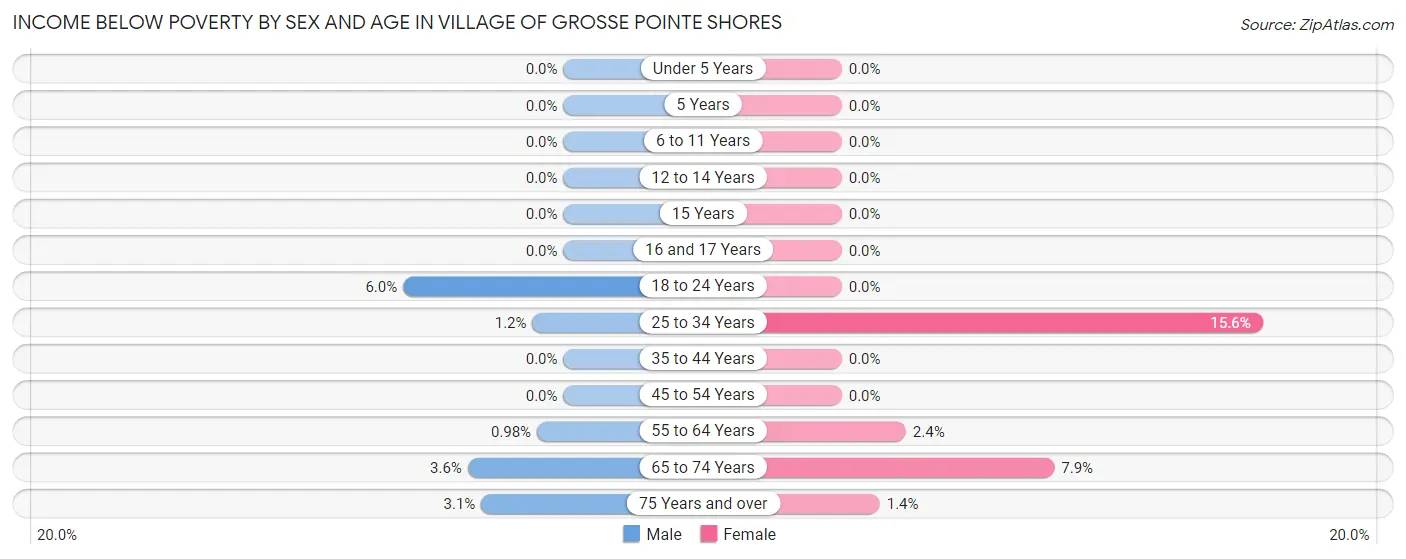
| Age Bracket | Male | Female |
| Under 5 Years | 0 (0.0%) | 0 (0.0%) |
| 5 Years | 0 (0.0%) | 0 (0.0%) |
| 6 to 11 Years | 0 (0.0%) | 0 (0.0%) |
| 12 to 14 Years | 0 (0.0%) | 0 (0.0%) |
| 15 Years | 0 (0.0%) | 0 (0.0%) |
| 16 and 17 Years | 0 (0.0%) | 0 (0.0%) |
| 18 to 24 Years | 5 (5.9%) | 0 (0.0%) |
| 25 to 34 Years | 1 (1.1%) | 5 (15.6%) |
| 35 to 44 Years | 0 (0.0%) | 0 (0.0%) |
| 45 to 54 Years | 0 (0.0%) | 0 (0.0%) |
| 55 to 64 Years | 2 (1.0%) | 5 (2.4%) |
| 65 to 74 Years | 7 (3.5%) | 15 (7.9%) |
| 75 Years and over | 5 (3.0%) | 3 (1.4%) |
| Total | 20 (1.5%) | 28 (2.1%) |
Income Above Poverty by Sex and Age in Village of Grosse Pointe Shores
According to the poverty statistics in Village of Grosse Pointe Shores, males aged under 5 years and females aged under 5 years are the age groups that are most secure financially, with 100.0% of males and 100.0% of females in these age groups living above the poverty line.
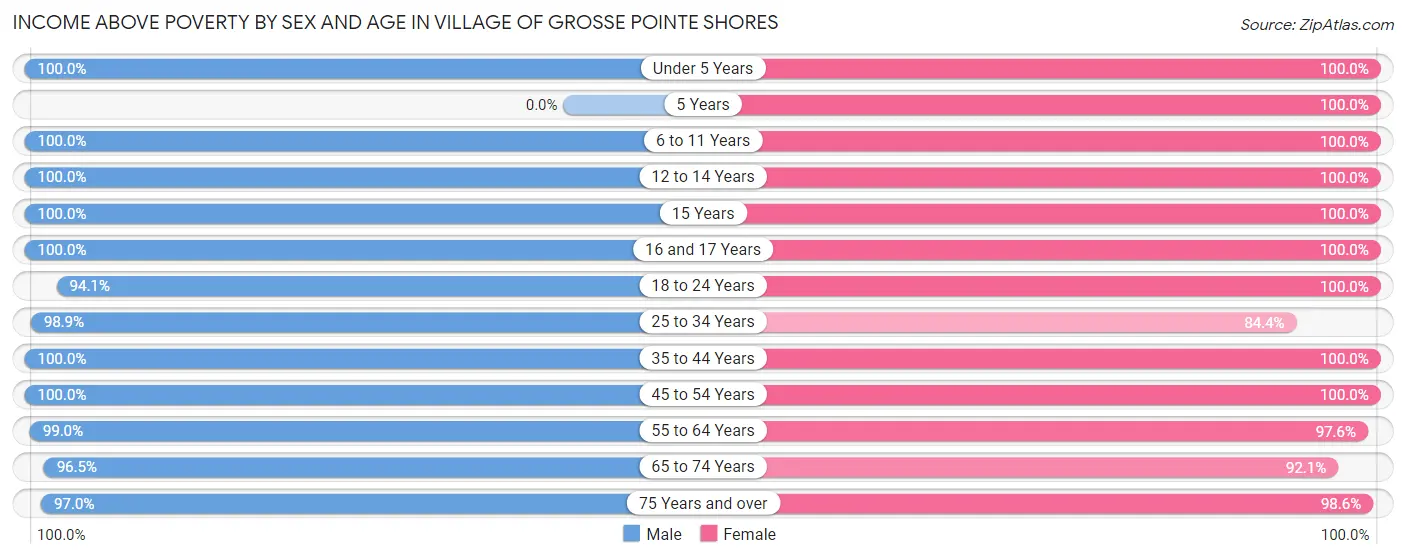
| Age Bracket | Male | Female |
| Under 5 Years | 107 (100.0%) | 94 (100.0%) |
| 5 Years | 0 (0.0%) | 24 (100.0%) |
| 6 to 11 Years | 102 (100.0%) | 97 (100.0%) |
| 12 to 14 Years | 19 (100.0%) | 68 (100.0%) |
| 15 Years | 40 (100.0%) | 6 (100.0%) |
| 16 and 17 Years | 8 (100.0%) | 21 (100.0%) |
| 18 to 24 Years | 79 (94.1%) | 31 (100.0%) |
| 25 to 34 Years | 86 (98.9%) | 27 (84.4%) |
| 35 to 44 Years | 142 (100.0%) | 178 (100.0%) |
| 45 to 54 Years | 146 (100.0%) | 141 (100.0%) |
| 55 to 64 Years | 203 (99.0%) | 205 (97.6%) |
| 65 to 74 Years | 190 (96.5%) | 175 (92.1%) |
| 75 Years and over | 159 (97.0%) | 210 (98.6%) |
| Total | 1,281 (98.5%) | 1,277 (97.9%) |
Income Below Poverty Among Married-Couple Families in Village of Grosse Pointe Shores
The poverty statistics for married-couple families in Village of Grosse Pointe Shores show that 1.4% or 10 of the total 725 families live below the poverty line. Families with no children have the highest poverty rate of 2.0%, comprising of 10 families. On the other hand, families with 1 or 2 children have the lowest poverty rate of 0.0%, which includes 0 families.
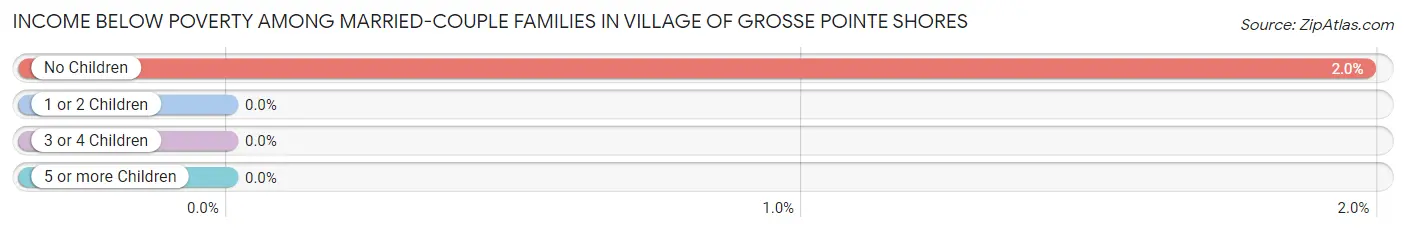
| Children | Above Poverty | Below Poverty |
| No Children | 496 (98.0%) | 10 (2.0%) |
| 1 or 2 Children | 133 (100.0%) | 0 (0.0%) |
| 3 or 4 Children | 71 (100.0%) | 0 (0.0%) |
| 5 or more Children | 15 (100.0%) | 0 (0.0%) |
| Total | 715 (98.6%) | 10 (1.4%) |
Income Below Poverty Among Single-Parent Households in Village of Grosse Pointe Shores
| Children | Single Father | Single Mother |
| No Children | 0 (0.0%) | 0 (0.0%) |
| 1 or 2 Children | 0 (0.0%) | 0 (0.0%) |
| 3 or 4 Children | 0 (0.0%) | 0 (0.0%) |
| 5 or more Children | 0 (0.0%) | 0 (0.0%) |
| Total | 0 (0.0%) | 0 (0.0%) |
Income Below Poverty Among Married-Couple vs Single-Parent Households in Village of Grosse Pointe Shores
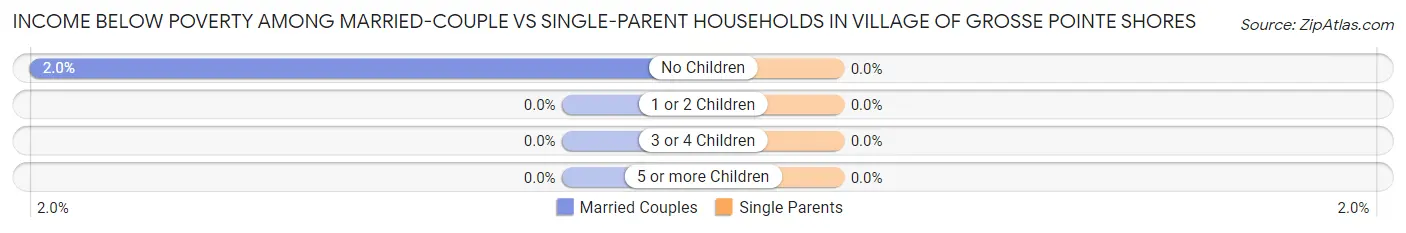
| Children | Married-Couple Families | Single-Parent Households |
| No Children | 10 (2.0%) | 0 (0.0%) |
| 1 or 2 Children | 0 (0.0%) | 0 (0.0%) |
| 3 or 4 Children | 0 (0.0%) | 0 (0.0%) |
| 5 or more Children | 0 (0.0%) | 0 (0.0%) |
| Total | 10 (1.4%) | 0 (0.0%) |
Race in Village of Grosse Pointe Shores
The most populous races in Village of Grosse Pointe Shores are White / Caucasian (2,345 | 89.8%), Asian (187 | 7.2%), and Two or more Races (77 | 2.9%).
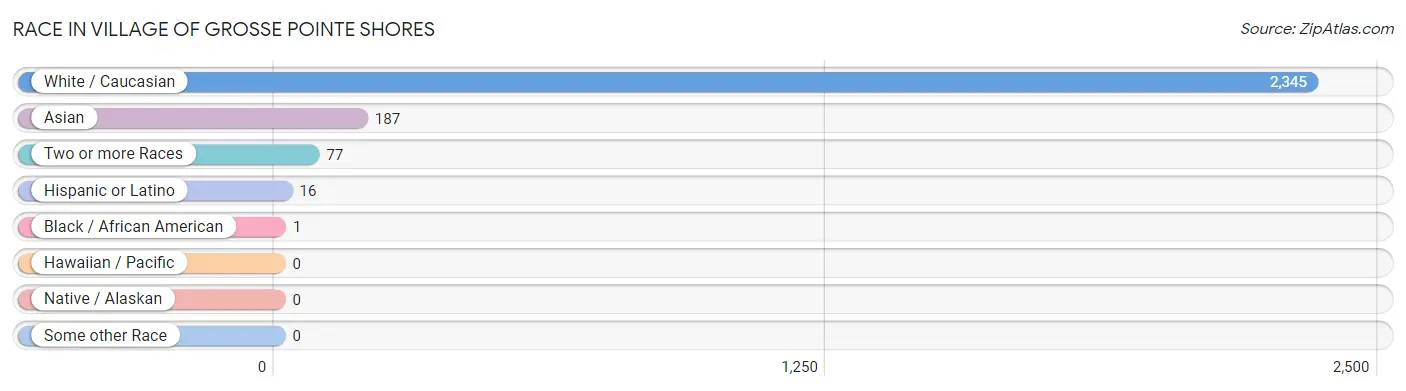
| Race | # Population | % Population |
| Asian | 187 | 7.2% |
| Black / African American | 1 | 0.0% |
| Hawaiian / Pacific | 0 | 0.0% |
| Hispanic or Latino | 16 | 0.6% |
| Native / Alaskan | 0 | 0.0% |
| White / Caucasian | 2,345 | 89.8% |
| Two or more Races | 77 | 2.9% |
| Some other Race | 0 | 0.0% |
| Total | 2,610 | 100.0% |
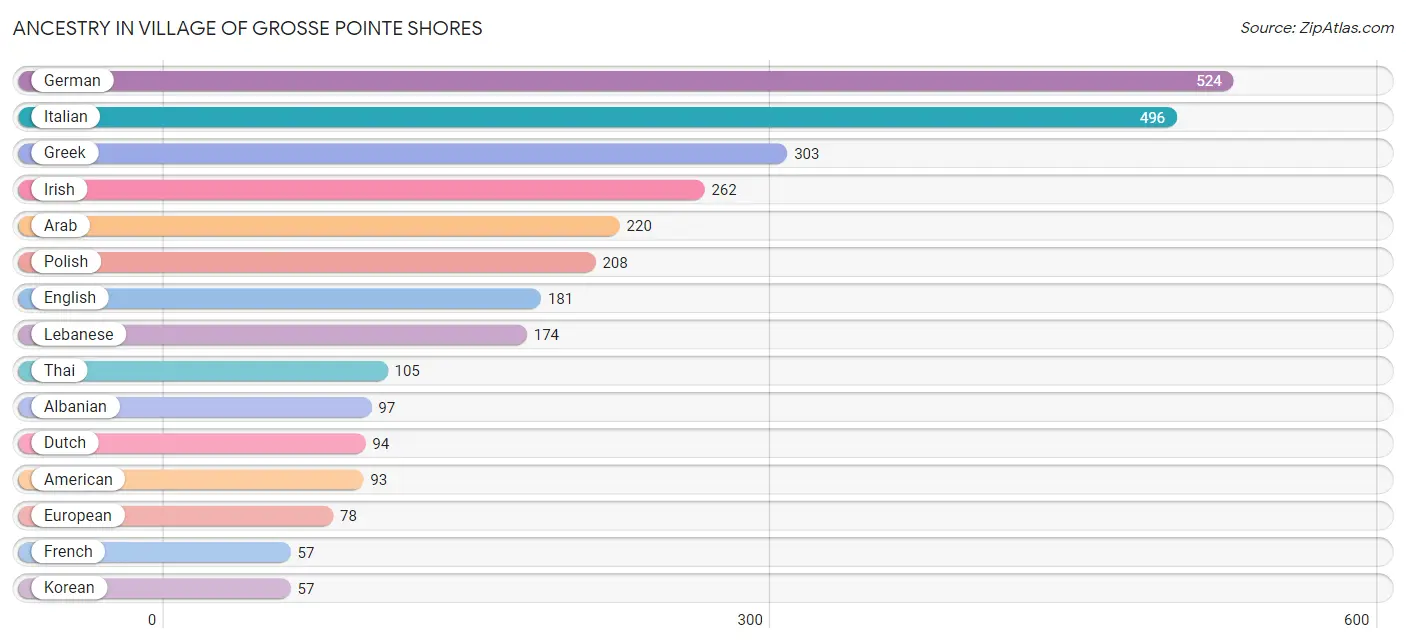
Ancestry in Village of Grosse Pointe Shores
The most populous ancestries reported in Village of Grosse Pointe Shores are German (524 | 20.1%), Italian (496 | 19.0%), Greek (303 | 11.6%), Irish (262 | 10.0%), and Arab (220 | 8.4%), together accounting for 69.2% of all Village of Grosse Pointe Shores residents.
| Ancestry | # Population | % Population |
| Albanian | 97 | 3.7% |
| American | 93 | 3.6% |
| Arab | 220 | 8.4% |
| Armenian | 7 | 0.3% |
| Austrian | 16 | 0.6% |
| Belgian | 37 | 1.4% |
| Bhutanese | 17 | 0.6% |
| British | 15 | 0.6% |
| Burmese | 6 | 0.2% |
| Canadian | 6 | 0.2% |
| Cherokee | 10 | 0.4% |
| Czech | 12 | 0.5% |
| Dutch | 94 | 3.6% |
| Eastern European | 17 | 0.6% |
| Egyptian | 16 | 0.6% |
| English | 181 | 6.9% |
| European | 78 | 3.0% |
| French | 57 | 2.2% |
| French Canadian | 41 | 1.6% |
| German | 524 | 20.1% |
| Greek | 303 | 11.6% |
| Hungarian | 31 | 1.2% |
| Indian (Asian) | 31 | 1.2% |
| Iranian | 18 | 0.7% |
| Irish | 262 | 10.0% |
| Italian | 496 | 19.0% |
| Japanese | 1 | 0.0% |
| Korean | 57 | 2.2% |
| Lebanese | 174 | 6.7% |
| Macedonian | 31 | 1.2% |
| Native Hawaiian | 17 | 0.6% |
| Norwegian | 27 | 1.0% |
| Polish | 208 | 8.0% |
| Romanian | 10 | 0.4% |
| Russian | 14 | 0.5% |
| Scandinavian | 5 | 0.2% |
| Scotch-Irish | 6 | 0.2% |
| Scottish | 14 | 0.5% |
| Serbian | 38 | 1.5% |
| Slovak | 17 | 0.6% |
| Spanish | 16 | 0.6% |
| Sri Lankan | 5 | 0.2% |
| Swedish | 8 | 0.3% |
| Syrian | 37 | 1.4% |
| Thai | 105 | 4.0% |
| Ukrainian | 22 | 0.8% | View All 46 Rows |
Immigrants in Village of Grosse Pointe Shores
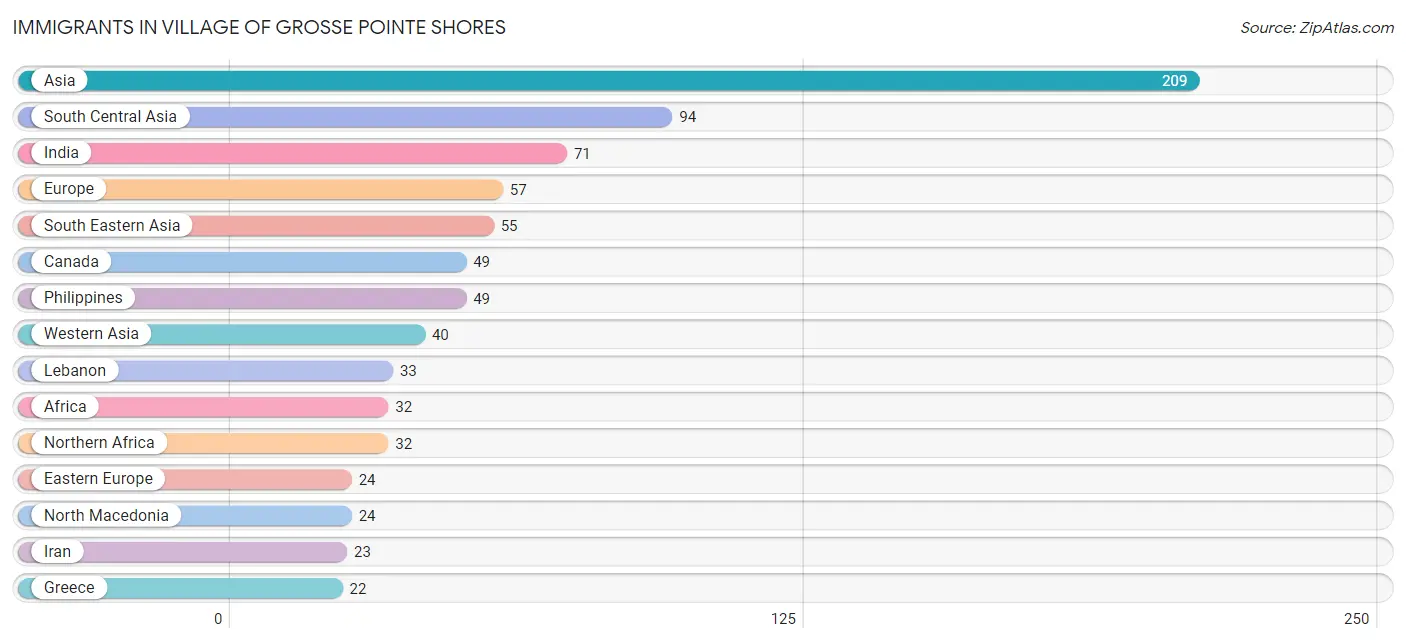
The most numerous immigrant groups reported in Village of Grosse Pointe Shores came from Asia (209 | 8.0%), South Central Asia (94 | 3.6%), India (71 | 2.7%), Europe (57 | 2.2%), and South Eastern Asia (55 | 2.1%), together accounting for 18.6% of all Village of Grosse Pointe Shores residents.
| Immigration Origin | # Population | % Population |
| Africa | 32 | 1.2% |
| Asia | 209 | 8.0% |
| Cambodia | 1 | 0.0% |
| Canada | 49 | 1.9% |
| China | 14 | 0.5% |
| Eastern Asia | 20 | 0.8% |
| Eastern Europe | 24 | 0.9% |
| Egypt | 16 | 0.6% |
| Europe | 57 | 2.2% |
| Greece | 22 | 0.8% |
| India | 71 | 2.7% |
| Iran | 23 | 0.9% |
| Korea | 6 | 0.2% |
| Lebanon | 33 | 1.3% |
| North Macedonia | 24 | 0.9% |
| Northern Africa | 32 | 1.2% |
| Northern Europe | 11 | 0.4% |
| Philippines | 49 | 1.9% |
| South Central Asia | 94 | 3.6% |
| South Eastern Asia | 55 | 2.1% |
| Southern Europe | 22 | 0.8% |
| Syria | 7 | 0.3% |
| Vietnam | 5 | 0.2% |
| Western Asia | 40 | 1.5% | View All 24 Rows |
Sex and Age in Village of Grosse Pointe Shores
Sex and Age in Village of Grosse Pointe Shores
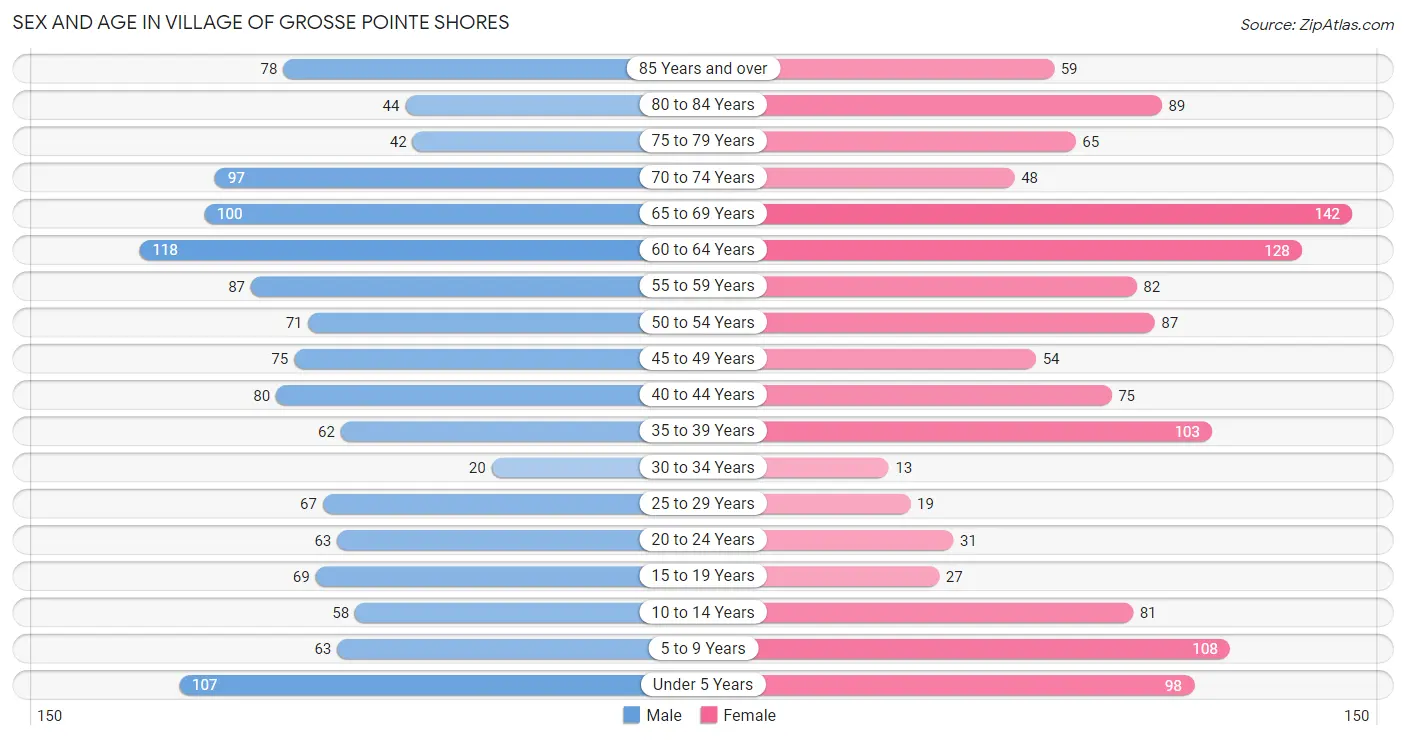
The most populous age groups in Village of Grosse Pointe Shores are 60 to 64 Years (118 | 9.1%) for men and 65 to 69 Years (142 | 10.8%) for women.
| Age Bracket | Male | Female |
| Under 5 Years | 107 (8.2%) | 98 (7.5%) |
| 5 to 9 Years | 63 (4.8%) | 108 (8.3%) |
| 10 to 14 Years | 58 (4.5%) | 81 (6.2%) |
| 15 to 19 Years | 69 (5.3%) | 27 (2.1%) |
| 20 to 24 Years | 63 (4.8%) | 31 (2.4%) |
| 25 to 29 Years | 67 (5.1%) | 19 (1.5%) |
| 30 to 34 Years | 20 (1.5%) | 13 (1.0%) |
| 35 to 39 Years | 62 (4.8%) | 103 (7.9%) |
| 40 to 44 Years | 80 (6.1%) | 75 (5.7%) |
| 45 to 49 Years | 75 (5.8%) | 54 (4.1%) |
| 50 to 54 Years | 71 (5.5%) | 87 (6.7%) |
| 55 to 59 Years | 87 (6.7%) | 82 (6.3%) |
| 60 to 64 Years | 118 (9.1%) | 128 (9.8%) |
| 65 to 69 Years | 100 (7.7%) | 142 (10.8%) |
| 70 to 74 Years | 97 (7.5%) | 48 (3.7%) |
| 75 to 79 Years | 42 (3.2%) | 65 (5.0%) |
| 80 to 84 Years | 44 (3.4%) | 89 (6.8%) |
| 85 Years and over | 78 (6.0%) | 59 (4.5%) |
| Total | 1,301 (100.0%) | 1,309 (100.0%) |
Families and Households in Village of Grosse Pointe Shores
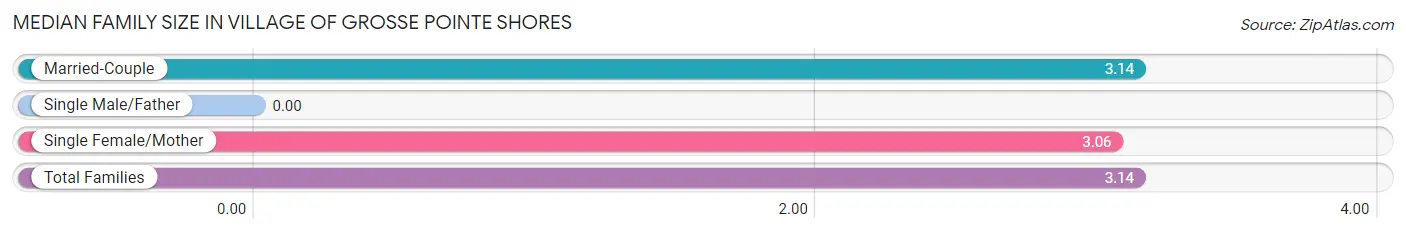
Median Family Size in Village of Grosse Pointe Shores
| Family Type | # Families | Family Size |
| Married-Couple | 725 (97.8%) | 3.14 |
| Single Male/Father | 0 (0.0%) | - |
| Single Female/Mother | 16 (2.2%) | 3.06 |
| Total Families | 741 (100.0%) | 3.14 |
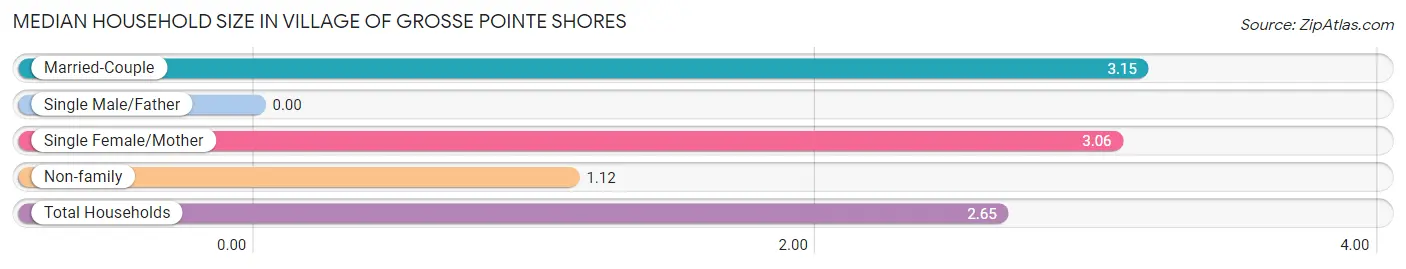
Median Household Size in Village of Grosse Pointe Shores
| Household Type | # Households | Household Size |
| Married-Couple | 725 (73.8%) | 3.15 |
| Single Male/Father | 0 (0.0%) | - |
| Single Female/Mother | 16 (1.6%) | 3.06 |
| Non-family | 242 (24.6%) | 1.12 |
| Total Households | 983 (100.0%) | 2.65 |
Household Size by Marriage Status in Village of Grosse Pointe Shores
Out of a total of 983 households in Village of Grosse Pointe Shores, 741 (75.4%) are family households, while 242 (24.6%) are nonfamily households. The most numerous type of family households are 2-person households, comprising 388, and the most common type of nonfamily households are 1-person households, comprising 221.
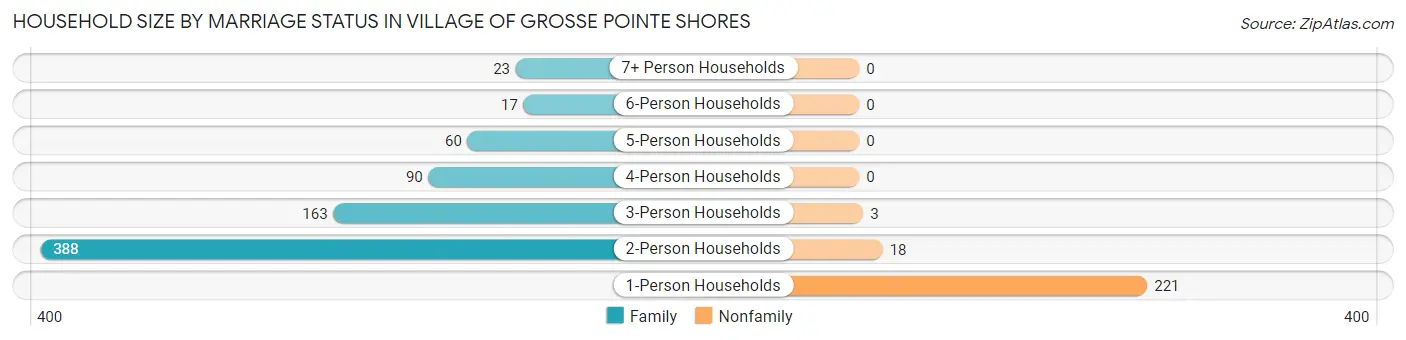
| Household Size | Family Households | Nonfamily Households |
| 1-Person Households | - | 221 (22.5%) |
| 2-Person Households | 388 (39.5%) | 18 (1.8%) |
| 3-Person Households | 163 (16.6%) | 3 (0.3%) |
| 4-Person Households | 90 (9.2%) | 0 (0.0%) |
| 5-Person Households | 60 (6.1%) | 0 (0.0%) |
| 6-Person Households | 17 (1.7%) | 0 (0.0%) |
| 7+ Person Households | 23 (2.3%) | 0 (0.0%) |
| Total | 741 (75.4%) | 242 (24.6%) |
Female Fertility in Village of Grosse Pointe Shores
Fertility by Age in Village of Grosse Pointe Shores
Average fertility rate in Village of Grosse Pointe Shores is 20.0 births per 1,000 women. Women in the age bracket of 20 to 34 years have the highest fertility rate with 48.0 births per 1,000 women. Women in the age bracket of 35 to 50 years acount for 57.1% of all women with births.
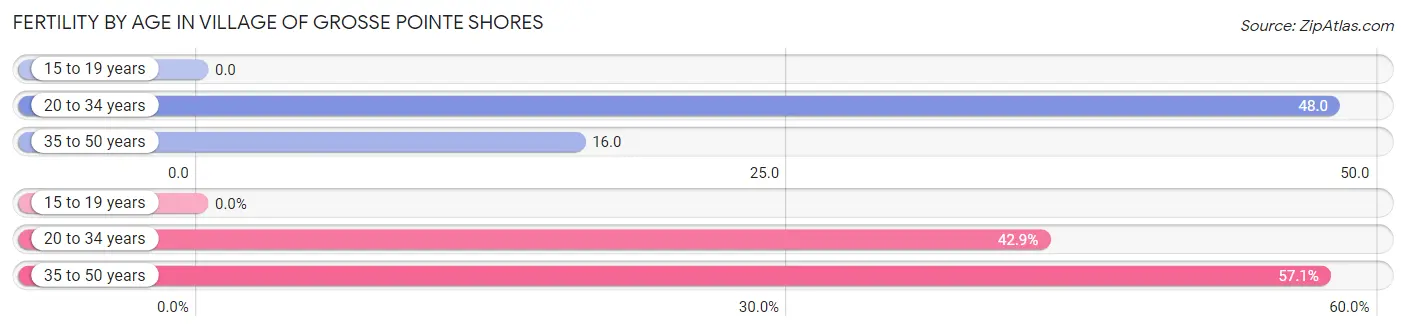
| Age Bracket | Women with Births | Births / 1,000 Women |
| 15 to 19 years | 0 (0.0%) | 0.0 |
| 20 to 34 years | 3 (42.9%) | 48.0 |
| 35 to 50 years | 4 (57.1%) | 16.0 |
| Total | 7 (100.0%) | 20.0 |
Fertility by Age by Marriage Status in Village of Grosse Pointe Shores
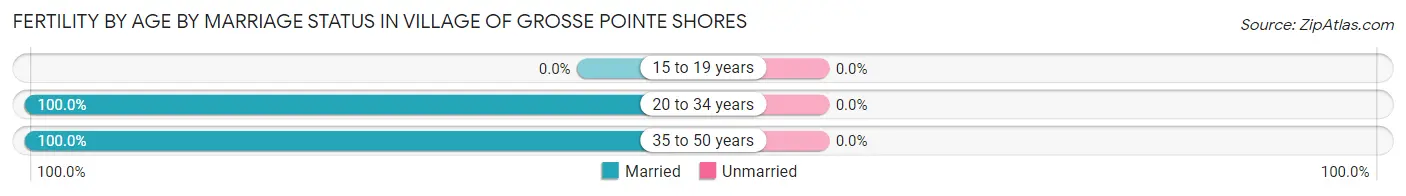
| Age Bracket | Married | Unmarried |
| 15 to 19 years | 0 (0.0%) | 0 (0.0%) |
| 20 to 34 years | 3 (100.0%) | 0 (0.0%) |
| 35 to 50 years | 4 (100.0%) | 0 (0.0%) |
| Total | 7 (100.0%) | 0 (0.0%) |
Fertility by Education in Village of Grosse Pointe Shores
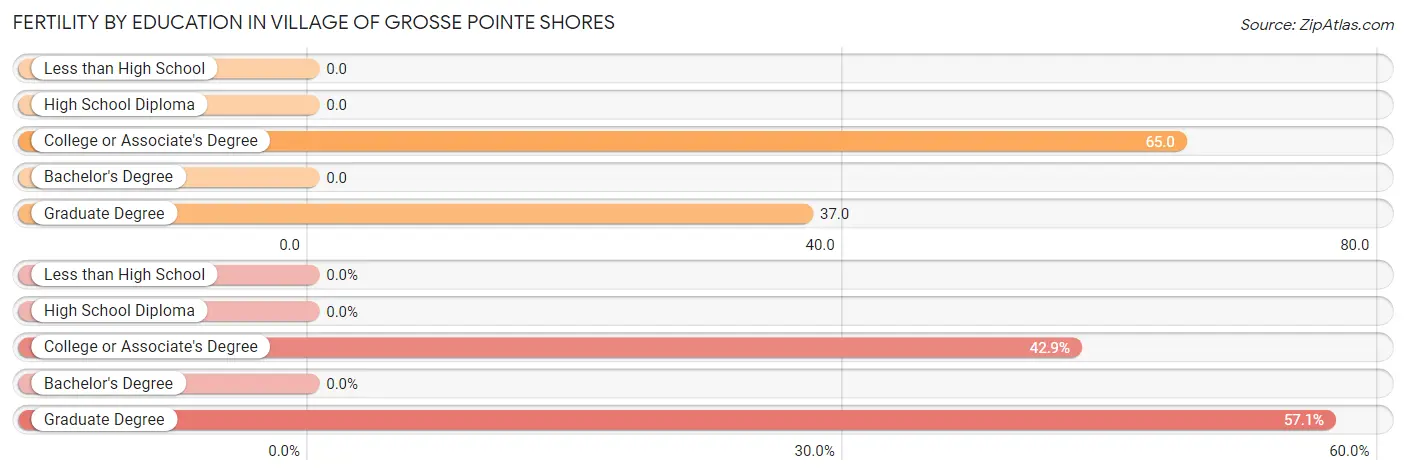
| Educational Attainment | Women with Births | Births / 1,000 Women |
| Less than High School | 0 (0.0%) | 0.0 |
| High School Diploma | 0 (0.0%) | 0.0 |
| College or Associate's Degree | 3 (42.9%) | 65.0 |
| Bachelor's Degree | 0 (0.0%) | 0.0 |
| Graduate Degree | 4 (57.1%) | 37.0 |
| Total | 7 (100.0%) | 20.0 |
Fertility by Education by Marriage Status in Village of Grosse Pointe Shores
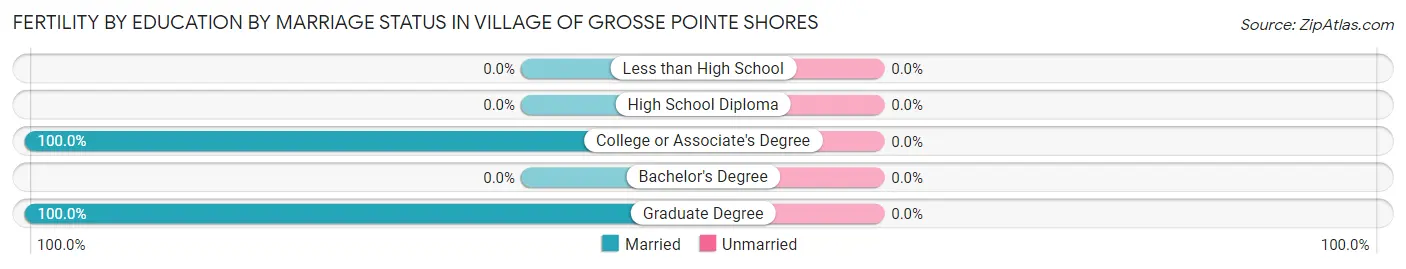
| Educational Attainment | Married | Unmarried |
| Less than High School | 0 (0.0%) | 0 (0.0%) |
| High School Diploma | 0 (0.0%) | 0 (0.0%) |
| College or Associate's Degree | 3 (100.0%) | 0 (0.0%) |
| Bachelor's Degree | 0 (0.0%) | 0 (0.0%) |
| Graduate Degree | 4 (100.0%) | 0 (0.0%) |
| Total | 7 (100.0%) | 0 (0.0%) |
Employment Characteristics in Village of Grosse Pointe Shores
Employment by Class of Employer in Village of Grosse Pointe Shores
Among the 1,087 employed individuals in Village of Grosse Pointe Shores, private company employees (647 | 59.5%), self-employed (incorporated) (202 | 18.6%), and not-for-profit organizations (125 | 11.5%) make up the most common classes of employment.
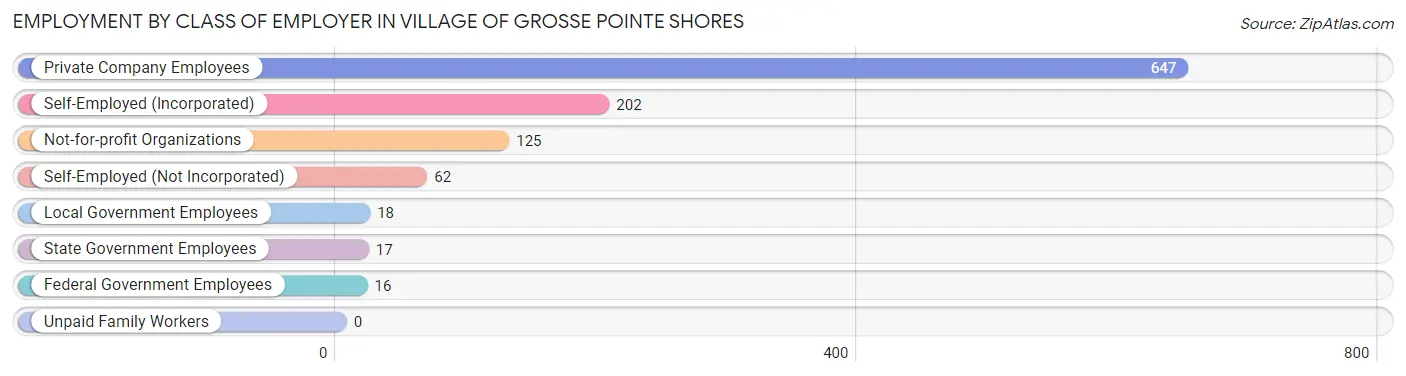
| Employer Class | # Employees | % Employees |
| Private Company Employees | 647 | 59.5% |
| Self-Employed (Incorporated) | 202 | 18.6% |
| Self-Employed (Not Incorporated) | 62 | 5.7% |
| Not-for-profit Organizations | 125 | 11.5% |
| Local Government Employees | 18 | 1.7% |
| State Government Employees | 17 | 1.6% |
| Federal Government Employees | 16 | 1.5% |
| Unpaid Family Workers | 0 | 0.0% |
| Total | 1,087 | 100.0% |
Employment Status by Age in Village of Grosse Pointe Shores
According to the labor force statistics for Village of Grosse Pointe Shores, out of the total population over 16 years of age (2,049), 54.2% or 1,111 individuals are in the labor force, with 1.1% or 12 of them unemployed. The age group with the highest labor force participation rate is 30 to 34 years, with 87.9% or 29 individuals in the labor force. Within the labor force, the 20 to 24 years age range has the highest percentage of unemployed individuals, with 18.2% or 12 of them being unemployed.
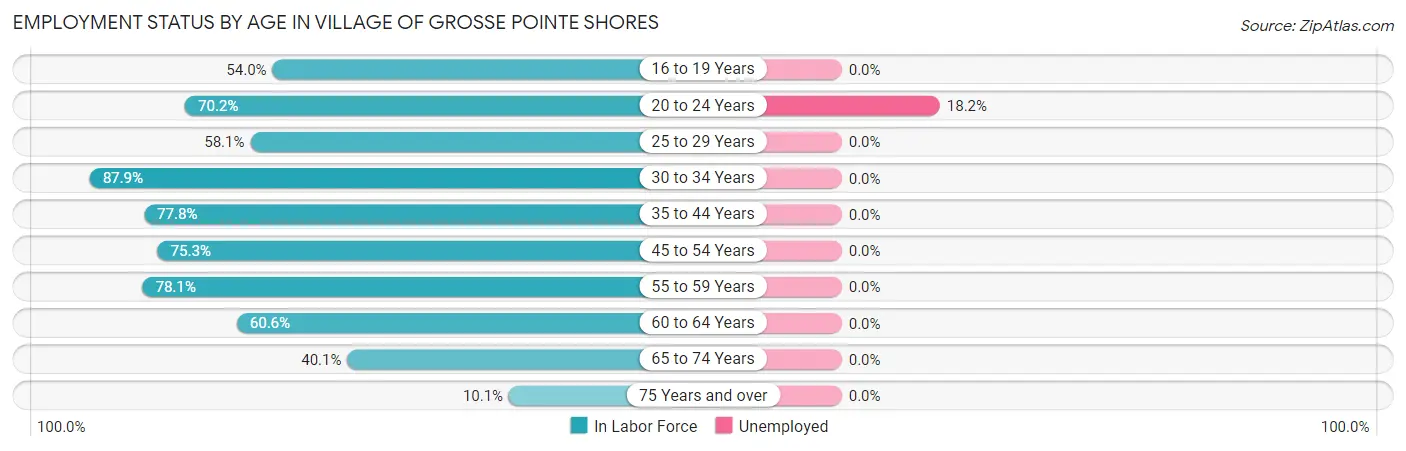
| Age Bracket | In Labor Force | Unemployed |
| 16 to 19 Years | 27 (54.0%) | 0 (0.0%) |
| 20 to 24 Years | 66 (70.2%) | 12 (18.2%) |
| 25 to 29 Years | 50 (58.1%) | 0 (0.0%) |
| 30 to 34 Years | 29 (87.9%) | 0 (0.0%) |
| 35 to 44 Years | 249 (77.8%) | 0 (0.0%) |
| 45 to 54 Years | 216 (75.3%) | 0 (0.0%) |
| 55 to 59 Years | 132 (78.1%) | 0 (0.0%) |
| 60 to 64 Years | 149 (60.6%) | 0 (0.0%) |
| 65 to 74 Years | 155 (40.1%) | 0 (0.0%) |
| 75 Years and over | 38 (10.1%) | 0 (0.0%) |
| Total | 1,111 (54.2%) | 12 (1.1%) |
Employment Status by Educational Attainment in Village of Grosse Pointe Shores
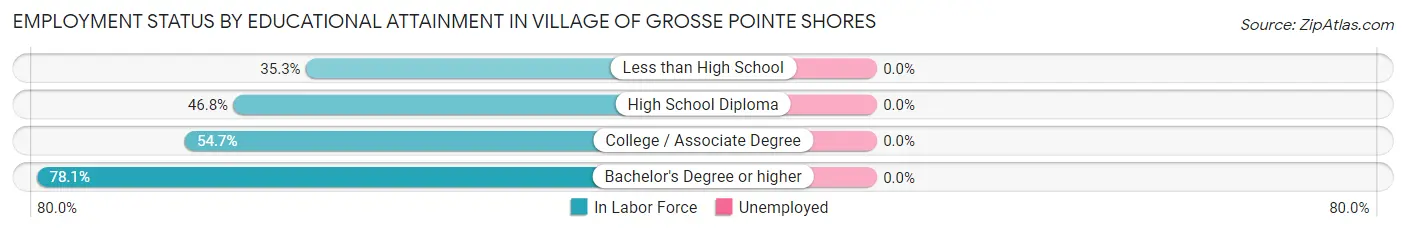
| Educational Attainment | In Labor Force | Unemployed |
| Less than High School | 6 (35.3%) | 0 (0.0%) |
| High School Diploma | 36 (46.8%) | 0 (0.0%) |
| College / Associate Degree | 82 (54.7%) | 0 (0.0%) |
| Bachelor's Degree or higher | 701 (78.1%) | 0 (0.0%) |
| Total | 825 (72.3%) | 0 (0.0%) |
Employment Occupations by Sex in Village of Grosse Pointe Shores
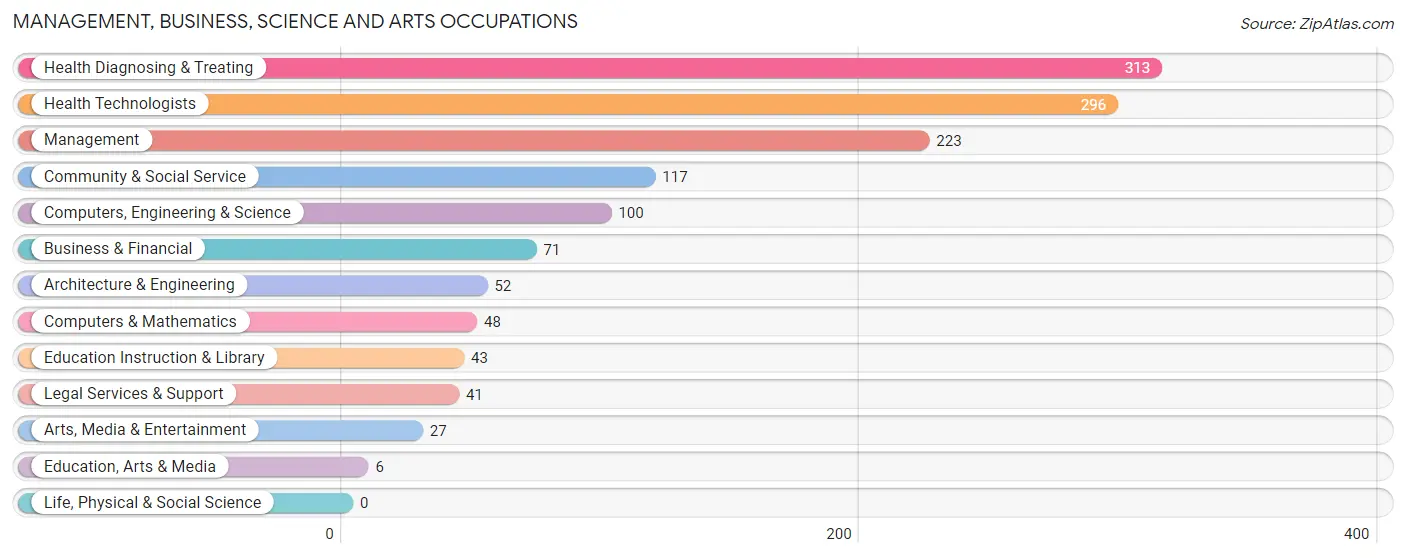
Management, Business, Science and Arts Occupations
The most common Management, Business, Science and Arts occupations in Village of Grosse Pointe Shores are Health Diagnosing & Treating (313 | 28.5%), Health Technologists (296 | 26.9%), Management (223 | 20.3%), Community & Social Service (117 | 10.6%), and Computers, Engineering & Science (100 | 9.1%).
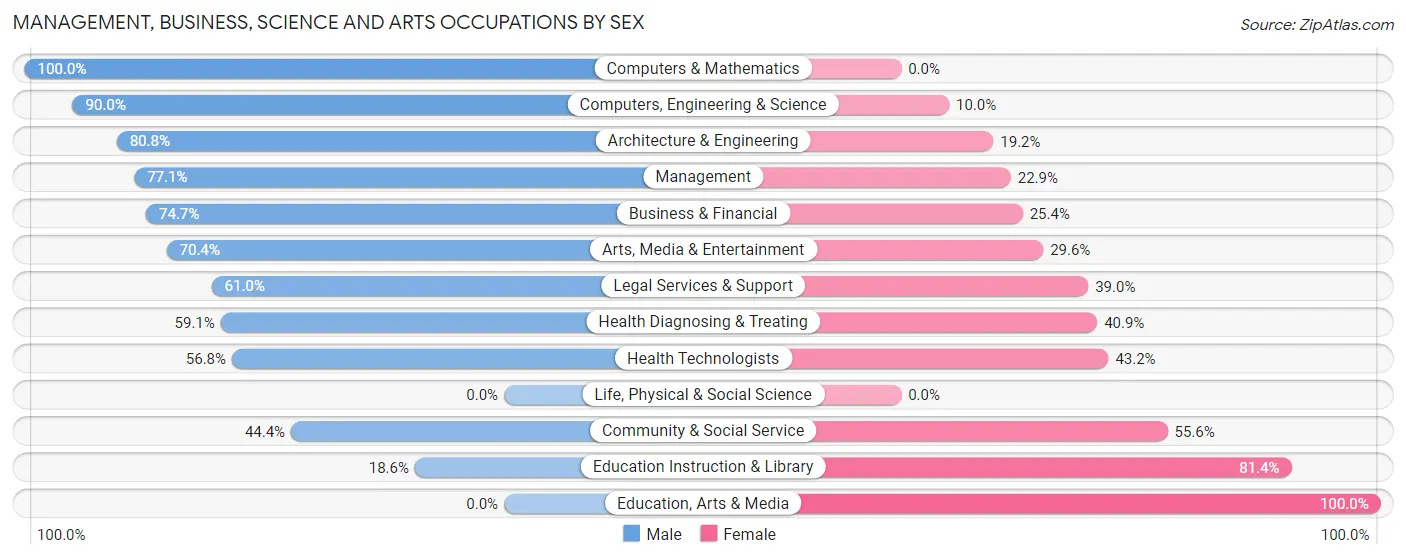
Management, Business, Science and Arts Occupations by Sex
Within the Management, Business, Science and Arts occupations in Village of Grosse Pointe Shores, the most male-oriented occupations are Computers & Mathematics (100.0%), Computers, Engineering & Science (90.0%), and Architecture & Engineering (80.8%), while the most female-oriented occupations are Education, Arts & Media (100.0%), Education Instruction & Library (81.4%), and Community & Social Service (55.6%).
| Occupation | Male | Female |
| Management | 172 (77.1%) | 51 (22.9%) |
| Business & Financial | 53 (74.7%) | 18 (25.4%) |
| Computers, Engineering & Science | 90 (90.0%) | 10 (10.0%) |
| Computers & Mathematics | 48 (100.0%) | 0 (0.0%) |
| Architecture & Engineering | 42 (80.8%) | 10 (19.2%) |
| Life, Physical & Social Science | 0 (0.0%) | 0 (0.0%) |
| Community & Social Service | 52 (44.4%) | 65 (55.6%) |
| Education, Arts & Media | 0 (0.0%) | 6 (100.0%) |
| Legal Services & Support | 25 (61.0%) | 16 (39.0%) |
| Education Instruction & Library | 8 (18.6%) | 35 (81.4%) |
| Arts, Media & Entertainment | 19 (70.4%) | 8 (29.6%) |
| Health Diagnosing & Treating | 185 (59.1%) | 128 (40.9%) |
| Health Technologists | 168 (56.8%) | 128 (43.2%) |
| Total (Category) | 552 (67.0%) | 272 (33.0%) |
| Total (Overall) | 705 (64.1%) | 394 (35.8%) |
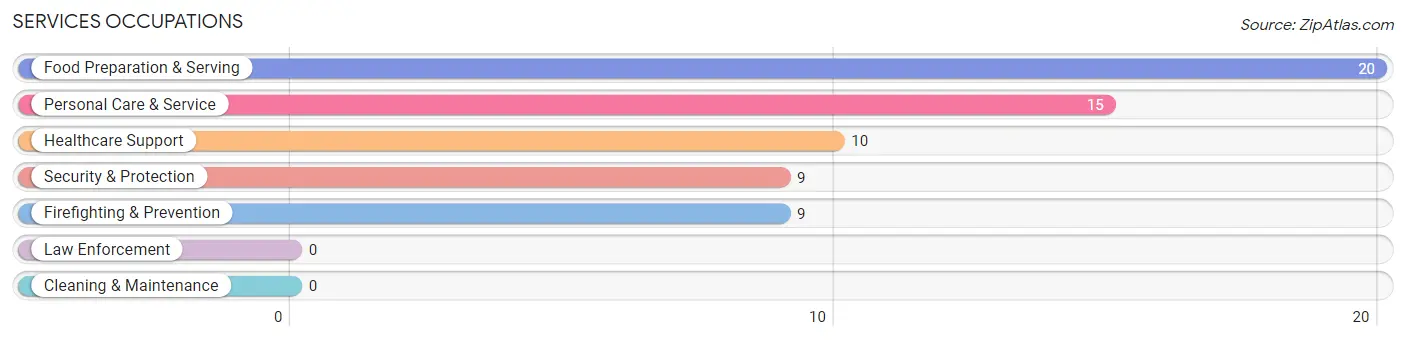
Services Occupations
The most common Services occupations in Village of Grosse Pointe Shores are Food Preparation & Serving (20 | 1.8%), Personal Care & Service (15 | 1.4%), Healthcare Support (10 | 0.9%), Security & Protection (9 | 0.8%), and Firefighting & Prevention (9 | 0.8%).
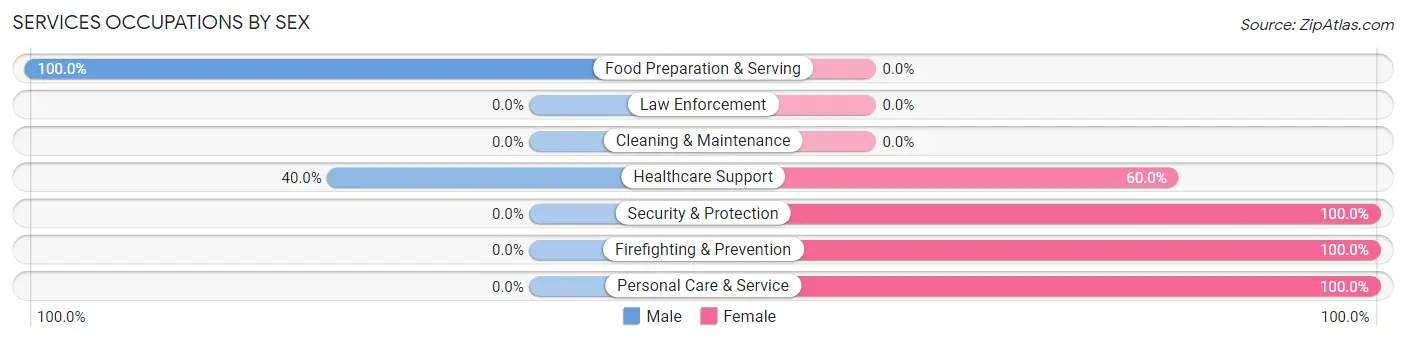
Services Occupations by Sex
Within the Services occupations in Village of Grosse Pointe Shores, the most male-oriented occupations are Food Preparation & Serving (100.0%), and Healthcare Support (40.0%), while the most female-oriented occupations are Security & Protection (100.0%), Firefighting & Prevention (100.0%), and Personal Care & Service (100.0%).
| Occupation | Male | Female |
| Healthcare Support | 4 (40.0%) | 6 (60.0%) |
| Security & Protection | 0 (0.0%) | 9 (100.0%) |
| Firefighting & Prevention | 0 (0.0%) | 9 (100.0%) |
| Law Enforcement | 0 (0.0%) | 0 (0.0%) |
| Food Preparation & Serving | 20 (100.0%) | 0 (0.0%) |
| Cleaning & Maintenance | 0 (0.0%) | 0 (0.0%) |
| Personal Care & Service | 0 (0.0%) | 15 (100.0%) |
| Total (Category) | 24 (44.4%) | 30 (55.6%) |
| Total (Overall) | 705 (64.1%) | 394 (35.8%) |
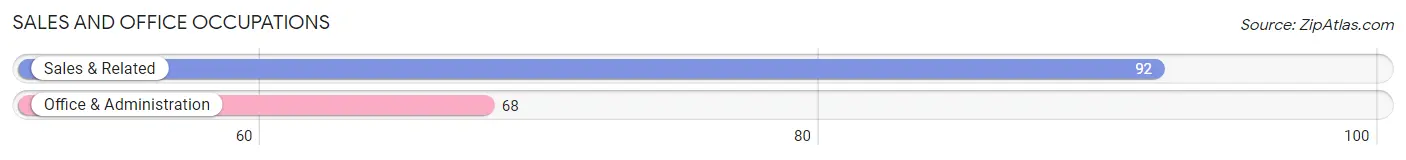
Sales and Office Occupations
The most common Sales and Office occupations in Village of Grosse Pointe Shores are Sales & Related (92 | 8.4%), and Office & Administration (68 | 6.2%).
Sales and Office Occupations by Sex
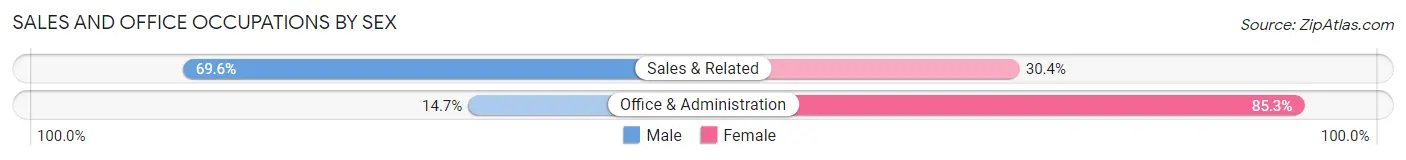
| Occupation | Male | Female |
| Sales & Related | 64 (69.6%) | 28 (30.4%) |
| Office & Administration | 10 (14.7%) | 58 (85.3%) |
| Total (Category) | 74 (46.3%) | 86 (53.7%) |
| Total (Overall) | 705 (64.1%) | 394 (35.8%) |
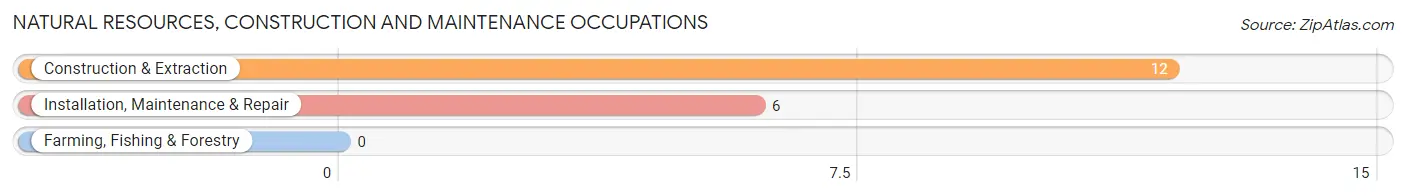
Natural Resources, Construction and Maintenance Occupations
The most common Natural Resources, Construction and Maintenance occupations in Village of Grosse Pointe Shores are Construction & Extraction (12 | 1.1%), and Installation, Maintenance & Repair (6 | 0.5%).
Natural Resources, Construction and Maintenance Occupations by Sex
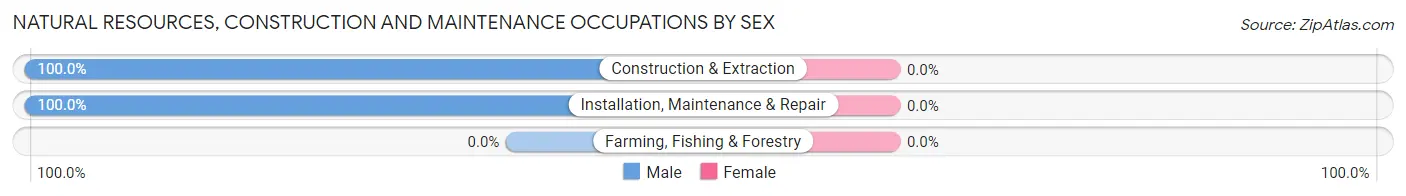
| Occupation | Male | Female |
| Farming, Fishing & Forestry | 0 (0.0%) | 0 (0.0%) |
| Construction & Extraction | 12 (100.0%) | 0 (0.0%) |
| Installation, Maintenance & Repair | 6 (100.0%) | 0 (0.0%) |
| Total (Category) | 18 (100.0%) | 0 (0.0%) |
| Total (Overall) | 705 (64.1%) | 394 (35.8%) |
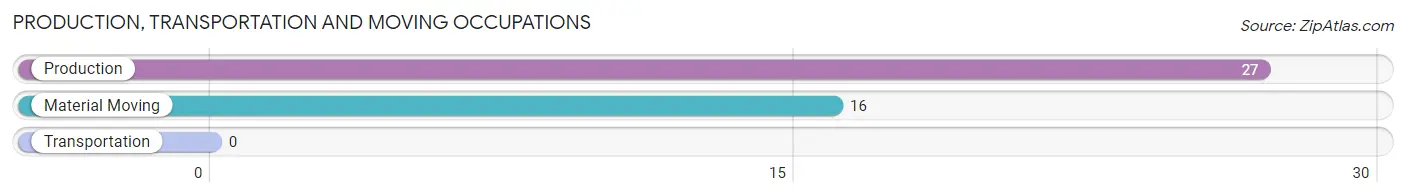
Production, Transportation and Moving Occupations
The most common Production, Transportation and Moving occupations in Village of Grosse Pointe Shores are Production (27 | 2.5%), and Material Moving (16 | 1.5%).
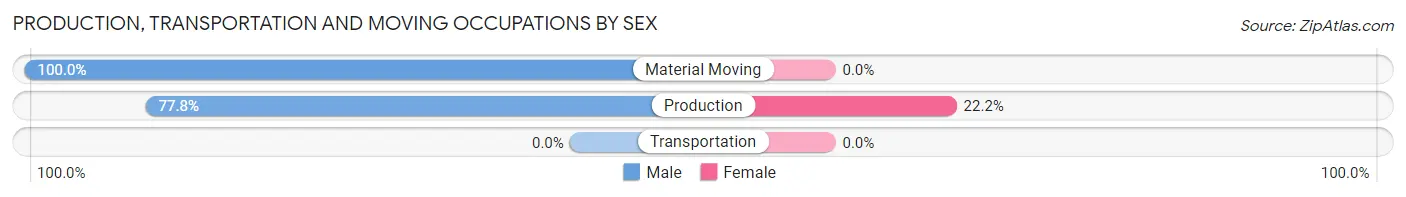
Production, Transportation and Moving Occupations by Sex
| Occupation | Male | Female |
| Production | 21 (77.8%) | 6 (22.2%) |
| Transportation | 0 (0.0%) | 0 (0.0%) |
| Material Moving | 16 (100.0%) | 0 (0.0%) |
| Total (Category) | 37 (86.1%) | 6 (14.0%) |
| Total (Overall) | 705 (64.1%) | 394 (35.8%) |
Employment Industries by Sex in Village of Grosse Pointe Shores
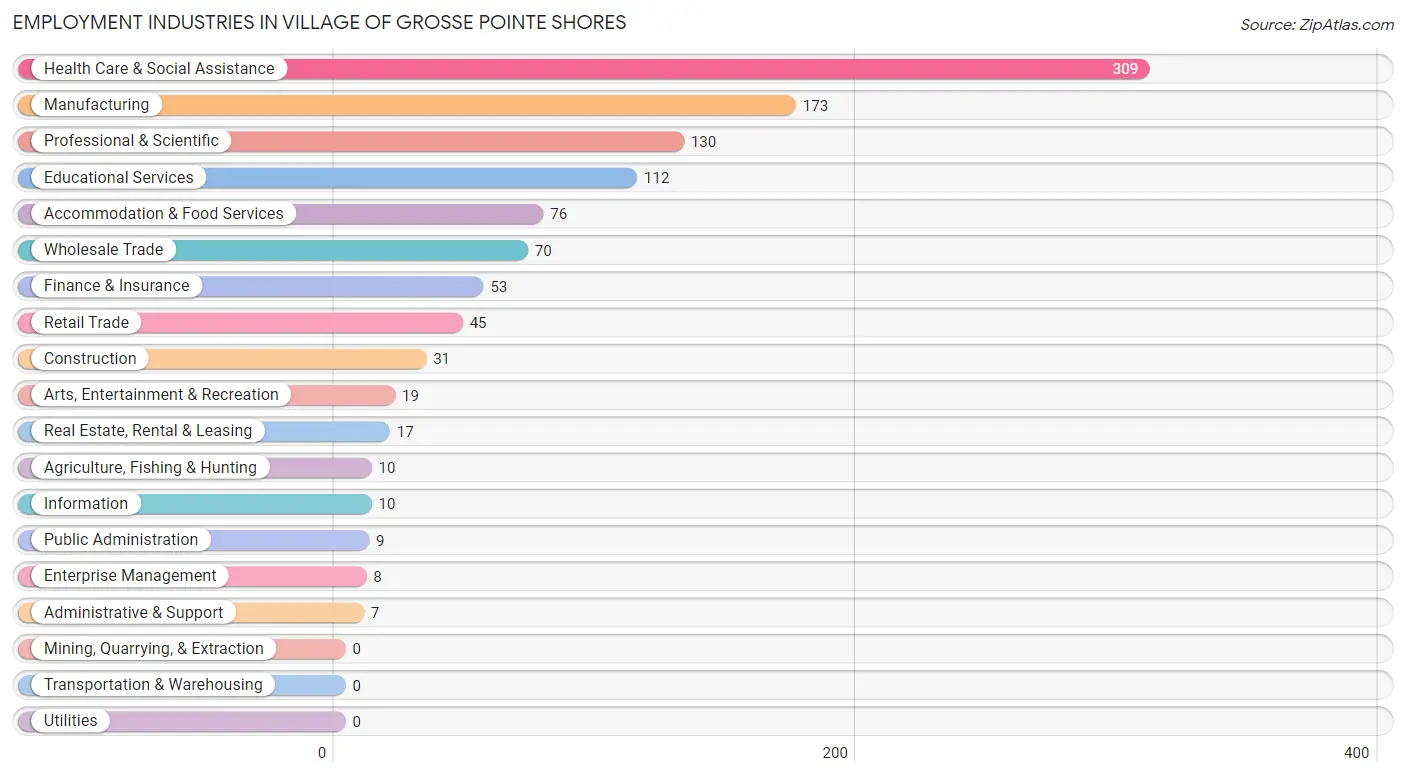
Employment Industries in Village of Grosse Pointe Shores
The major employment industries in Village of Grosse Pointe Shores include Health Care & Social Assistance (309 | 28.1%), Manufacturing (173 | 15.7%), Professional & Scientific (130 | 11.8%), Educational Services (112 | 10.2%), and Accommodation & Food Services (76 | 6.9%).
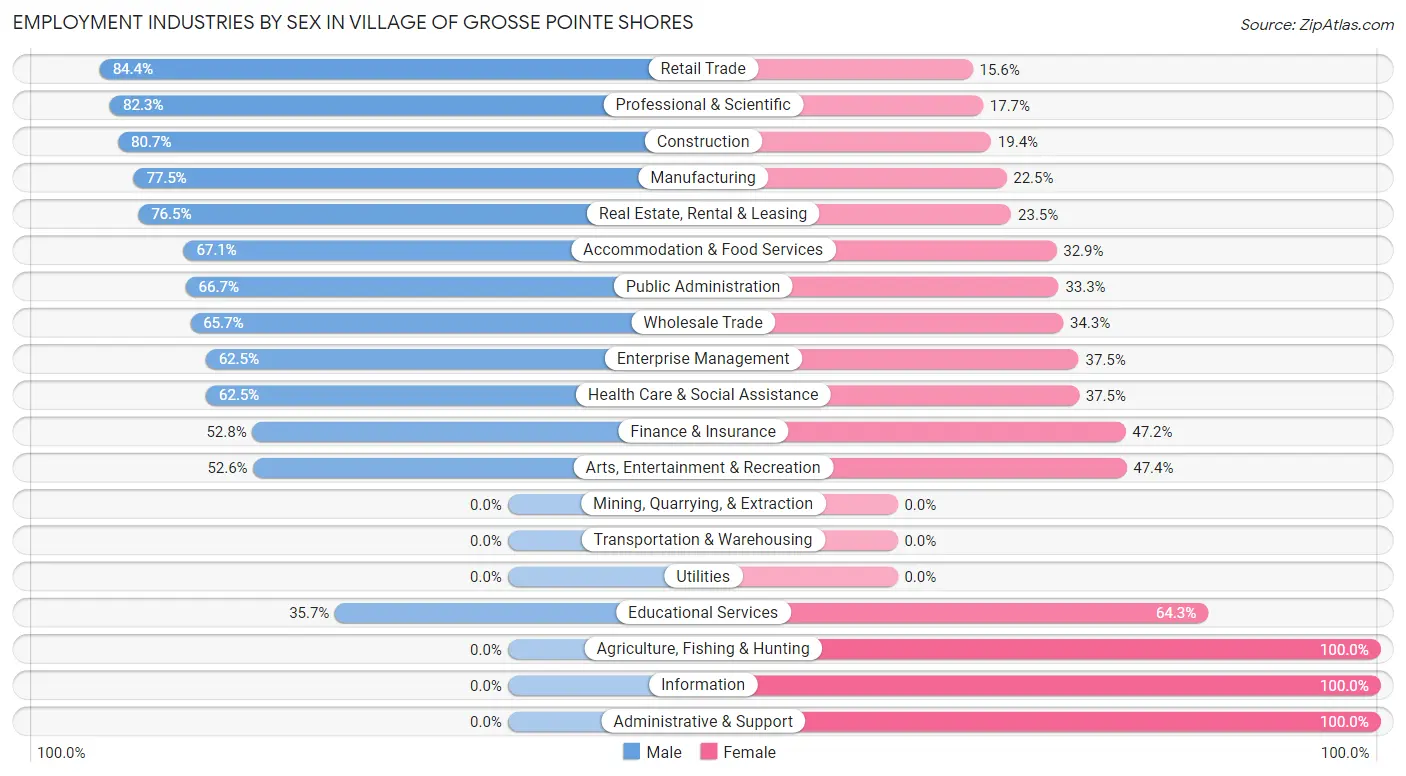
Employment Industries by Sex in Village of Grosse Pointe Shores
The Village of Grosse Pointe Shores industries that see more men than women are Retail Trade (84.4%), Professional & Scientific (82.3%), and Construction (80.6%), whereas the industries that tend to have a higher number of women are Agriculture, Fishing & Hunting (100.0%), Information (100.0%), and Administrative & Support (100.0%).
| Industry | Male | Female |
| Agriculture, Fishing & Hunting | 0 (0.0%) | 10 (100.0%) |
| Mining, Quarrying, & Extraction | 0 (0.0%) | 0 (0.0%) |
| Construction | 25 (80.6%) | 6 (19.4%) |
| Manufacturing | 134 (77.5%) | 39 (22.5%) |
| Wholesale Trade | 46 (65.7%) | 24 (34.3%) |
| Retail Trade | 38 (84.4%) | 7 (15.6%) |
| Transportation & Warehousing | 0 (0.0%) | 0 (0.0%) |
| Utilities | 0 (0.0%) | 0 (0.0%) |
| Information | 0 (0.0%) | 10 (100.0%) |
| Finance & Insurance | 28 (52.8%) | 25 (47.2%) |
| Real Estate, Rental & Leasing | 13 (76.5%) | 4 (23.5%) |
| Professional & Scientific | 107 (82.3%) | 23 (17.7%) |
| Enterprise Management | 5 (62.5%) | 3 (37.5%) |
| Administrative & Support | 0 (0.0%) | 7 (100.0%) |
| Educational Services | 40 (35.7%) | 72 (64.3%) |
| Health Care & Social Assistance | 193 (62.5%) | 116 (37.5%) |
| Arts, Entertainment & Recreation | 10 (52.6%) | 9 (47.4%) |
| Accommodation & Food Services | 51 (67.1%) | 25 (32.9%) |
| Public Administration | 6 (66.7%) | 3 (33.3%) |
| Total | 705 (64.1%) | 394 (35.8%) |
Education in Village of Grosse Pointe Shores
School Enrollment in Village of Grosse Pointe Shores
The most common levels of schooling among the 564 students in Village of Grosse Pointe Shores are elementary school (146 | 25.9%), middle school (123 | 21.8%), and high school (88 | 15.6%).
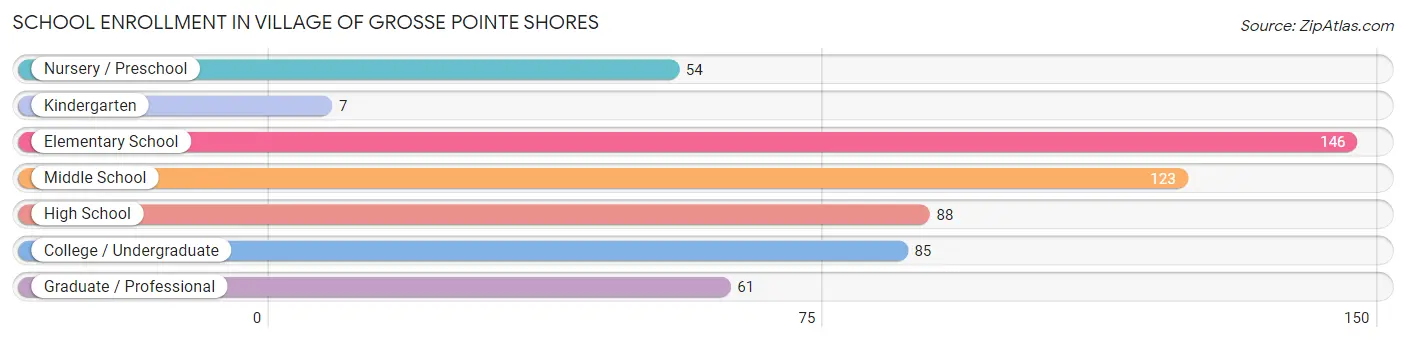
| School Level | # Students | % Students |
| Nursery / Preschool | 54 | 9.6% |
| Kindergarten | 7 | 1.2% |
| Elementary School | 146 | 25.9% |
| Middle School | 123 | 21.8% |
| High School | 88 | 15.6% |
| College / Undergraduate | 85 | 15.1% |
| Graduate / Professional | 61 | 10.8% |
| Total | 564 | 100.0% |
School Enrollment by Age by Funding Source in Village of Grosse Pointe Shores
Out of a total of 564 students who are enrolled in schools in Village of Grosse Pointe Shores, 206 (36.5%) attend a private institution, while the remaining 358 (63.5%) are enrolled in public schools. The age group of 25 to 34 year olds has the highest likelihood of being enrolled in private schools, with 15 (55.6% in the age bracket) enrolled. Conversely, the age group of 18 to 19 year olds has the lowest likelihood of being enrolled in a private school, with 16 (100.0% in the age bracket) attending a public institution.
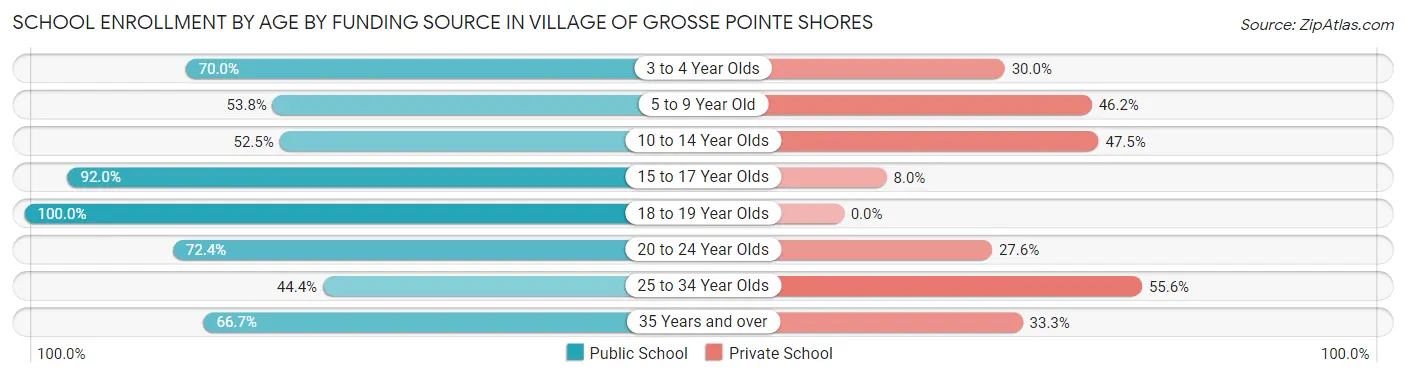
| Age Bracket | Public School | Private School |
| 3 to 4 Year Olds | 21 (70.0%) | 9 (30.0%) |
| 5 to 9 Year Old | 92 (53.8%) | 79 (46.2%) |
| 10 to 14 Year Olds | 73 (52.5%) | 66 (47.5%) |
| 15 to 17 Year Olds | 69 (92.0%) | 6 (8.0%) |
| 18 to 19 Year Olds | 16 (100.0%) | 0 (0.0%) |
| 20 to 24 Year Olds | 55 (72.4%) | 21 (27.6%) |
| 25 to 34 Year Olds | 12 (44.4%) | 15 (55.6%) |
| 35 Years and over | 20 (66.7%) | 10 (33.3%) |
| Total | 358 (63.5%) | 206 (36.5%) |
Educational Attainment by Field of Study in Village of Grosse Pointe Shores
Business (340 | 22.3%), science & technology (189 | 12.4%), engineering (178 | 11.7%), bio, nature & agricultural (163 | 10.7%), and social sciences (134 | 8.8%) are the most common fields of study among 1,522 individuals in Village of Grosse Pointe Shores who have obtained a bachelor's degree or higher.
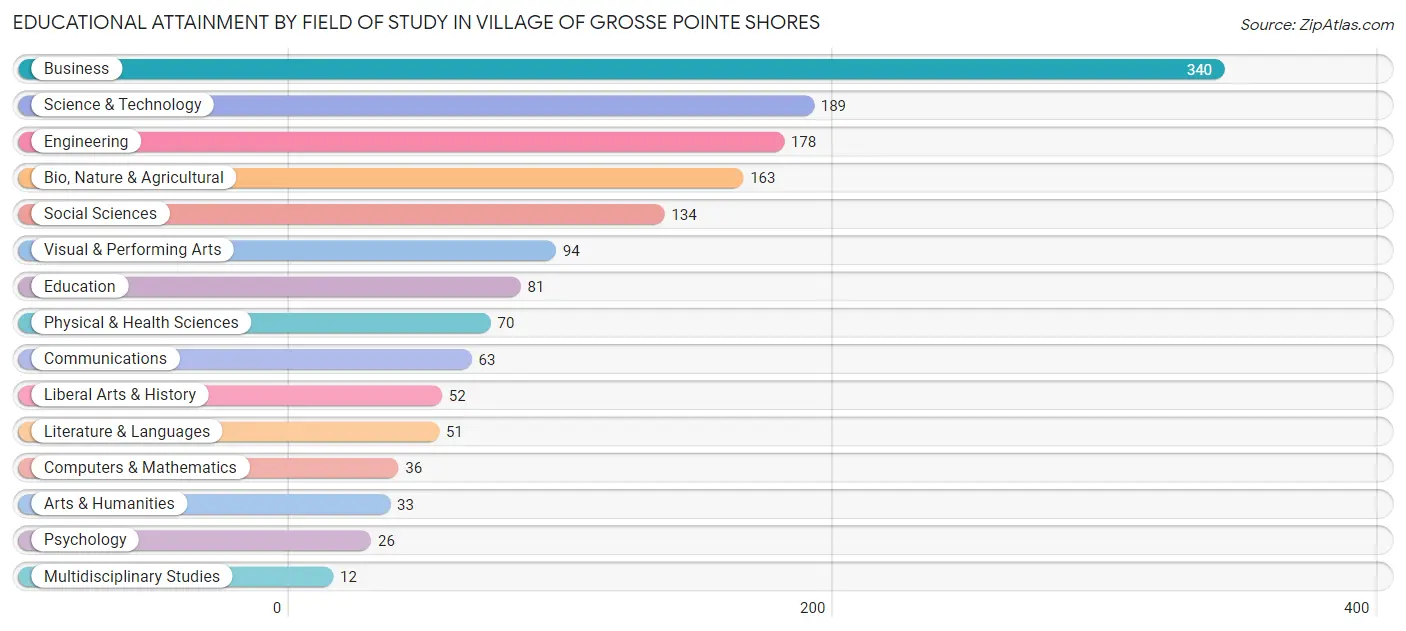
| Field of Study | # Graduates | % Graduates |
| Computers & Mathematics | 36 | 2.4% |
| Bio, Nature & Agricultural | 163 | 10.7% |
| Physical & Health Sciences | 70 | 4.6% |
| Psychology | 26 | 1.7% |
| Social Sciences | 134 | 8.8% |
| Engineering | 178 | 11.7% |
| Multidisciplinary Studies | 12 | 0.8% |
| Science & Technology | 189 | 12.4% |
| Business | 340 | 22.3% |
| Education | 81 | 5.3% |
| Literature & Languages | 51 | 3.4% |
| Liberal Arts & History | 52 | 3.4% |
| Visual & Performing Arts | 94 | 6.2% |
| Communications | 63 | 4.1% |
| Arts & Humanities | 33 | 2.2% |
| Total | 1,522 | 100.0% |
Transportation & Commute in Village of Grosse Pointe Shores
Vehicle Availability by Sex in Village of Grosse Pointe Shores
The most prevalent vehicle ownership categories in Village of Grosse Pointe Shores are males with 2 vehicles (362, accounting for 51.8%) and females with 2 vehicles (189, making up 93.3%).
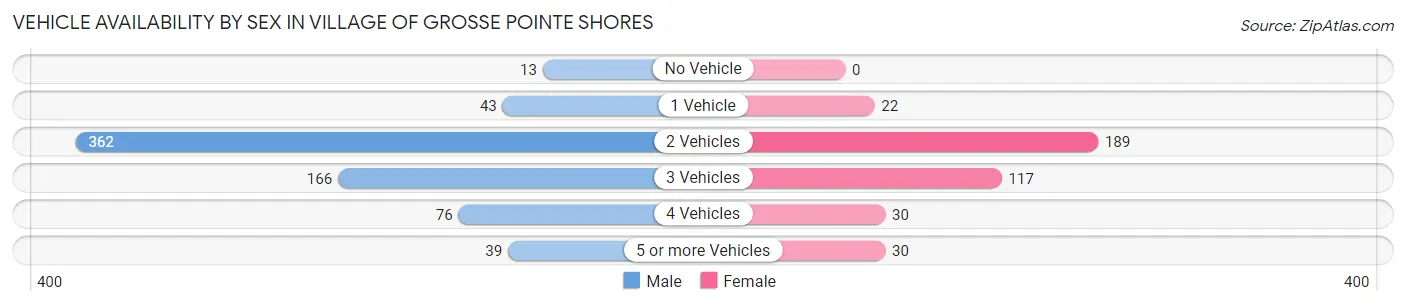
| Vehicles Available | Male | Female |
| No Vehicle | 13 (1.9%) | 0 (0.0%) |
| 1 Vehicle | 43 (6.1%) | 22 (5.7%) |
| 2 Vehicles | 362 (51.8%) | 189 (48.7%) |
| 3 Vehicles | 166 (23.7%) | 117 (30.1%) |
| 4 Vehicles | 76 (10.9%) | 30 (7.7%) |
| 5 or more Vehicles | 39 (5.6%) | 30 (7.7%) |
| Total | 699 (100.0%) | 388 (100.0%) |
Commute Time in Village of Grosse Pointe Shores
The most frequently occuring commute durations in Village of Grosse Pointe Shores are 15 to 19 minutes (208 commuters, 21.2%), 20 to 24 minutes (188 commuters, 19.1%), and 30 to 34 minutes (165 commuters, 16.8%).
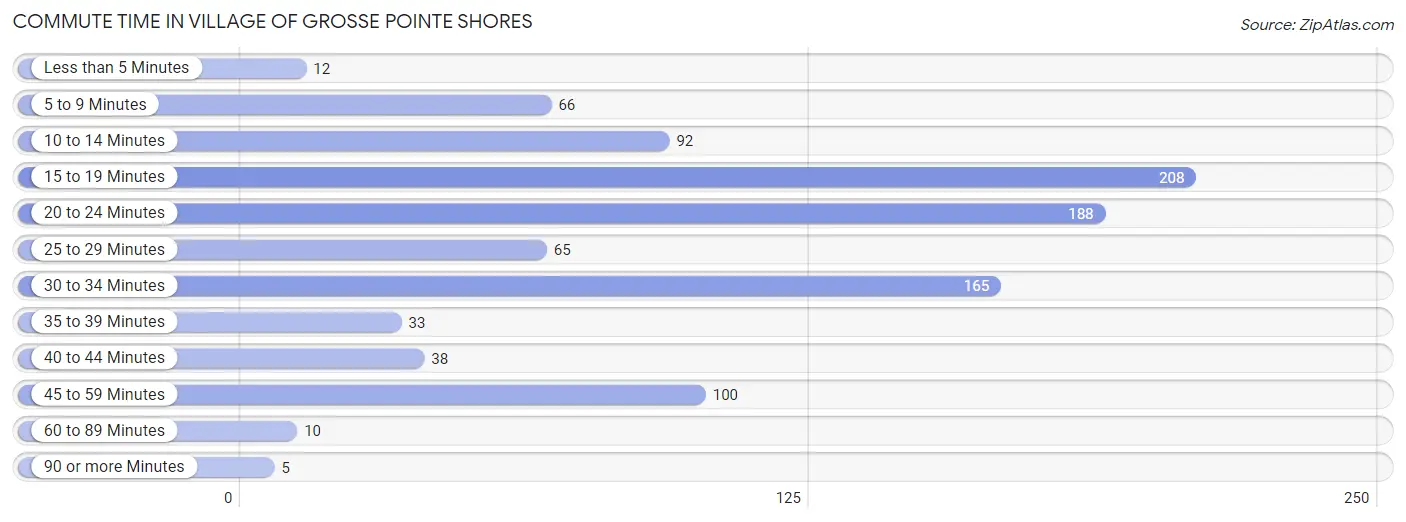
| Commute Time | # Commuters | % Commuters |
| Less than 5 Minutes | 12 | 1.2% |
| 5 to 9 Minutes | 66 | 6.7% |
| 10 to 14 Minutes | 92 | 9.4% |
| 15 to 19 Minutes | 208 | 21.2% |
| 20 to 24 Minutes | 188 | 19.1% |
| 25 to 29 Minutes | 65 | 6.6% |
| 30 to 34 Minutes | 165 | 16.8% |
| 35 to 39 Minutes | 33 | 3.4% |
| 40 to 44 Minutes | 38 | 3.9% |
| 45 to 59 Minutes | 100 | 10.2% |
| 60 to 89 Minutes | 10 | 1.0% |
| 90 or more Minutes | 5 | 0.5% |
Commute Time by Sex in Village of Grosse Pointe Shores
The most common commute times in Village of Grosse Pointe Shores are 20 to 24 minutes (135 commuters, 20.7%) for males and 15 to 19 minutes (74 commuters, 22.4%) for females.
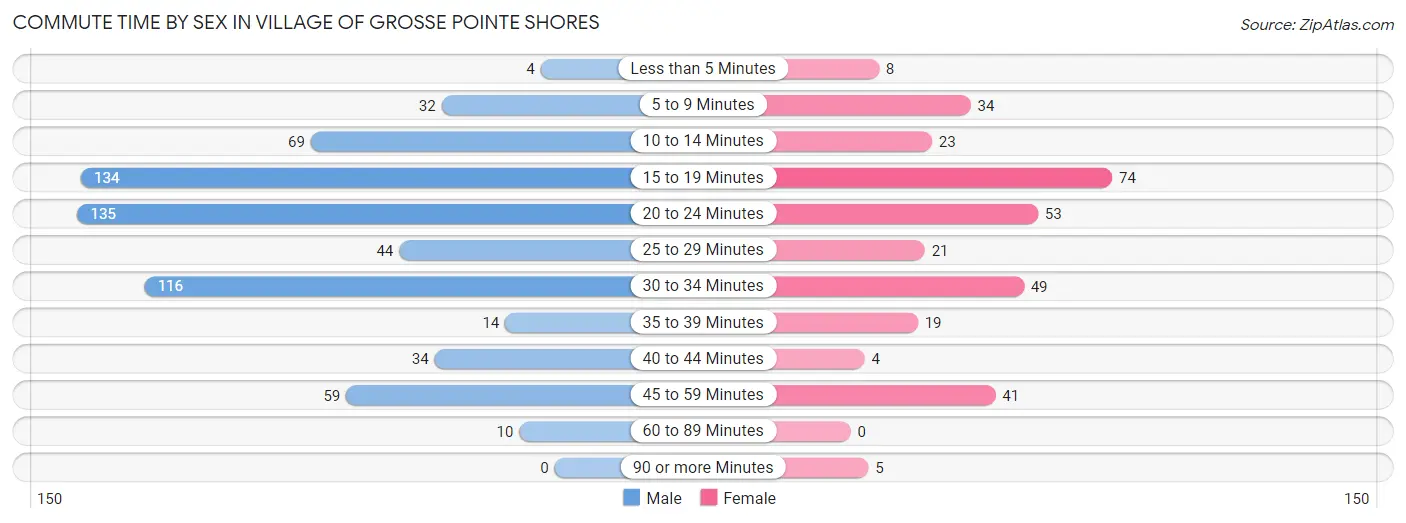
| Commute Time | Male | Female |
| Less than 5 Minutes | 4 (0.6%) | 8 (2.4%) |
| 5 to 9 Minutes | 32 (4.9%) | 34 (10.3%) |
| 10 to 14 Minutes | 69 (10.6%) | 23 (7.0%) |
| 15 to 19 Minutes | 134 (20.6%) | 74 (22.4%) |
| 20 to 24 Minutes | 135 (20.7%) | 53 (16.0%) |
| 25 to 29 Minutes | 44 (6.8%) | 21 (6.3%) |
| 30 to 34 Minutes | 116 (17.8%) | 49 (14.8%) |
| 35 to 39 Minutes | 14 (2.1%) | 19 (5.7%) |
| 40 to 44 Minutes | 34 (5.2%) | 4 (1.2%) |
| 45 to 59 Minutes | 59 (9.1%) | 41 (12.4%) |
| 60 to 89 Minutes | 10 (1.5%) | 0 (0.0%) |
| 90 or more Minutes | 0 (0.0%) | 5 (1.5%) |
Time of Departure to Work by Sex in Village of Grosse Pointe Shores
The most frequent times of departure to work in Village of Grosse Pointe Shores are 7:30 AM to 7:59 AM (162, 24.9%) for males and 7:00 AM to 7:29 AM (58, 17.5%) for females.
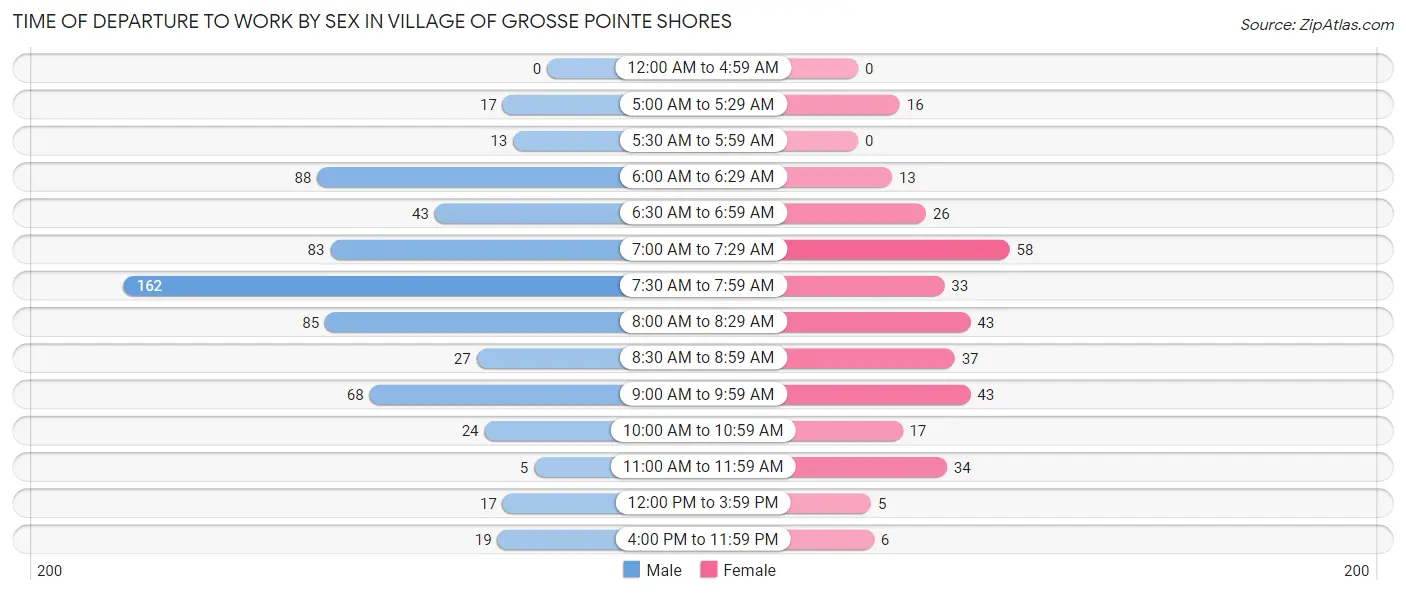
| Time of Departure | Male | Female |
| 12:00 AM to 4:59 AM | 0 (0.0%) | 0 (0.0%) |
| 5:00 AM to 5:29 AM | 17 (2.6%) | 16 (4.8%) |
| 5:30 AM to 5:59 AM | 13 (2.0%) | 0 (0.0%) |
| 6:00 AM to 6:29 AM | 88 (13.5%) | 13 (3.9%) |
| 6:30 AM to 6:59 AM | 43 (6.6%) | 26 (7.9%) |
| 7:00 AM to 7:29 AM | 83 (12.8%) | 58 (17.5%) |
| 7:30 AM to 7:59 AM | 162 (24.9%) | 33 (10.0%) |
| 8:00 AM to 8:29 AM | 85 (13.1%) | 43 (13.0%) |
| 8:30 AM to 8:59 AM | 27 (4.2%) | 37 (11.2%) |
| 9:00 AM to 9:59 AM | 68 (10.4%) | 43 (13.0%) |
| 10:00 AM to 10:59 AM | 24 (3.7%) | 17 (5.1%) |
| 11:00 AM to 11:59 AM | 5 (0.8%) | 34 (10.3%) |
| 12:00 PM to 3:59 PM | 17 (2.6%) | 5 (1.5%) |
| 4:00 PM to 11:59 PM | 19 (2.9%) | 6 (1.8%) |
| Total | 651 (100.0%) | 331 (100.0%) |
Housing Occupancy in Village of Grosse Pointe Shores
Occupancy by Ownership in Village of Grosse Pointe Shores
Of the total 983 dwellings in Village of Grosse Pointe Shores, owner-occupied units account for 951 (96.7%), while renter-occupied units make up 32 (3.3%).
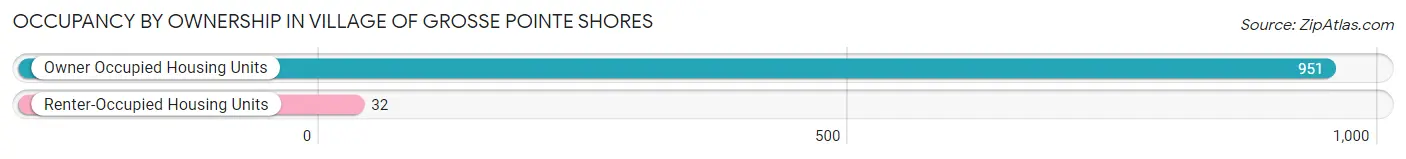
| Occupancy | # Housing Units | % Housing Units |
| Owner Occupied Housing Units | 951 | 96.7% |
| Renter-Occupied Housing Units | 32 | 3.3% |
| Total Occupied Housing Units | 983 | 100.0% |
Occupancy by Household Size in Village of Grosse Pointe Shores
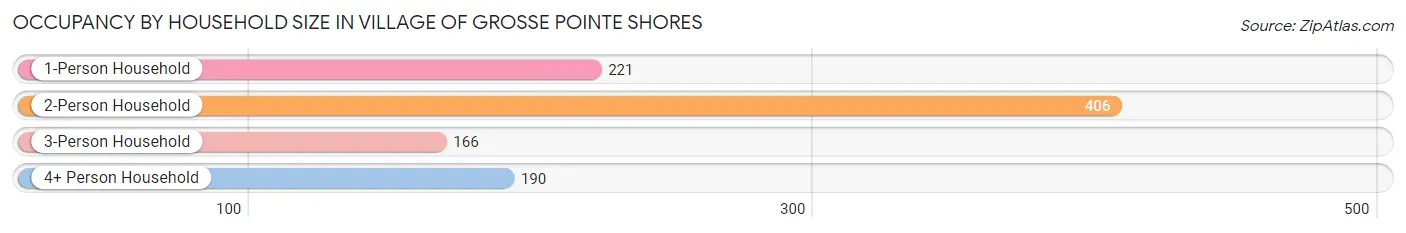
| Household Size | # Housing Units | % Housing Units |
| 1-Person Household | 221 | 22.5% |
| 2-Person Household | 406 | 41.3% |
| 3-Person Household | 166 | 16.9% |
| 4+ Person Household | 190 | 19.3% |
| Total Housing Units | 983 | 100.0% |
Occupancy by Ownership by Household Size in Village of Grosse Pointe Shores
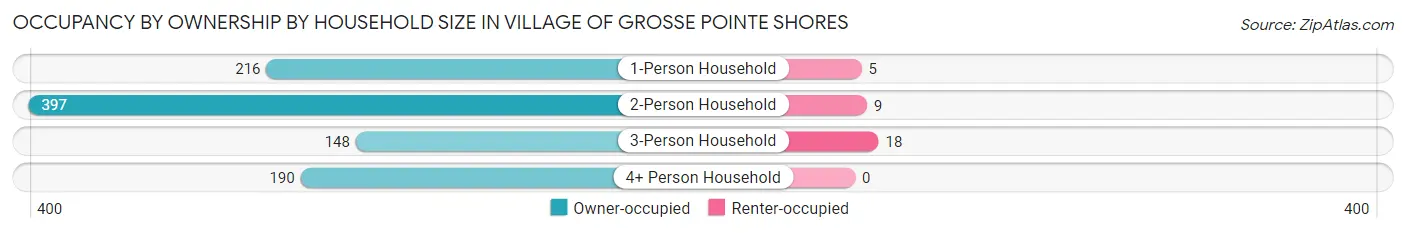
| Household Size | Owner-occupied | Renter-occupied |
| 1-Person Household | 216 (97.7%) | 5 (2.3%) |
| 2-Person Household | 397 (97.8%) | 9 (2.2%) |
| 3-Person Household | 148 (89.2%) | 18 (10.8%) |
| 4+ Person Household | 190 (100.0%) | 0 (0.0%) |
| Total Housing Units | 951 (96.7%) | 32 (3.3%) |
Occupancy by Educational Attainment in Village of Grosse Pointe Shores
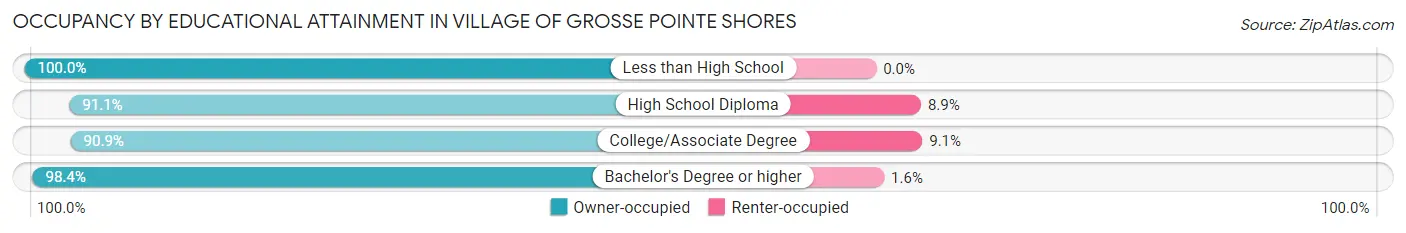
| Household Size | Owner-occupied | Renter-occupied |
| Less than High School | 5 (100.0%) | 0 (0.0%) |
| High School Diploma | 41 (91.1%) | 4 (8.9%) |
| College/Associate Degree | 159 (90.9%) | 16 (9.1%) |
| Bachelor's Degree or higher | 746 (98.4%) | 12 (1.6%) |
Occupancy by Age of Householder in Village of Grosse Pointe Shores
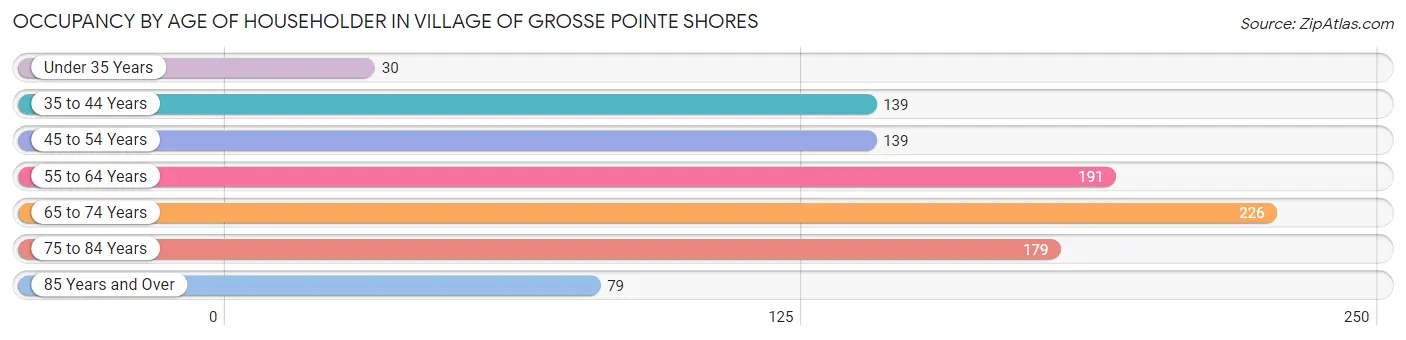
| Age Bracket | # Households | % Households |
| Under 35 Years | 30 | 3.0% |
| 35 to 44 Years | 139 | 14.1% |
| 45 to 54 Years | 139 | 14.1% |
| 55 to 64 Years | 191 | 19.4% |
| 65 to 74 Years | 226 | 23.0% |
| 75 to 84 Years | 179 | 18.2% |
| 85 Years and Over | 79 | 8.0% |
| Total | 983 | 100.0% |
Housing Finances in Village of Grosse Pointe Shores
Median Income by Occupancy in Village of Grosse Pointe Shores
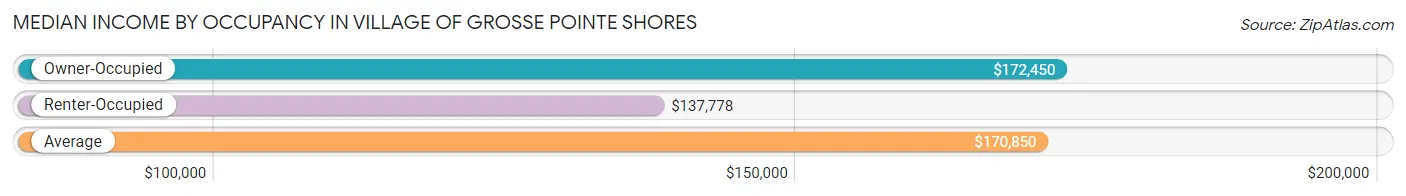
| Occupancy Type | # Households | Median Income |
| Owner-Occupied | 951 (96.7%) | $172,450 |
| Renter-Occupied | 32 (3.3%) | $137,778 |
| Average | 983 (100.0%) | $170,850 |
Occupancy by Householder Income Bracket in Village of Grosse Pointe Shores
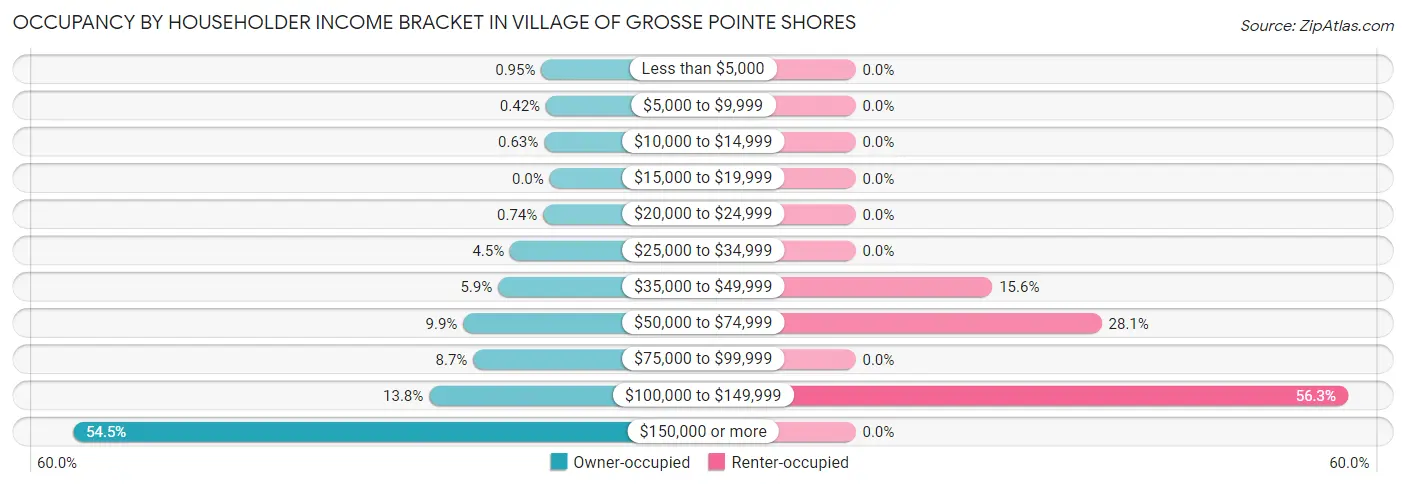
| Income Bracket | Owner-occupied | Renter-occupied |
| Less than $5,000 | 9 (0.9%) | 0 (0.0%) |
| $5,000 to $9,999 | 4 (0.4%) | 0 (0.0%) |
| $10,000 to $14,999 | 6 (0.6%) | 0 (0.0%) |
| $15,000 to $19,999 | 0 (0.0%) | 0 (0.0%) |
| $20,000 to $24,999 | 7 (0.7%) | 0 (0.0%) |
| $25,000 to $34,999 | 43 (4.5%) | 0 (0.0%) |
| $35,000 to $49,999 | 56 (5.9%) | 5 (15.6%) |
| $50,000 to $74,999 | 94 (9.9%) | 9 (28.1%) |
| $75,000 to $99,999 | 83 (8.7%) | 0 (0.0%) |
| $100,000 to $149,999 | 131 (13.8%) | 18 (56.2%) |
| $150,000 or more | 518 (54.5%) | 0 (0.0%) |
| Total | 951 (100.0%) | 32 (100.0%) |
Monthly Housing Cost Tiers in Village of Grosse Pointe Shores
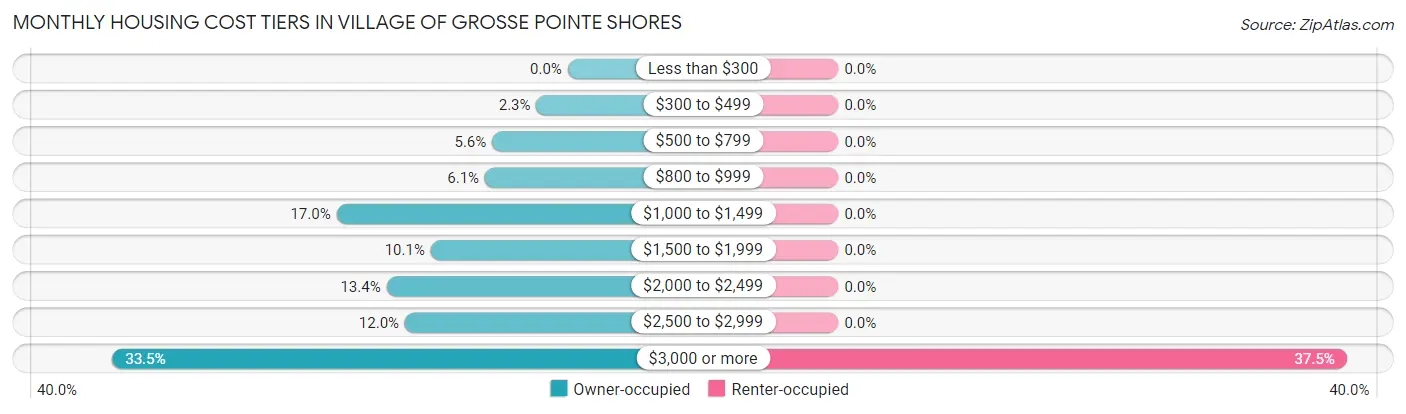
| Monthly Cost | Owner-occupied | Renter-occupied |
| Less than $300 | 0 (0.0%) | 0 (0.0%) |
| $300 to $499 | 22 (2.3%) | 0 (0.0%) |
| $500 to $799 | 53 (5.6%) | 0 (0.0%) |
| $800 to $999 | 58 (6.1%) | 0 (0.0%) |
| $1,000 to $1,499 | 162 (17.0%) | 0 (0.0%) |
| $1,500 to $1,999 | 96 (10.1%) | 0 (0.0%) |
| $2,000 to $2,499 | 127 (13.4%) | 0 (0.0%) |
| $2,500 to $2,999 | 114 (12.0%) | 0 (0.0%) |
| $3,000 or more | 319 (33.5%) | 12 (37.5%) |
| Total | 951 (100.0%) | 32 (100.0%) |
Physical Housing Characteristics in Village of Grosse Pointe Shores
Housing Structures in Village of Grosse Pointe Shores
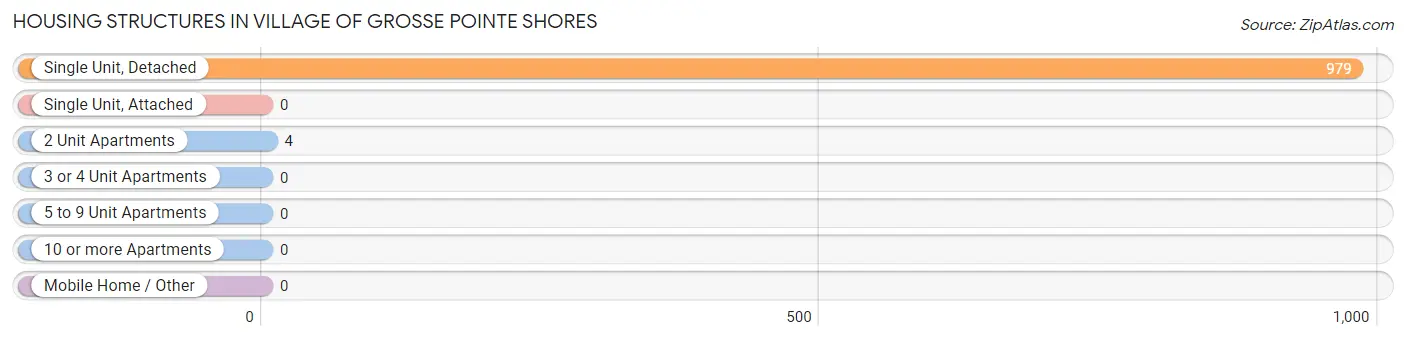
| Structure Type | # Housing Units | % Housing Units |
| Single Unit, Detached | 979 | 99.6% |
| Single Unit, Attached | 0 | 0.0% |
| 2 Unit Apartments | 4 | 0.4% |
| 3 or 4 Unit Apartments | 0 | 0.0% |
| 5 to 9 Unit Apartments | 0 | 0.0% |
| 10 or more Apartments | 0 | 0.0% |
| Mobile Home / Other | 0 | 0.0% |
| Total | 983 | 100.0% |
Housing Structures by Occupancy in Village of Grosse Pointe Shores
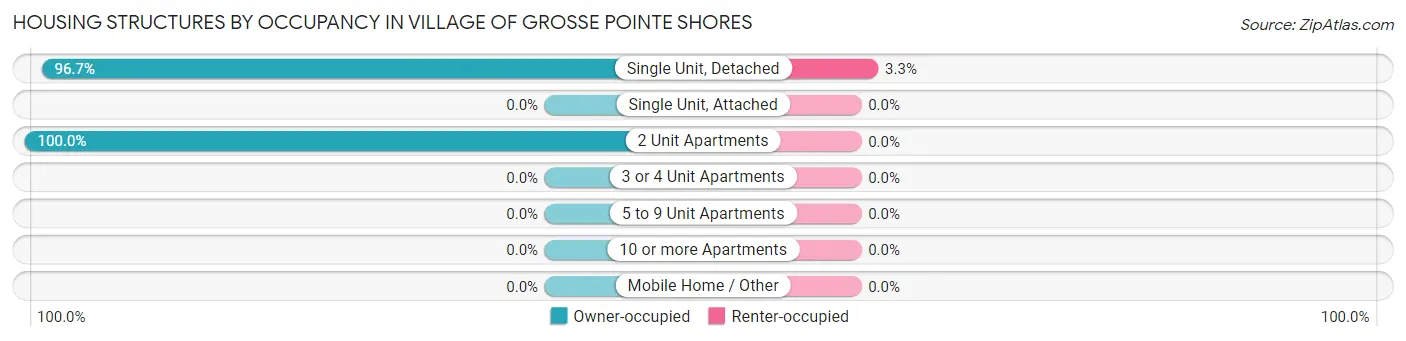
| Structure Type | Owner-occupied | Renter-occupied |
| Single Unit, Detached | 947 (96.7%) | 32 (3.3%) |
| Single Unit, Attached | 0 (0.0%) | 0 (0.0%) |
| 2 Unit Apartments | 4 (100.0%) | 0 (0.0%) |
| 3 or 4 Unit Apartments | 0 (0.0%) | 0 (0.0%) |
| 5 to 9 Unit Apartments | 0 (0.0%) | 0 (0.0%) |
| 10 or more Apartments | 0 (0.0%) | 0 (0.0%) |
| Mobile Home / Other | 0 (0.0%) | 0 (0.0%) |
| Total | 951 (96.7%) | 32 (3.3%) |
Housing Structures by Number of Rooms in Village of Grosse Pointe Shores
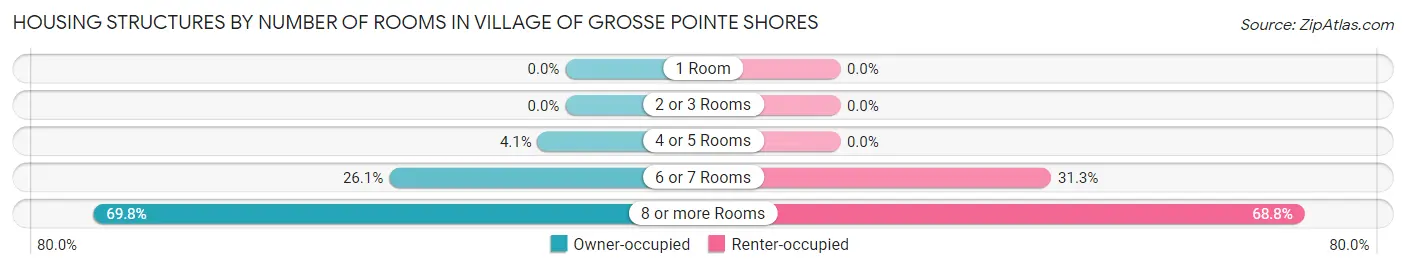
| Number of Rooms | Owner-occupied | Renter-occupied |
| 1 Room | 0 (0.0%) | 0 (0.0%) |
| 2 or 3 Rooms | 0 (0.0%) | 0 (0.0%) |
| 4 or 5 Rooms | 39 (4.1%) | 0 (0.0%) |
| 6 or 7 Rooms | 248 (26.1%) | 10 (31.2%) |
| 8 or more Rooms | 664 (69.8%) | 22 (68.8%) |
| Total | 951 (100.0%) | 32 (100.0%) |
Housing Structure by Heating Type in Village of Grosse Pointe Shores
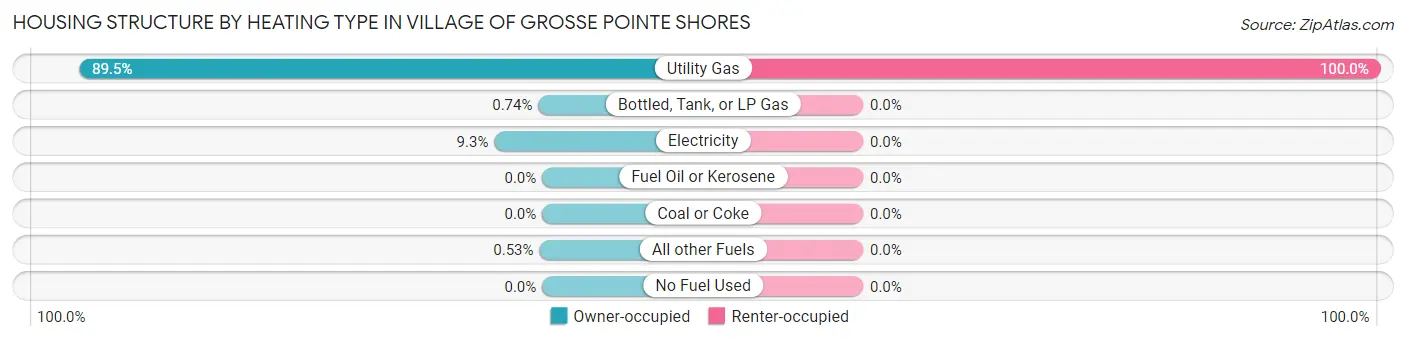
| Heating Type | Owner-occupied | Renter-occupied |
| Utility Gas | 851 (89.5%) | 32 (100.0%) |
| Bottled, Tank, or LP Gas | 7 (0.7%) | 0 (0.0%) |
| Electricity | 88 (9.2%) | 0 (0.0%) |
| Fuel Oil or Kerosene | 0 (0.0%) | 0 (0.0%) |
| Coal or Coke | 0 (0.0%) | 0 (0.0%) |
| All other Fuels | 5 (0.5%) | 0 (0.0%) |
| No Fuel Used | 0 (0.0%) | 0 (0.0%) |
| Total | 951 (100.0%) | 32 (100.0%) |
Household Vehicle Usage in Village of Grosse Pointe Shores
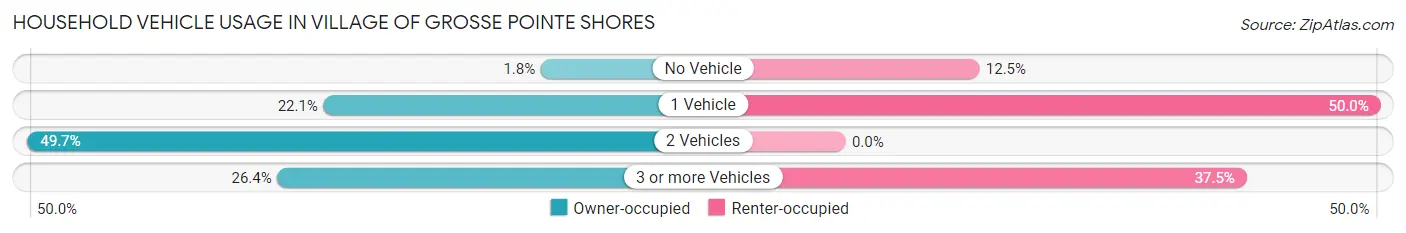
| Vehicles per Household | Owner-occupied | Renter-occupied |
| No Vehicle | 17 (1.8%) | 4 (12.5%) |
| 1 Vehicle | 210 (22.1%) | 16 (50.0%) |
| 2 Vehicles | 473 (49.7%) | 0 (0.0%) |
| 3 or more Vehicles | 251 (26.4%) | 12 (37.5%) |
| Total | 951 (100.0%) | 32 (100.0%) |
Real Estate & Mortgages in Village of Grosse Pointe Shores
Real Estate and Mortgage Overview in Village of Grosse Pointe Shores
| Characteristic | Without Mortgage | With Mortgage |
| Housing Units | 538 | 413 |
| Median Property Value | $610,800 | $680,800 |
| Median Household Income | $124,583 | $287 |
| Monthly Housing Costs | $1,394 | $306 |
| Real Estate Taxes | $10,001 | $5 |
Property Value by Mortgage Status in Village of Grosse Pointe Shores
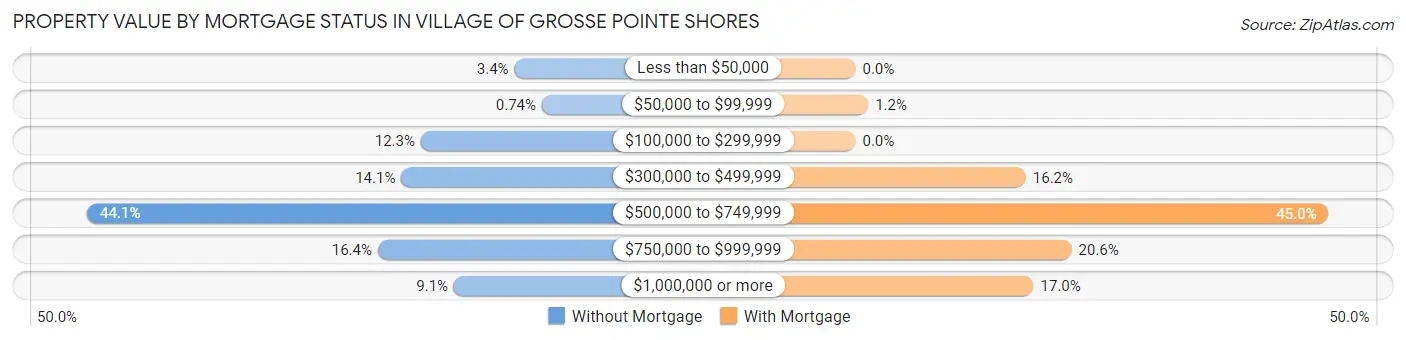
| Property Value | Without Mortgage | With Mortgage |
| Less than $50,000 | 18 (3.4%) | 0 (0.0%) |
| $50,000 to $99,999 | 4 (0.7%) | 5 (1.2%) |
| $100,000 to $299,999 | 66 (12.3%) | 0 (0.0%) |
| $300,000 to $499,999 | 76 (14.1%) | 67 (16.2%) |
| $500,000 to $749,999 | 237 (44.1%) | 186 (45.0%) |
| $750,000 to $999,999 | 88 (16.4%) | 85 (20.6%) |
| $1,000,000 or more | 49 (9.1%) | 70 (17.0%) |
| Total | 538 (100.0%) | 413 (100.0%) |
Household Income by Mortgage Status in Village of Grosse Pointe Shores
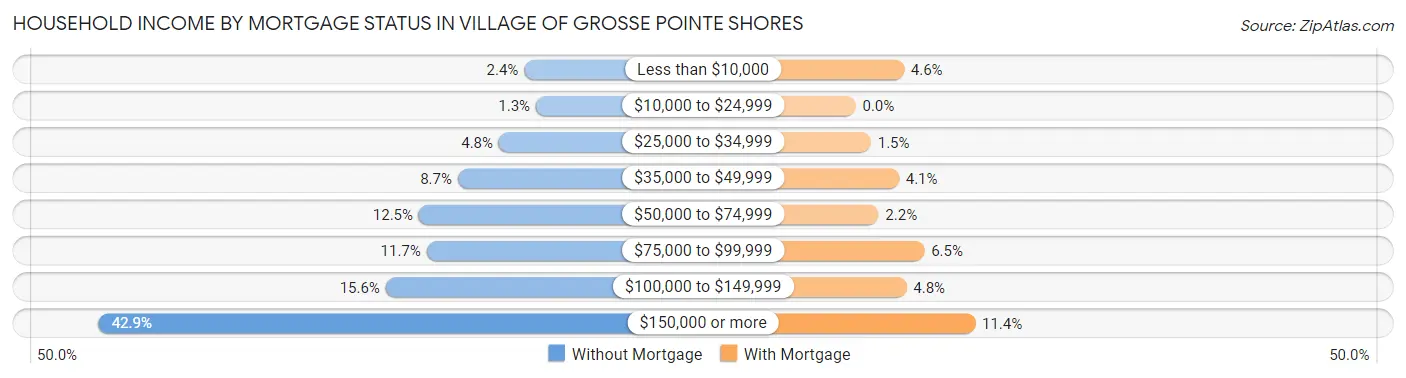
| Household Income | Without Mortgage | With Mortgage |
| Less than $10,000 | 13 (2.4%) | 19 (4.6%) |
| $10,000 to $24,999 | 7 (1.3%) | 0 (0.0%) |
| $25,000 to $34,999 | 26 (4.8%) | 6 (1.5%) |
| $35,000 to $49,999 | 47 (8.7%) | 17 (4.1%) |
| $50,000 to $74,999 | 67 (12.4%) | 9 (2.2%) |
| $75,000 to $99,999 | 63 (11.7%) | 27 (6.5%) |
| $100,000 to $149,999 | 84 (15.6%) | 20 (4.8%) |
| $150,000 or more | 231 (42.9%) | 47 (11.4%) |
| Total | 538 (100.0%) | 413 (100.0%) |
Property Value to Household Income Ratio in Village of Grosse Pointe Shores
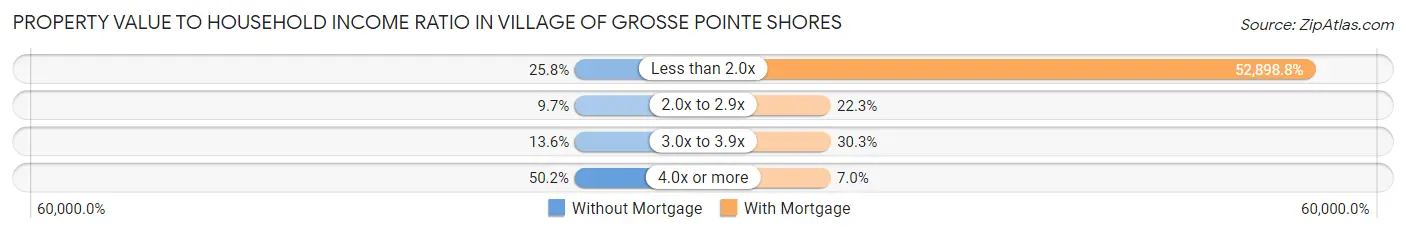
| Value-to-Income Ratio | Without Mortgage | With Mortgage |
| Less than 2.0x | 139 (25.8%) | 218,472 (52,898.8%) |
| 2.0x to 2.9x | 52 (9.7%) | 92 (22.3%) |
| 3.0x to 3.9x | 73 (13.6%) | 125 (30.3%) |
| 4.0x or more | 270 (50.2%) | 29 (7.0%) |
| Total | 538 (100.0%) | 413 (100.0%) |
Real Estate Taxes by Mortgage Status in Village of Grosse Pointe Shores
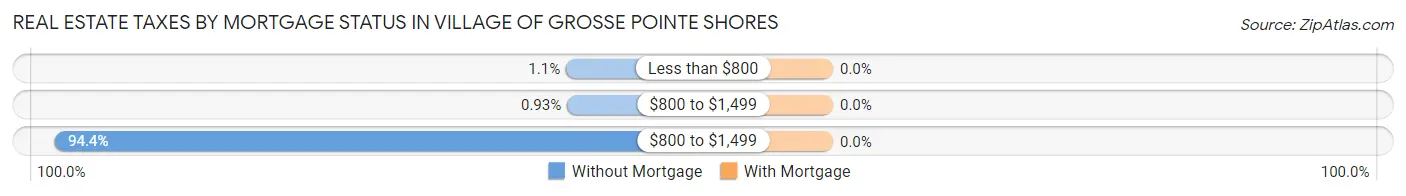
| Property Taxes | Without Mortgage | With Mortgage |
| Less than $800 | 6 (1.1%) | 0 (0.0%) |
| $800 to $1,499 | 5 (0.9%) | 0 (0.0%) |
| $800 to $1,499 | 508 (94.4%) | 0 (0.0%) |
| Total | 538 (100.0%) | 413 (100.0%) |
Health & Disability in Village of Grosse Pointe Shores
Health Insurance Coverage by Age in Village of Grosse Pointe Shores
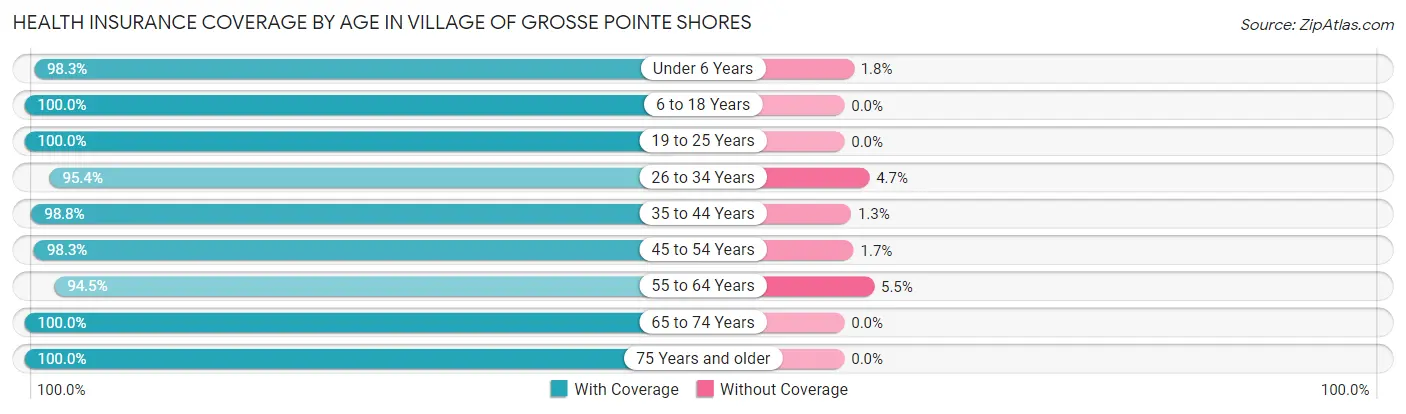
| Age Bracket | With Coverage | Without Coverage |
| Under 6 Years | 225 (98.3%) | 4 (1.8%) |
| 6 to 18 Years | 369 (100.0%) | 0 (0.0%) |
| 19 to 25 Years | 140 (100.0%) | 0 (0.0%) |
| 26 to 34 Years | 82 (95.4%) | 4 (4.6%) |
| 35 to 44 Years | 316 (98.8%) | 4 (1.3%) |
| 45 to 54 Years | 282 (98.3%) | 5 (1.7%) |
| 55 to 64 Years | 392 (94.5%) | 23 (5.5%) |
| 65 to 74 Years | 387 (100.0%) | 0 (0.0%) |
| 75 Years and older | 377 (100.0%) | 0 (0.0%) |
| Total | 2,570 (98.5%) | 40 (1.5%) |
Health Insurance Coverage by Citizenship Status in Village of Grosse Pointe Shores
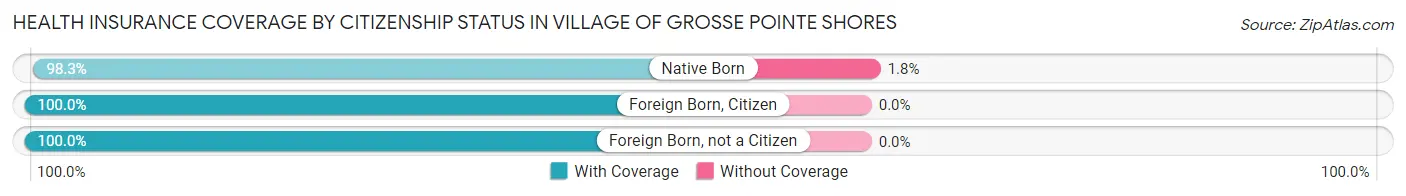
| Citizenship Status | With Coverage | Without Coverage |
| Native Born | 225 (98.3%) | 4 (1.8%) |
| Foreign Born, Citizen | 369 (100.0%) | 0 (0.0%) |
| Foreign Born, not a Citizen | 140 (100.0%) | 0 (0.0%) |
Health Insurance Coverage by Household Income in Village of Grosse Pointe Shores
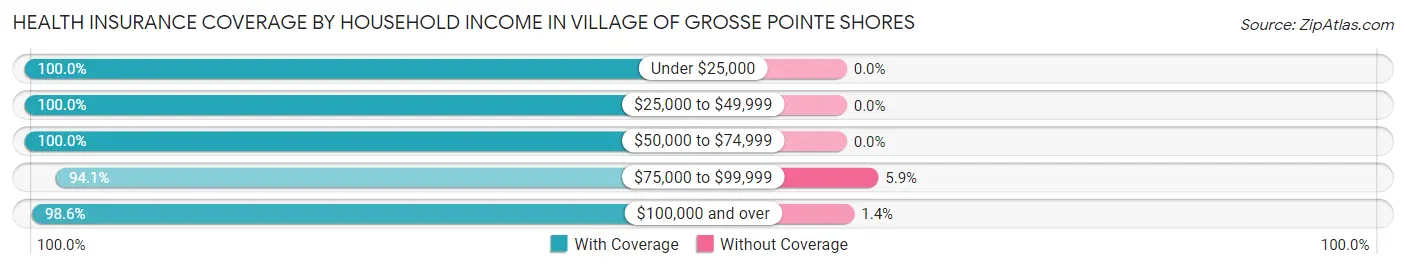
| Household Income | With Coverage | Without Coverage |
| Under $25,000 | 35 (100.0%) | 0 (0.0%) |
| $25,000 to $49,999 | 158 (100.0%) | 0 (0.0%) |
| $50,000 to $74,999 | 231 (100.0%) | 0 (0.0%) |
| $75,000 to $99,999 | 191 (94.1%) | 12 (5.9%) |
| $100,000 and over | 1,950 (98.6%) | 28 (1.4%) |
Public vs Private Health Insurance Coverage by Age in Village of Grosse Pointe Shores
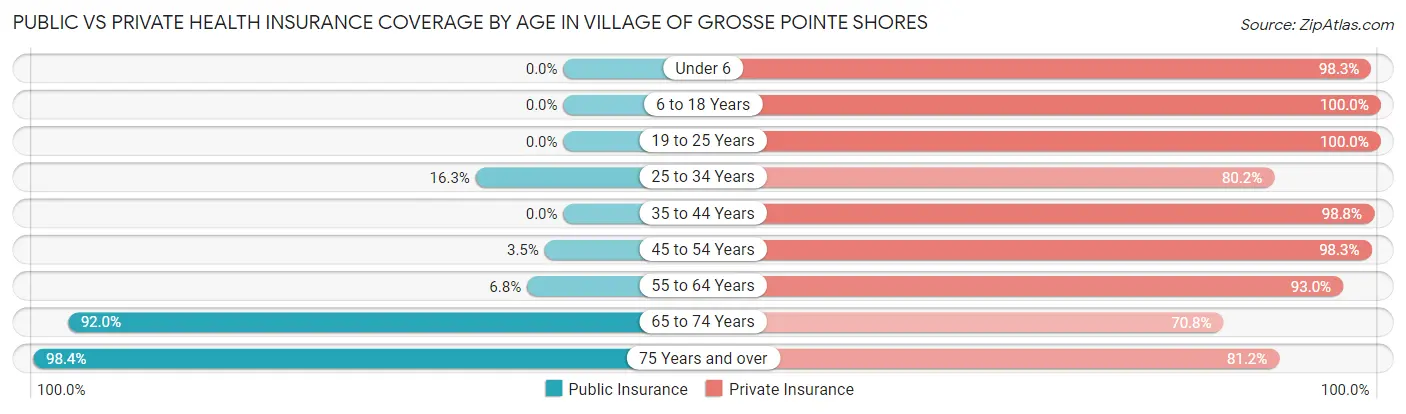
| Age Bracket | Public Insurance | Private Insurance |
| Under 6 | 0 (0.0%) | 225 (98.3%) |
| 6 to 18 Years | 0 (0.0%) | 369 (100.0%) |
| 19 to 25 Years | 0 (0.0%) | 140 (100.0%) |
| 25 to 34 Years | 14 (16.3%) | 69 (80.2%) |
| 35 to 44 Years | 0 (0.0%) | 316 (98.8%) |
| 45 to 54 Years | 10 (3.5%) | 282 (98.3%) |
| 55 to 64 Years | 28 (6.8%) | 386 (93.0%) |
| 65 to 74 Years | 356 (92.0%) | 274 (70.8%) |
| 75 Years and over | 371 (98.4%) | 306 (81.2%) |
| Total | 779 (29.8%) | 2,367 (90.7%) |
Disability Status by Sex by Age in Village of Grosse Pointe Shores
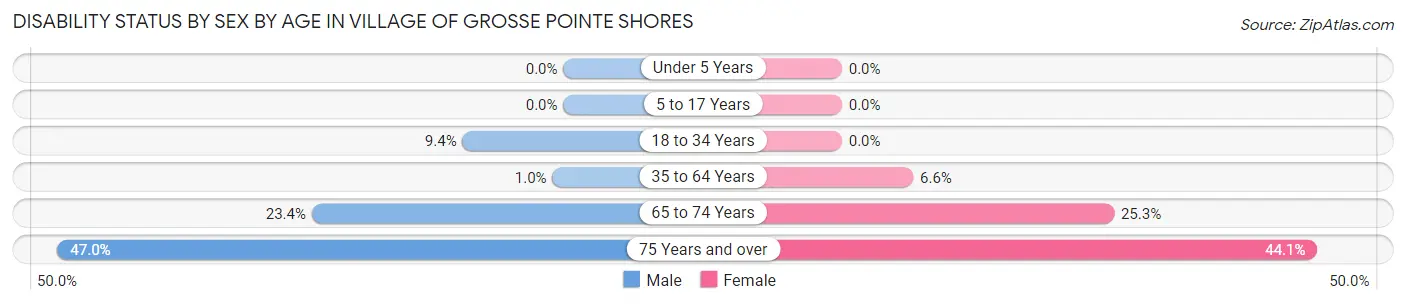
| Age Bracket | Male | Female |
| Under 5 Years | 0 (0.0%) | 0 (0.0%) |
| 5 to 17 Years | 0 (0.0%) | 0 (0.0%) |
| 18 to 34 Years | 16 (9.4%) | 0 (0.0%) |
| 35 to 64 Years | 5 (1.0%) | 35 (6.6%) |
| 65 to 74 Years | 46 (23.4%) | 48 (25.3%) |
| 75 Years and over | 77 (46.9%) | 94 (44.1%) |
Disability Class by Sex by Age in Village of Grosse Pointe Shores
Disability Class: Hearing Difficulty
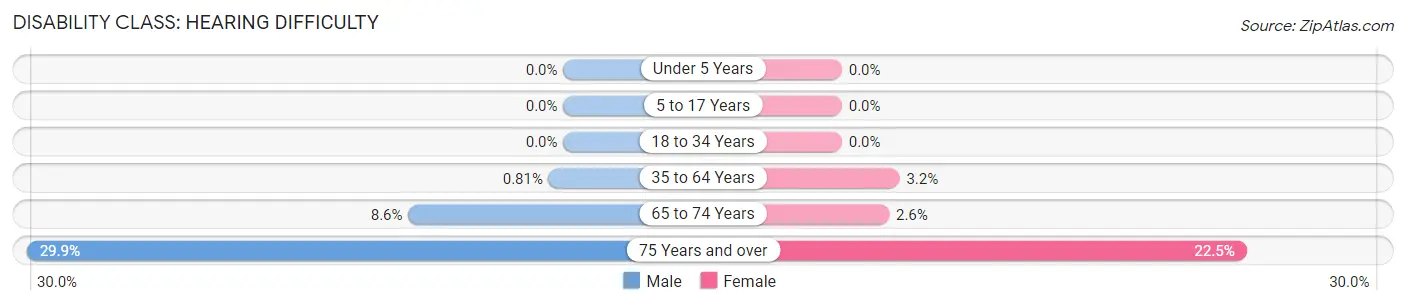
| Age Bracket | Male | Female |
| Under 5 Years | 0 (0.0%) | 0 (0.0%) |
| 5 to 17 Years | 0 (0.0%) | 0 (0.0%) |
| 18 to 34 Years | 0 (0.0%) | 0 (0.0%) |
| 35 to 64 Years | 4 (0.8%) | 17 (3.2%) |
| 65 to 74 Years | 17 (8.6%) | 5 (2.6%) |
| 75 Years and over | 49 (29.9%) | 48 (22.5%) |
Disability Class: Vision Difficulty
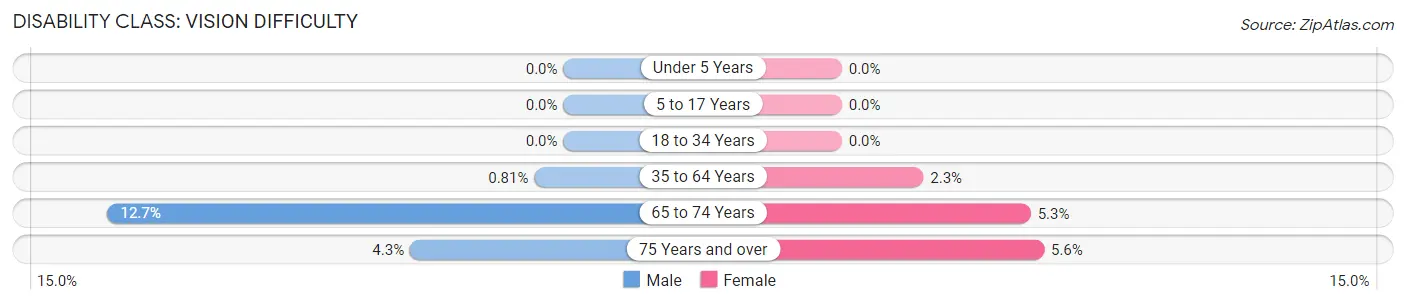
| Age Bracket | Male | Female |
| Under 5 Years | 0 (0.0%) | 0 (0.0%) |
| 5 to 17 Years | 0 (0.0%) | 0 (0.0%) |
| 18 to 34 Years | 0 (0.0%) | 0 (0.0%) |
| 35 to 64 Years | 4 (0.8%) | 12 (2.3%) |
| 65 to 74 Years | 25 (12.7%) | 10 (5.3%) |
| 75 Years and over | 7 (4.3%) | 12 (5.6%) |
Disability Class: Cognitive Difficulty
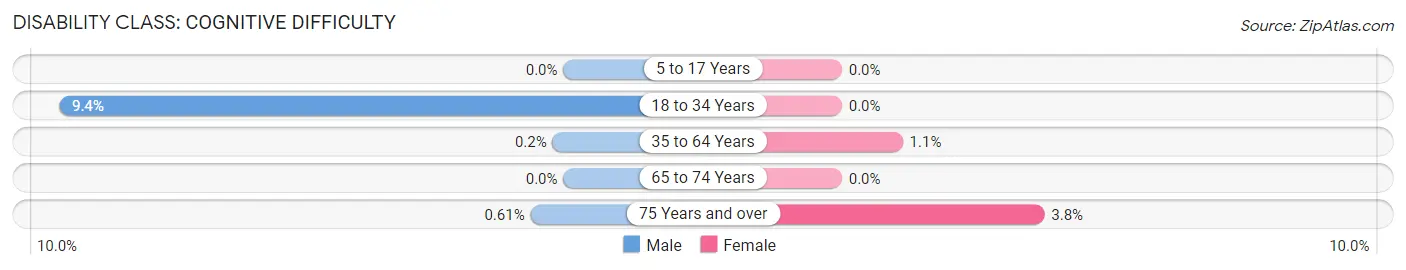
| Age Bracket | Male | Female |
| 5 to 17 Years | 0 (0.0%) | 0 (0.0%) |
| 18 to 34 Years | 16 (9.4%) | 0 (0.0%) |
| 35 to 64 Years | 1 (0.2%) | 6 (1.1%) |
| 65 to 74 Years | 0 (0.0%) | 0 (0.0%) |
| 75 Years and over | 1 (0.6%) | 8 (3.8%) |
Disability Class: Ambulatory Difficulty
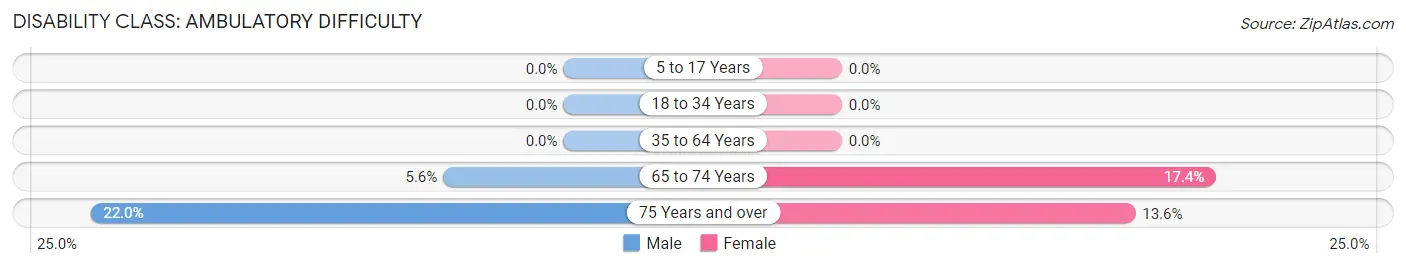
| Age Bracket | Male | Female |
| 5 to 17 Years | 0 (0.0%) | 0 (0.0%) |
| 18 to 34 Years | 0 (0.0%) | 0 (0.0%) |
| 35 to 64 Years | 0 (0.0%) | 0 (0.0%) |
| 65 to 74 Years | 11 (5.6%) | 33 (17.4%) |
| 75 Years and over | 36 (22.0%) | 29 (13.6%) |
Disability Class: Self-Care Difficulty
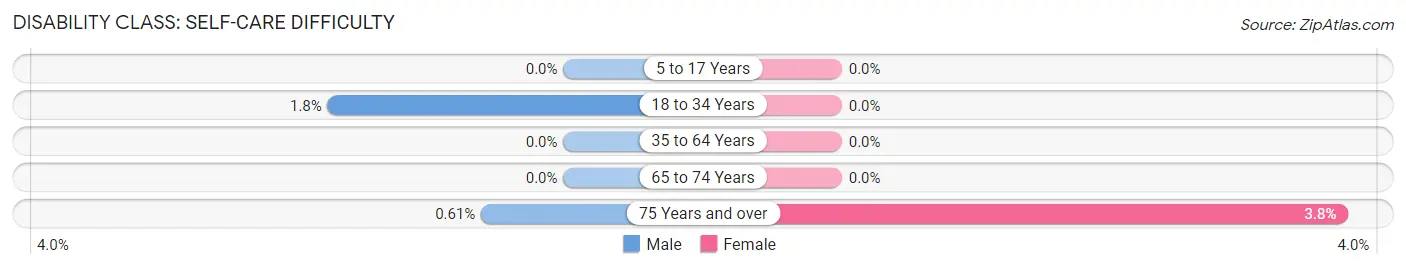
| Age Bracket | Male | Female |
| 5 to 17 Years | 0 (0.0%) | 0 (0.0%) |
| 18 to 34 Years | 3 (1.8%) | 0 (0.0%) |
| 35 to 64 Years | 0 (0.0%) | 0 (0.0%) |
| 65 to 74 Years | 0 (0.0%) | 0 (0.0%) |
| 75 Years and over | 1 (0.6%) | 8 (3.8%) |
Technology Access in Village of Grosse Pointe Shores
Computing Device Access in Village of Grosse Pointe Shores
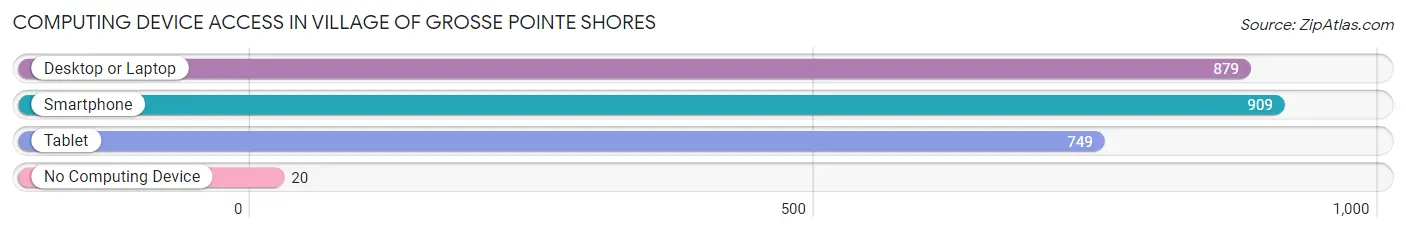
| Device Type | # Households | % Households |
| Desktop or Laptop | 879 | 89.4% |
| Smartphone | 909 | 92.5% |
| Tablet | 749 | 76.2% |
| No Computing Device | 20 | 2.0% |
| Total | 983 | 100.0% |
Internet Access in Village of Grosse Pointe Shores
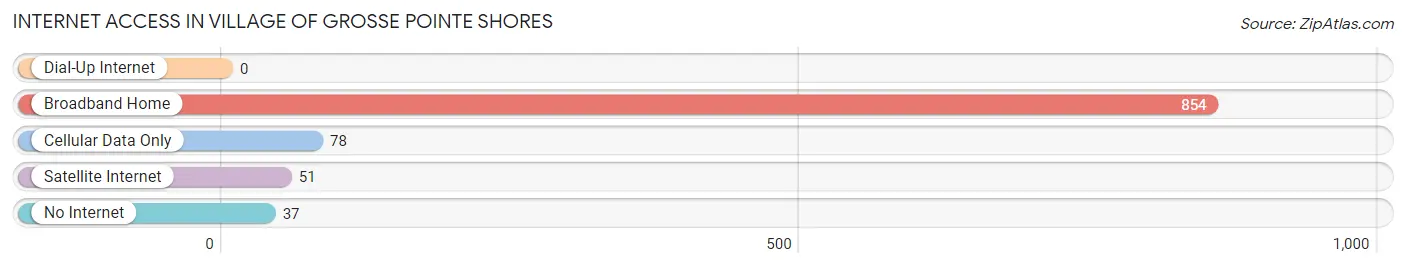
| Internet Type | # Households | % Households |
| Dial-Up Internet | 0 | 0.0% |
| Broadband Home | 854 | 86.9% |
| Cellular Data Only | 78 | 7.9% |
| Satellite Internet | 51 | 5.2% |
| No Internet | 37 | 3.8% |
| Total | 983 | 100.0% |
Village of Grosse Pointe Shores Summary
Village of Grosse Pointe Shores, MI is a small village located in Wayne County, Michigan. It is situated on the shores of Lake St. Clair, just north of Detroit. The village is part of the Grosse Pointe Public School System and is home to approximately 2,000 residents.
History
The area that is now Grosse Pointe Shores was originally inhabited by the Potawatomi Native Americans. The first European settlers arrived in the area in the late 1700s and early 1800s. The area was originally part of the Township of Grosse Pointe, which was established in 1818. In 1879, the Township of Grosse Pointe was divided into five separate villages, including Grosse Pointe Shores.
The village was originally a summer resort community, with many wealthy Detroiters building summer homes along the lakefront. In the early 1900s, the village began to develop into a year-round residential community. In the 1950s, the village was incorporated as a village and the population began to grow.
Geography
Grosse Pointe Shores is located in Wayne County, Michigan. It is situated on the shores of Lake St. Clair, just north of Detroit. The village is bordered by the cities of Grosse Pointe Woods to the north, Grosse Pointe Park to the east, and St. Clair Shores to the south. The village covers an area of approximately 1.2 square miles and has a population of approximately 2,000 people.
The village is located in a temperate climate zone, with hot summers and cold winters. The average temperature in the summer is around 75 degrees Fahrenheit, while the average temperature in the winter is around 25 degrees Fahrenheit. The village receives an average of 36 inches of precipitation per year.
Economy
Grosse Pointe Shores is primarily a residential community, with most of the population employed in the service industry. The village is home to several small businesses, including restaurants, retail stores, and professional services. The village also has a marina, which provides access to Lake St. Clair.
The village is also home to several large employers, including the Grosse Pointe Public School System, the Grosse Pointe Yacht Club, and the Grosse Pointe Country Club. The village is also home to several medical facilities, including the Grosse Pointe Medical Center and the Grosse Pointe Surgery Center.
Demographics
As of the 2010 census, the population of Grosse Pointe Shores was 2,000 people. The racial makeup of the village was 94.2% White, 2.2% African American, 0.7% Asian, 0.3% Native American, and 2.6% from other races. The median household income was $90,000, and the median family income was $100,000.
The village is home to a variety of religious denominations, including Catholic, Protestant, and Jewish. The village is also home to a variety of cultural and recreational activities, including the Grosse Pointe Yacht Club, the Grosse Pointe Country Club, and the Grosse Pointe Public School System.
Conclusion
Grosse Pointe Shores is a small village located in Wayne County, Michigan. It is situated on the shores of Lake St. Clair, just north of Detroit. The village is part of the Grosse Pointe Public School System and is home to approximately 2,000 residents. The village was originally a summer resort community, but has since developed into a year-round residential community. The village is primarily a residential community, with most of the population employed in the service industry. The village is also home to several large employers, including the Grosse Pointe Public School System, the Grosse Pointe Yacht Club, and the Grosse Pointe Country Club. As of the 2010 census, the population of Grosse Pointe Shores was 2,000 people. The racial makeup of the village was 94.2% White, 2.2% African American, 0.7% Asian, 0.3% Native American, and 2.6% from other races. The median household income was $90,000, and the median family income was $100,000. Grosse Pointe Shores is a vibrant community with a variety of cultural and recreational activities.
Common Questions
What is Per Capita Income in Village of Grosse Pointe Shores?
Per Capita income in Village of Grosse Pointe Shores is $101,364.
What is the Median Family Income in Village of Grosse Pointe Shores?
Median Family Income in Village of Grosse Pointe Shores is $208,281.
What is the Median Household income in Village of Grosse Pointe Shores?
Median Household Income in Village of Grosse Pointe Shores is $170,850.
What is Income or Wage Gap in Village of Grosse Pointe Shores?
Income or Wage Gap in Village of Grosse Pointe Shores is 46.9%.
Women in Village of Grosse Pointe Shores earn 53.1 cents for every dollar earned by a man.
What is Inequality or Gini Index in Village of Grosse Pointe Shores?
Inequality or Gini Index in Village of Grosse Pointe Shores is 0.52.
What is the Total Population of Village of Grosse Pointe Shores?
Total Population of Village of Grosse Pointe Shores is 2,610.
What is the Total Male Population of Village of Grosse Pointe Shores?
Total Male Population of Village of Grosse Pointe Shores is 1,301.
What is the Total Female Population of Village of Grosse Pointe Shores?
Total Female Population of Village of Grosse Pointe Shores is 1,309.
What is the Ratio of Males per 100 Females in Village of Grosse Pointe Shores?
There are 99.39 Males per 100 Females in Village of Grosse Pointe Shores.
What is the Ratio of Females per 100 Males in Village of Grosse Pointe Shores?
There are 100.61 Females per 100 Males in Village of Grosse Pointe Shores.
What is the Median Population Age in Village of Grosse Pointe Shores?
Median Population Age in Village of Grosse Pointe Shores is 51.0 Years.
What is the Average Family Size in Village of Grosse Pointe Shores
Average Family Size in Village of Grosse Pointe Shores is 3.1 People.
What is the Average Household Size in Village of Grosse Pointe Shores
Average Household Size in Village of Grosse Pointe Shores is 2.6 People.
How Large is the Labor Force in Village of Grosse Pointe Shores?
There are 1,111 People in the Labor Forcein in Village of Grosse Pointe Shores.
What is the Percentage of People in the Labor Force in Village of Grosse Pointe Shores?
54.2% of People are in the Labor Force in Village of Grosse Pointe Shores.
What is the Unemployment Rate in Village of Grosse Pointe Shores?
Unemployment Rate in Village of Grosse Pointe Shores is 1.1%.