Zip Codes with the Highest Percentage of Population Employed in Architecture & Engineering in Michigan
RELATED REPORTS & OPTIONS
Architecture & Engineering
Michigan
Compare Zip Codes
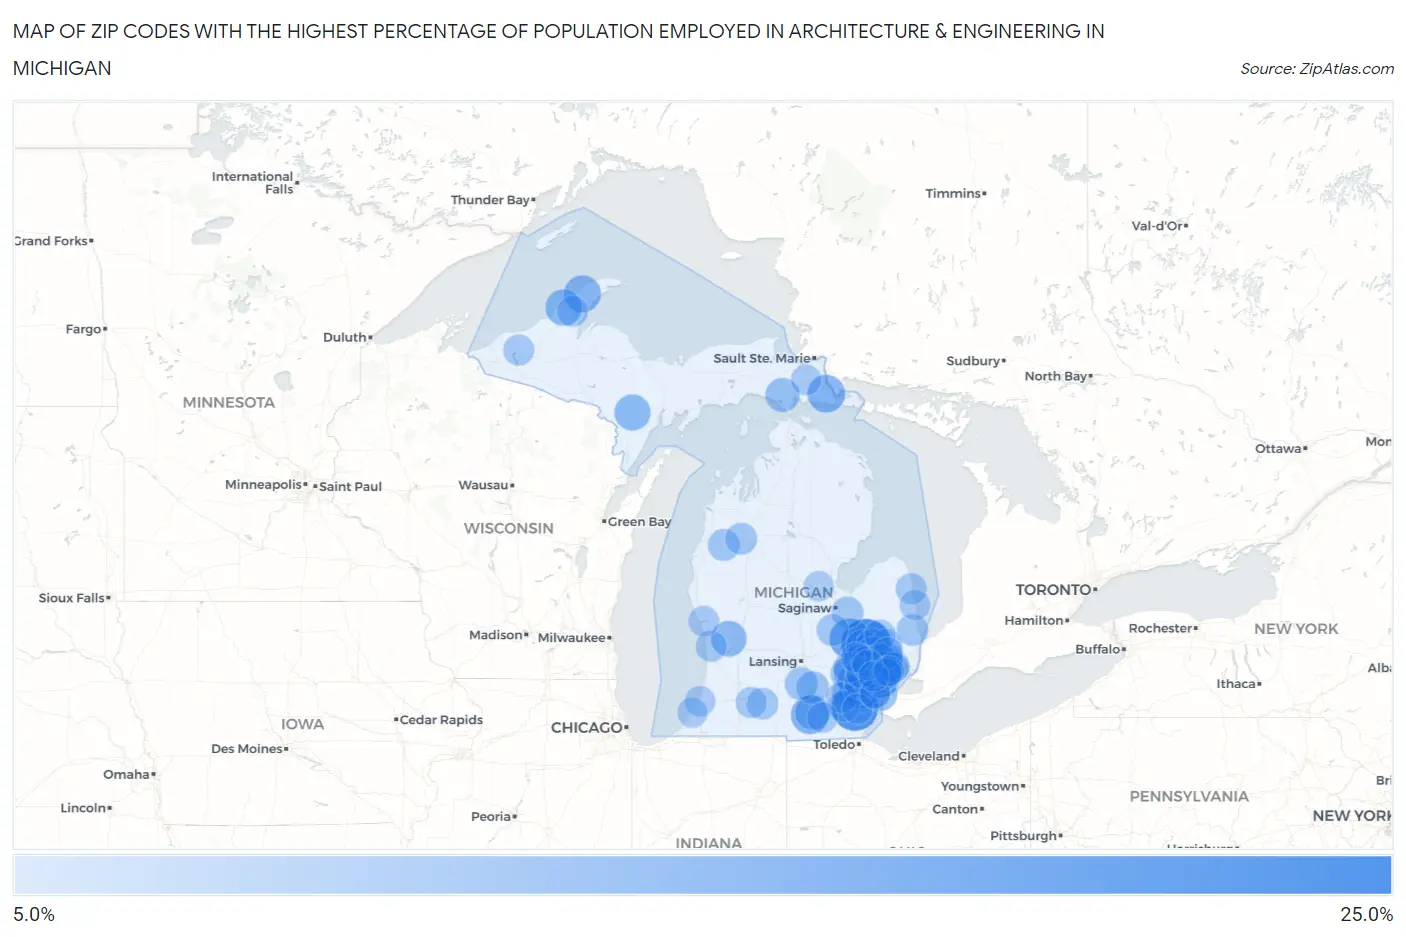
Map of Zip Codes with the Highest Percentage of Population Employed in Architecture & Engineering in Michigan
5.0%
25.0%
Zip Codes with the Highest Percentage of Population Employed in Architecture & Engineering in Michigan
| Zip Code | % Employed | vs State | vs National | |
| 1. | 48440 | 23.2% | 3.4%(+19.8)#1 | 2.1%(+21.0)#77 |
| 2. | 48190 | 20.6% | 3.4%(+17.2)#2 | 2.1%(+18.5)#93 |
| 3. | 48502 | 14.9% | 3.4%(+11.5)#3 | 2.1%(+12.7)#152 |
| 4. | 48326 | 13.2% | 3.4%(+9.83)#4 | 2.1%(+11.0)#191 |
| 5. | 48335 | 13.0% | 3.4%(+9.67)#5 | 2.1%(+10.9)#199 |
| 6. | 49282 | 12.5% | 3.4%(+9.13)#6 | 2.1%(+10.4)#220 |
| 7. | 49736 | 12.2% | 3.4%(+8.85)#7 | 2.1%(+10.1)#230 |
| 8. | 48359 | 12.1% | 3.4%(+8.70)#8 | 2.1%(+9.92)#237 |
| 9. | 48084 | 11.5% | 3.4%(+8.18)#9 | 2.1%(+9.40)#260 |
| 10. | 49901 | 11.5% | 3.4%(+8.11)#10 | 2.1%(+9.33)#265 |
| 11. | 49905 | 11.0% | 3.4%(+7.66)#11 | 2.1%(+8.88)#286 |
| 12. | 48098 | 10.7% | 3.4%(+7.34)#12 | 2.1%(+8.56)#296 |
| 13. | 48067 | 10.7% | 3.4%(+7.30)#13 | 2.1%(+8.52)#298 |
| 14. | 49873 | 10.6% | 3.4%(+7.27)#14 | 2.1%(+8.49)#304 |
| 15. | 49435 | 10.3% | 3.4%(+6.89)#15 | 2.1%(+8.11)#328 |
| 16. | 48307 | 10.0% | 3.4%(+6.66)#16 | 2.1%(+7.88)#338 |
| 17. | 48380 | 9.8% | 3.4%(+6.46)#17 | 2.1%(+7.68)#355 |
| 18. | 48375 | 9.7% | 3.4%(+6.33)#18 | 2.1%(+7.54)#364 |
| 19. | 49233 | 9.6% | 3.4%(+6.22)#19 | 2.1%(+7.43)#371 |
| 20. | 48168 | 9.4% | 3.4%(+6.03)#20 | 2.1%(+7.24)#380 |
| 21. | 48083 | 9.4% | 3.4%(+6.01)#21 | 2.1%(+7.23)#382 |
| 22. | 48085 | 9.3% | 3.4%(+5.97)#22 | 2.1%(+7.19)#383 |
| 23. | 48120 | 9.3% | 3.4%(+5.92)#23 | 2.1%(+7.13)#389 |
| 24. | 48360 | 9.1% | 3.4%(+5.76)#24 | 2.1%(+6.98)#399 |
| 25. | 48188 | 9.1% | 3.4%(+5.70)#25 | 2.1%(+6.92)#411 |
| 26. | 48377 | 9.0% | 3.4%(+5.61)#26 | 2.1%(+6.83)#423 |
| 27. | 49760 | 8.9% | 3.4%(+5.57)#27 | 2.1%(+6.79)#427 |
| 28. | 48304 | 8.6% | 3.4%(+5.21)#28 | 2.1%(+6.43)#478 |
| 29. | 48462 | 8.4% | 3.4%(+5.08)#29 | 2.1%(+6.30)#491 |
| 30. | 48309 | 8.4% | 3.4%(+5.06)#30 | 2.1%(+6.28)#496 |
| 31. | 48331 | 8.4% | 3.4%(+5.04)#31 | 2.1%(+6.26)#499 |
| 32. | 48105 | 8.2% | 3.4%(+4.87)#32 | 2.1%(+6.09)#527 |
| 33. | 48073 | 8.0% | 3.4%(+4.63)#33 | 2.1%(+5.84)#575 |
| 34. | 48165 | 7.9% | 3.4%(+4.56)#34 | 2.1%(+5.78)#585 |
| 35. | 48187 | 7.8% | 3.4%(+4.46)#35 | 2.1%(+5.68)#599 |
| 36. | 48438 | 7.8% | 3.4%(+4.41)#36 | 2.1%(+5.63)#612 |
| 37. | 49264 | 7.8% | 3.4%(+4.39)#37 | 2.1%(+5.61)#615 |
| 38. | 48306 | 7.6% | 3.4%(+4.24)#38 | 2.1%(+5.45)#640 |
| 39. | 49272 | 7.5% | 3.4%(+4.13)#39 | 2.1%(+5.35)#655 |
| 40. | 48370 | 7.4% | 3.4%(+4.08)#40 | 2.1%(+5.30)#661 |
| 41. | 48362 | 7.4% | 3.4%(+4.06)#41 | 2.1%(+5.28)#666 |
| 42. | 48455 | 7.4% | 3.4%(+4.05)#42 | 2.1%(+5.27)#671 |
| 43. | 48317 | 7.2% | 3.4%(+3.85)#43 | 2.1%(+5.07)#704 |
| 44. | 48017 | 7.1% | 3.4%(+3.71)#44 | 2.1%(+4.93)#731 |
| 45. | 49689 | 6.9% | 3.4%(+3.58)#45 | 2.1%(+4.80)#764 |
| 46. | 48042 | 6.9% | 3.4%(+3.53)#46 | 2.1%(+4.74)#777 |
| 47. | 48322 | 6.9% | 3.4%(+3.52)#47 | 2.1%(+4.73)#782 |
| 48. | 48734 | 6.9% | 3.4%(+3.51)#48 | 2.1%(+4.73)#783 |
| 49. | 48460 | 6.8% | 3.4%(+3.46)#49 | 2.1%(+4.68)#792 |
| 50. | 49618 | 6.7% | 3.4%(+3.34)#50 | 2.1%(+4.56)#822 |
| 51. | 48032 | 6.7% | 3.4%(+3.28)#51 | 2.1%(+4.50)#840 |
| 52. | 48003 | 6.6% | 3.4%(+3.28)#52 | 2.1%(+4.50)#842 |
| 53. | 48154 | 6.6% | 3.4%(+3.23)#53 | 2.1%(+4.45)#854 |
| 54. | 49051 | 6.6% | 3.4%(+3.21)#54 | 2.1%(+4.43)#860 |
| 55. | 48371 | 6.6% | 3.4%(+3.19)#55 | 2.1%(+4.41)#865 |
| 56. | 48316 | 6.5% | 3.4%(+3.17)#56 | 2.1%(+4.39)#871 |
| 57. | 48114 | 6.5% | 3.4%(+3.16)#57 | 2.1%(+4.38)#880 |
| 58. | 48374 | 6.5% | 3.4%(+3.11)#58 | 2.1%(+4.32)#898 |
| 59. | 48336 | 6.5% | 3.4%(+3.10)#59 | 2.1%(+4.32)#900 |
| 60. | 48390 | 6.4% | 3.4%(+3.07)#60 | 2.1%(+4.29)#912 |
| 61. | 48315 | 6.4% | 3.4%(+3.06)#61 | 2.1%(+4.28)#917 |
| 62. | 48094 | 6.4% | 3.4%(+3.03)#62 | 2.1%(+4.25)#923 |
| 63. | 48095 | 6.2% | 3.4%(+2.88)#63 | 2.1%(+4.09)#986 |
| 64. | 48034 | 6.2% | 3.4%(+2.83)#64 | 2.1%(+4.05)#1,002 |
| 65. | 48170 | 6.2% | 3.4%(+2.83)#65 | 2.1%(+4.05)#1,004 |
| 66. | 49088 | 6.2% | 3.4%(+2.82)#66 | 2.1%(+4.03)#1,009 |
| 67. | 48128 | 6.2% | 3.4%(+2.81)#67 | 2.1%(+4.03)#1,012 |
| 68. | 49921 | 6.1% | 3.4%(+2.76)#68 | 2.1%(+3.97)#1,030 |
| 69. | 49910 | 6.1% | 3.4%(+2.69)#69 | 2.1%(+3.91)#1,056 |
| 70. | 48434 | 6.1% | 3.4%(+2.69)#70 | 2.1%(+3.91)#1,058 |
| 71. | 48176 | 6.0% | 3.4%(+2.66)#71 | 2.1%(+3.88)#1,069 |
| 72. | 48412 | 6.0% | 3.4%(+2.63)#72 | 2.1%(+3.84)#1,081 |
| 73. | 49460 | 6.0% | 3.4%(+2.62)#73 | 2.1%(+3.83)#1,087 |
| 74. | 48220 | 5.9% | 3.4%(+2.57)#74 | 2.1%(+3.79)#1,109 |
| 75. | 48350 | 5.9% | 3.4%(+2.54)#75 | 2.1%(+3.76)#1,127 |
| 76. | 48103 | 5.9% | 3.4%(+2.52)#76 | 2.1%(+3.74)#1,135 |
| 77. | 48072 | 5.9% | 3.4%(+2.51)#77 | 2.1%(+3.73)#1,145 |
| 78. | 48167 | 5.9% | 3.4%(+2.48)#78 | 2.1%(+3.70)#1,159 |
| 79. | 48302 | 5.8% | 3.4%(+2.47)#79 | 2.1%(+3.69)#1,163 |
| 80. | 48353 | 5.8% | 3.4%(+2.44)#80 | 2.1%(+3.66)#1,172 |
| 81. | 48382 | 5.8% | 3.4%(+2.44)#81 | 2.1%(+3.66)#1,173 |
| 82. | 48346 | 5.8% | 3.4%(+2.42)#82 | 2.1%(+3.64)#1,179 |
| 83. | 49440 | 5.8% | 3.4%(+2.42)#83 | 2.1%(+3.64)#1,180 |
| 84. | 49038 | 5.7% | 3.4%(+2.36)#84 | 2.1%(+3.58)#1,210 |
| 85. | 49265 | 5.7% | 3.4%(+2.35)#85 | 2.1%(+3.56)#1,218 |
| 86. | 48469 | 5.7% | 3.4%(+2.31)#86 | 2.1%(+3.53)#1,231 |
| 87. | 48314 | 5.7% | 3.4%(+2.30)#87 | 2.1%(+3.51)#1,237 |
| 88. | 48363 | 5.6% | 3.4%(+2.27)#88 | 2.1%(+3.48)#1,258 |
| 89. | 48191 | 5.6% | 3.4%(+2.25)#89 | 2.1%(+3.47)#1,272 |
| 90. | 49788 | 5.6% | 3.4%(+2.24)#90 | 2.1%(+3.46)#1,278 |
| 91. | 48442 | 5.6% | 3.4%(+2.23)#91 | 2.1%(+3.45)#1,282 |
| 92. | 48065 | 5.6% | 3.4%(+2.22)#92 | 2.1%(+3.44)#1,287 |
| 93. | 48124 | 5.6% | 3.4%(+2.22)#93 | 2.1%(+3.44)#1,289 |
| 94. | 48642 | 5.6% | 3.4%(+2.20)#94 | 2.1%(+3.42)#1,297 |
| 95. | 48044 | 5.6% | 3.4%(+2.19)#95 | 2.1%(+3.41)#1,299 |
| 96. | 48310 | 5.5% | 3.4%(+2.16)#96 | 2.1%(+3.38)#1,314 |
| 97. | 48329 | 5.5% | 3.4%(+2.11)#97 | 2.1%(+3.33)#1,337 |
| 98. | 48301 | 5.5% | 3.4%(+2.11)#98 | 2.1%(+3.33)#1,339 |
| 99. | 48313 | 5.4% | 3.4%(+2.05)#99 | 2.1%(+3.26)#1,380 |
| 100. | 49085 | 5.4% | 3.4%(+2.03)#100 | 2.1%(+3.25)#1,388 |
Common Questions
What are the Top 10 Zip Codes with the Highest Percentage of Population Employed in Architecture & Engineering in Michigan?
Top 10 Zip Codes with the Highest Percentage of Population Employed in Architecture & Engineering in Michigan are:
What zip code has the Highest Percentage of Population Employed in Architecture & Engineering in Michigan?
48440 has the Highest Percentage of Population Employed in Architecture & Engineering in Michigan with 23.2%.
What is the Percentage of Population Employed in Architecture & Engineering in the State of Michigan?
Percentage of Population Employed in Architecture & Engineering in Michigan is 3.4%.
What is the Percentage of Population Employed in Architecture & Engineering in the United States?
Percentage of Population Employed in Architecture & Engineering in the United States is 2.1%.