Cities with the Highest Percentage of Population with a Degree in Multidisciplinary Studies in Michigan
RELATED REPORTS & OPTIONS
Multidisciplinary Studies
Michigan
Compare Cities
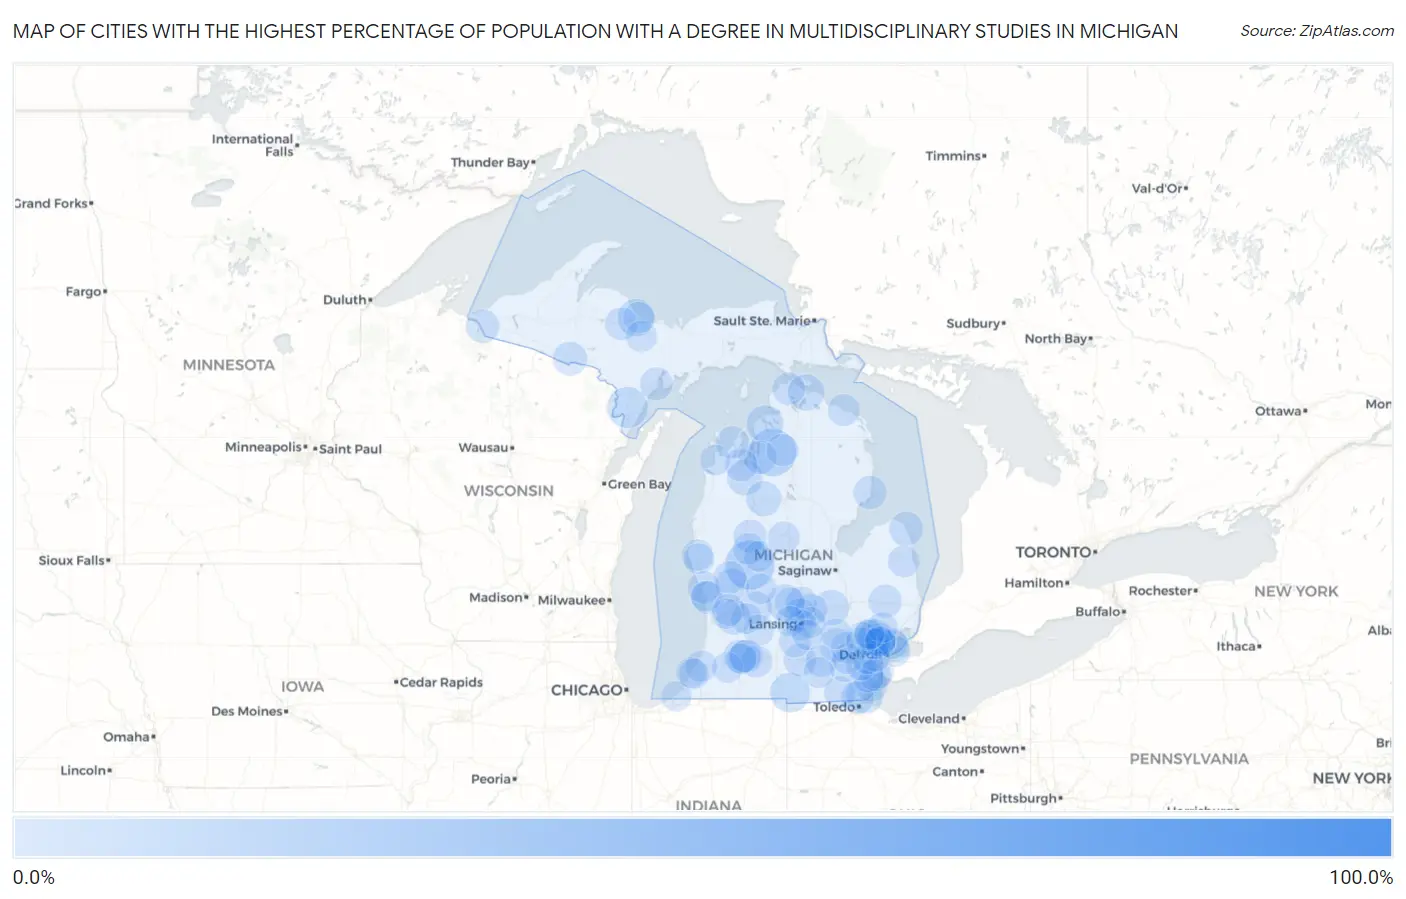
Map of Cities with the Highest Percentage of Population with a Degree in Multidisciplinary Studies in Michigan
0.0%
100.0%
Cities with the Highest Percentage of Population with a Degree in Multidisciplinary Studies in Michigan
| City | % Graduates | vs State | vs National | |
| 1. | Elm Hall | 100.0% | 0.72%(+99.3)#1 | 0.88%(+99.1)#4 |
| 2. | Morley | 14.0% | 0.72%(+13.2)#2 | 0.88%(+13.1)#210 |
| 3. | Mancelona | 12.8% | 0.72%(+12.1)#3 | 0.88%(+11.9)#241 |
| 4. | Daggett | 8.3% | 0.72%(+7.61)#4 | 0.88%(+7.45)#448 |
| 5. | Reading | 7.5% | 0.72%(+6.81)#5 | 0.88%(+6.65)#506 |
| 6. | Trowbridge Park | 5.7% | 0.72%(+4.95)#6 | 0.88%(+4.79)#746 |
| 7. | Ironton | 5.6% | 0.72%(+4.83)#7 | 0.88%(+4.68)#780 |
| 8. | Luna Pier | 5.5% | 0.72%(+4.74)#8 | 0.88%(+4.59)#797 |
| 9. | Pewamo | 5.2% | 0.72%(+4.45)#9 | 0.88%(+4.29)#853 |
| 10. | Cheboygan | 5.1% | 0.72%(+4.35)#10 | 0.88%(+4.19)#885 |
| 11. | Kingsley | 4.7% | 0.72%(+3.93)#11 | 0.88%(+3.77)#977 |
| 12. | Vernon | 4.6% | 0.72%(+3.89)#12 | 0.88%(+3.74)#989 |
| 13. | Lake City | 4.4% | 0.72%(+3.69)#13 | 0.88%(+3.53)#1,041 |
| 14. | Lake Leann | 4.3% | 0.72%(+3.54)#14 | 0.88%(+3.38)#1,079 |
| 15. | Byron Center | 3.9% | 0.72%(+3.23)#15 | 0.88%(+3.07)#1,165 |
| 16. | Port Hope | 3.6% | 0.72%(+2.85)#16 | 0.88%(+2.69)#1,315 |
| 17. | Gaastra | 3.6% | 0.72%(+2.85)#17 | 0.88%(+2.69)#1,316 |
| 18. | Pinckney | 3.5% | 0.72%(+2.80)#18 | 0.88%(+2.64)#1,337 |
| 19. | Ironwood | 3.4% | 0.72%(+2.69)#19 | 0.88%(+2.53)#1,383 |
| 20. | Comstock Northwest | 3.3% | 0.72%(+2.58)#20 | 0.88%(+2.42)#1,431 |
| 21. | Rapid City | 3.3% | 0.72%(+2.57)#21 | 0.88%(+2.41)#1,436 |
| 22. | Westwood | 3.3% | 0.72%(+2.56)#22 | 0.88%(+2.40)#1,443 |
| 23. | Au Sable | 3.2% | 0.72%(+2.50)#23 | 0.88%(+2.35)#1,472 |
| 24. | Kent City | 3.2% | 0.72%(+2.47)#24 | 0.88%(+2.31)#1,496 |
| 25. | Imlay City | 3.1% | 0.72%(+2.42)#25 | 0.88%(+2.26)#1,516 |
| 26. | Hersey | 3.1% | 0.72%(+2.40)#26 | 0.88%(+2.25)#1,529 |
| 27. | Woodland Beach | 3.0% | 0.72%(+2.32)#27 | 0.88%(+2.16)#1,577 |
| 28. | Parma | 2.9% | 0.72%(+2.19)#28 | 0.88%(+2.03)#1,652 |
| 29. | Escanaba | 2.8% | 0.72%(+2.10)#29 | 0.88%(+1.94)#1,708 |
| 30. | Traverse City | 2.8% | 0.72%(+2.09)#30 | 0.88%(+1.93)#1,717 |
| 31. | Spring Lake | 2.8% | 0.72%(+2.08)#31 | 0.88%(+1.92)#1,718 |
| 32. | Dewitt | 2.8% | 0.72%(+2.04)#32 | 0.88%(+1.88)#1,736 |
| 33. | Temperance | 2.7% | 0.72%(+2.03)#33 | 0.88%(+1.87)#1,747 |
| 34. | Leland | 2.7% | 0.72%(+1.98)#34 | 0.88%(+1.82)#1,777 |
| 35. | Carp Lake | 2.6% | 0.72%(+1.91)#35 | 0.88%(+1.75)#1,834 |
| 36. | West Ishpeming | 2.6% | 0.72%(+1.88)#36 | 0.88%(+1.72)#1,848 |
| 37. | Climax | 2.5% | 0.72%(+1.80)#37 | 0.88%(+1.64)#1,927 |
| 38. | Grant | 2.5% | 0.72%(+1.78)#38 | 0.88%(+1.62)#1,938 |
| 39. | Roosevelt Park | 2.5% | 0.72%(+1.75)#39 | 0.88%(+1.59)#1,962 |
| 40. | Gibraltar | 2.4% | 0.72%(+1.65)#40 | 0.88%(+1.49)#2,039 |
| 41. | Carleton | 2.4% | 0.72%(+1.65)#41 | 0.88%(+1.49)#2,041 |
| 42. | Rockwood | 2.4% | 0.72%(+1.63)#42 | 0.88%(+1.47)#2,047 |
| 43. | Farwell | 2.4% | 0.72%(+1.63)#43 | 0.88%(+1.47)#2,051 |
| 44. | Bloomfield Hills | 2.4% | 0.72%(+1.63)#44 | 0.88%(+1.47)#2,052 |
| 45. | Blissfield | 2.3% | 0.72%(+1.59)#45 | 0.88%(+1.43)#2,087 |
| 46. | Eaton Rapids | 2.3% | 0.72%(+1.59)#46 | 0.88%(+1.43)#2,090 |
| 47. | Lowell | 2.3% | 0.72%(+1.59)#47 | 0.88%(+1.43)#2,095 |
| 48. | Jenison | 2.3% | 0.72%(+1.57)#48 | 0.88%(+1.41)#2,109 |
| 49. | Lakes Of The North | 2.3% | 0.72%(+1.57)#49 | 0.88%(+1.41)#2,111 |
| 50. | Lake Victoria | 2.3% | 0.72%(+1.56)#50 | 0.88%(+1.40)#2,121 |
| 51. | Rogers City | 2.2% | 0.72%(+1.47)#51 | 0.88%(+1.31)#2,236 |
| 52. | Eastwood | 2.2% | 0.72%(+1.44)#52 | 0.88%(+1.29)#2,256 |
| 53. | St Johns | 2.1% | 0.72%(+1.38)#53 | 0.88%(+1.22)#2,338 |
| 54. | Deckerville | 2.0% | 0.72%(+1.32)#54 | 0.88%(+1.16)#2,417 |
| 55. | Oak Park | 2.0% | 0.72%(+1.27)#55 | 0.88%(+1.11)#2,467 |
| 56. | Big Rapids | 2.0% | 0.72%(+1.24)#56 | 0.88%(+1.08)#2,520 |
| 57. | Grass Lake | 2.0% | 0.72%(+1.23)#57 | 0.88%(+1.07)#2,523 |
| 58. | Coloma | 1.9% | 0.72%(+1.21)#58 | 0.88%(+1.06)#2,550 |
| 59. | Harper Woods | 1.8% | 0.72%(+1.11)#59 | 0.88%(+0.953)#2,679 |
| 60. | Franklin | 1.8% | 0.72%(+1.11)#60 | 0.88%(+0.952)#2,680 |
| 61. | Saline | 1.8% | 0.72%(+1.11)#61 | 0.88%(+0.950)#2,681 |
| 62. | Whitmore Lake | 1.8% | 0.72%(+1.10)#62 | 0.88%(+0.947)#2,683 |
| 63. | Marquette | 1.8% | 0.72%(+1.08)#63 | 0.88%(+0.921)#2,724 |
| 64. | K I Sawyer | 1.8% | 0.72%(+1.07)#64 | 0.88%(+0.913)#2,737 |
| 65. | Shelby | 1.8% | 0.72%(+1.06)#65 | 0.88%(+0.906)#2,744 |
| 66. | Haslett | 1.7% | 0.72%(+1.02)#66 | 0.88%(+0.859)#2,831 |
| 67. | Lansing | 1.6% | 0.72%(+0.925)#67 | 0.88%(+0.767)#2,990 |
| 68. | Brooklyn | 1.6% | 0.72%(+0.900)#68 | 0.88%(+0.742)#3,033 |
| 69. | Grosse Pointe | 1.6% | 0.72%(+0.856)#69 | 0.88%(+0.698)#3,132 |
| 70. | Belleville | 1.6% | 0.72%(+0.840)#70 | 0.88%(+0.682)#3,167 |
| 71. | Canadian Lakes | 1.5% | 0.72%(+0.824)#71 | 0.88%(+0.666)#3,200 |
| 72. | Ann Arbor | 1.5% | 0.72%(+0.793)#72 | 0.88%(+0.636)#3,272 |
| 73. | Hastings | 1.5% | 0.72%(+0.782)#73 | 0.88%(+0.624)#3,305 |
| 74. | Caledonia | 1.5% | 0.72%(+0.759)#74 | 0.88%(+0.601)#3,363 |
| 75. | Wolverine Lake | 1.5% | 0.72%(+0.733)#75 | 0.88%(+0.575)#3,416 |
| 76. | Clawson | 1.4% | 0.72%(+0.718)#76 | 0.88%(+0.560)#3,437 |
| 77. | Huntington Woods | 1.4% | 0.72%(+0.700)#77 | 0.88%(+0.542)#3,479 |
| 78. | Greenville | 1.4% | 0.72%(+0.678)#78 | 0.88%(+0.520)#3,531 |
| 79. | Fowler | 1.4% | 0.72%(+0.674)#79 | 0.88%(+0.516)#3,537 |
| 80. | Grand Ledge | 1.4% | 0.72%(+0.657)#80 | 0.88%(+0.499)#3,575 |
| 81. | Lawton | 1.4% | 0.72%(+0.639)#81 | 0.88%(+0.481)#3,610 |
| 82. | Howell | 1.4% | 0.72%(+0.629)#82 | 0.88%(+0.471)#3,633 |
| 83. | Dearborn Heights | 1.3% | 0.72%(+0.610)#83 | 0.88%(+0.452)#3,684 |
| 84. | New Era | 1.3% | 0.72%(+0.594)#84 | 0.88%(+0.437)#3,716 |
| 85. | St Joseph | 1.3% | 0.72%(+0.592)#85 | 0.88%(+0.434)#3,723 |
| 86. | Southfield | 1.3% | 0.72%(+0.589)#86 | 0.88%(+0.431)#3,735 |
| 87. | Wayne | 1.3% | 0.72%(+0.574)#87 | 0.88%(+0.416)#3,778 |
| 88. | Novi | 1.3% | 0.72%(+0.552)#88 | 0.88%(+0.394)#3,851 |
| 89. | Ferrysburg | 1.3% | 0.72%(+0.535)#89 | 0.88%(+0.377)#3,909 |
| 90. | Kalamazoo | 1.3% | 0.72%(+0.529)#90 | 0.88%(+0.371)#3,929 |
| 91. | Eastpointe | 1.2% | 0.72%(+0.510)#91 | 0.88%(+0.352)#3,985 |
| 92. | Empire | 1.2% | 0.72%(+0.498)#92 | 0.88%(+0.340)#4,025 |
| 93. | Mason | 1.2% | 0.72%(+0.476)#93 | 0.88%(+0.319)#4,095 |
| 94. | Keego Harbor | 1.2% | 0.72%(+0.470)#94 | 0.88%(+0.312)#4,110 |
| 95. | Rochester | 1.2% | 0.72%(+0.465)#95 | 0.88%(+0.307)#4,128 |
| 96. | Orchard Lake Village | 1.2% | 0.72%(+0.458)#96 | 0.88%(+0.300)#4,148 |
| 97. | Royal Oak | 1.2% | 0.72%(+0.452)#97 | 0.88%(+0.294)#4,165 |
| 98. | Fair Plain | 1.2% | 0.72%(+0.448)#98 | 0.88%(+0.290)#4,175 |
| 99. | New Buffalo | 1.1% | 0.72%(+0.415)#99 | 0.88%(+0.257)#4,271 |
| 100. | Hudsonville | 1.1% | 0.72%(+0.377)#100 | 0.88%(+0.220)#4,405 |
Common Questions
What are the Top 10 Cities with the Highest Percentage of Population with a Degree in Multidisciplinary Studies in Michigan?
Top 10 Cities with the Highest Percentage of Population with a Degree in Multidisciplinary Studies in Michigan are:
What city has the Highest Percentage of Population with a Degree in Multidisciplinary Studies in Michigan?
Morley has the Highest Percentage of Population with a Degree in Multidisciplinary Studies in Michigan with 14.0%.
What is the Percentage of Population with a Degree in Multidisciplinary Studies in the State of Michigan?
Percentage of Population with a Degree in Multidisciplinary Studies in Michigan is 0.72%.
What is the Percentage of Population with a Degree in Multidisciplinary Studies in the United States?
Percentage of Population with a Degree in Multidisciplinary Studies in the United States is 0.88%.