Zip Codes with the Highest Percentage of Population Employed in Architecture & Engineering in Holland, MI
RELATED REPORTS & OPTIONS
Architecture & Engineering
Holland
Compare Zip Codes
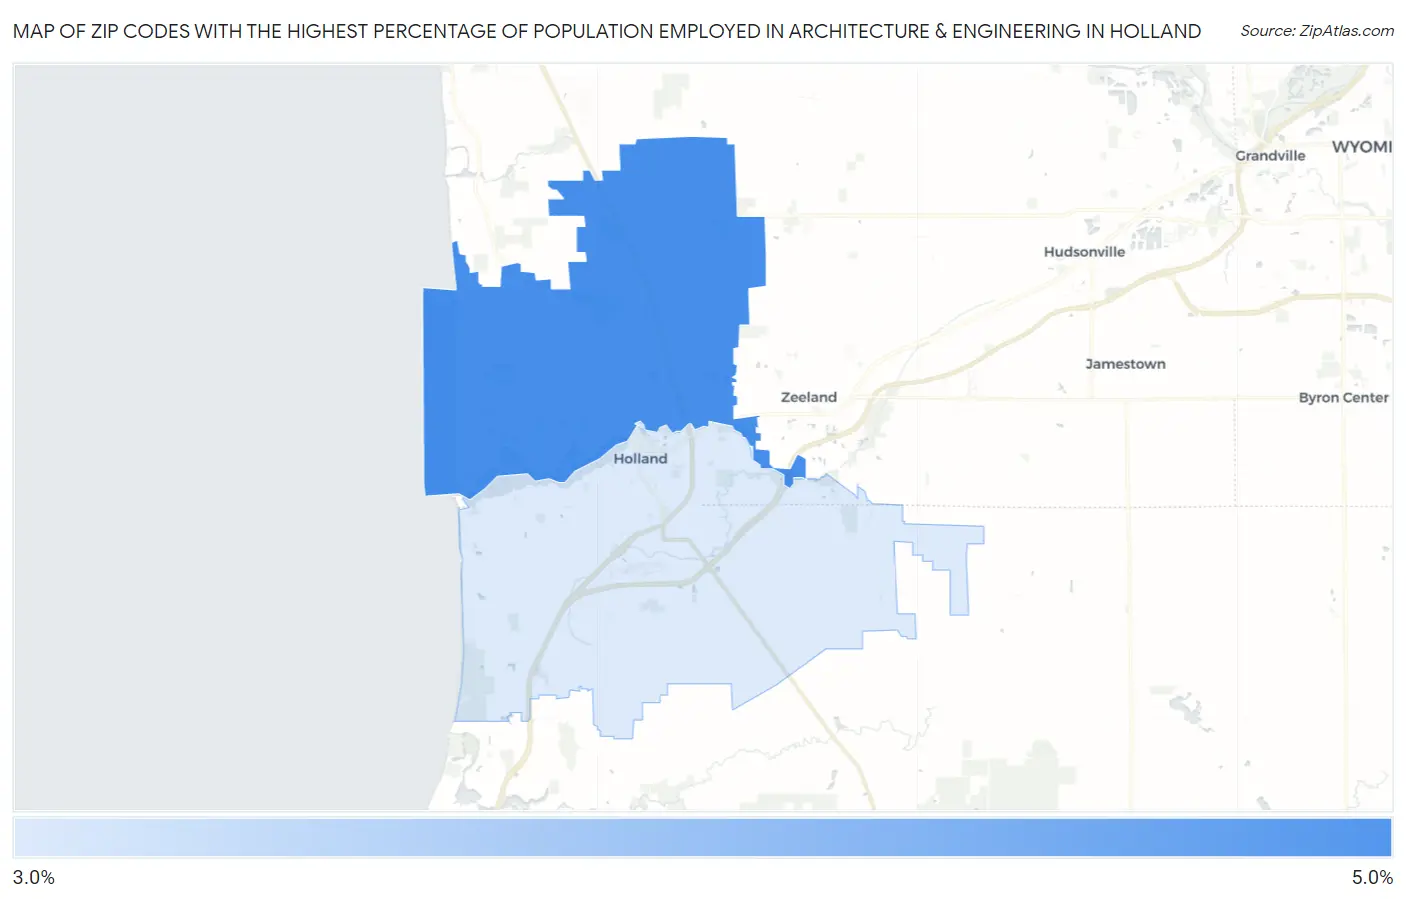
Map of Zip Codes with the Highest Percentage of Population Employed in Architecture & Engineering in Holland
3.9%
4.3%
Zip Codes with the Highest Percentage of Population Employed in Architecture & Engineering in Holland, MI
| Zip Code | % Employed | vs State | vs National | |
| 1. | 49424 | 4.3% | 3.4%(+0.909)#158 | 2.1%(+2.13)#2,399 |
| 2. | 49423 | 3.9% | 3.4%(+0.551)#181 | 2.1%(+1.77)#2,902 |
1
Common Questions
What are the Top Zip Codes with the Highest Percentage of Population Employed in Architecture & Engineering in Holland, MI?
Top Zip Codes with the Highest Percentage of Population Employed in Architecture & Engineering in Holland, MI are:
What zip code has the Highest Percentage of Population Employed in Architecture & Engineering in Holland, MI?
49424 has the Highest Percentage of Population Employed in Architecture & Engineering in Holland, MI with 4.3%.
What is the Percentage of Population Employed in Architecture & Engineering in Holland, MI?
Percentage of Population Employed in Architecture & Engineering in Holland is 3.8%.
What is the Percentage of Population Employed in Architecture & Engineering in Michigan?
Percentage of Population Employed in Architecture & Engineering in Michigan is 3.4%.
What is the Percentage of Population Employed in Architecture & Engineering in the United States?
Percentage of Population Employed in Architecture & Engineering in the United States is 2.1%.