Zip Codes with the Highest Percentage of Population Employed in Architecture & Engineering in East Lansing, MI
RELATED REPORTS & OPTIONS
Architecture & Engineering
East Lansing
Compare Zip Codes
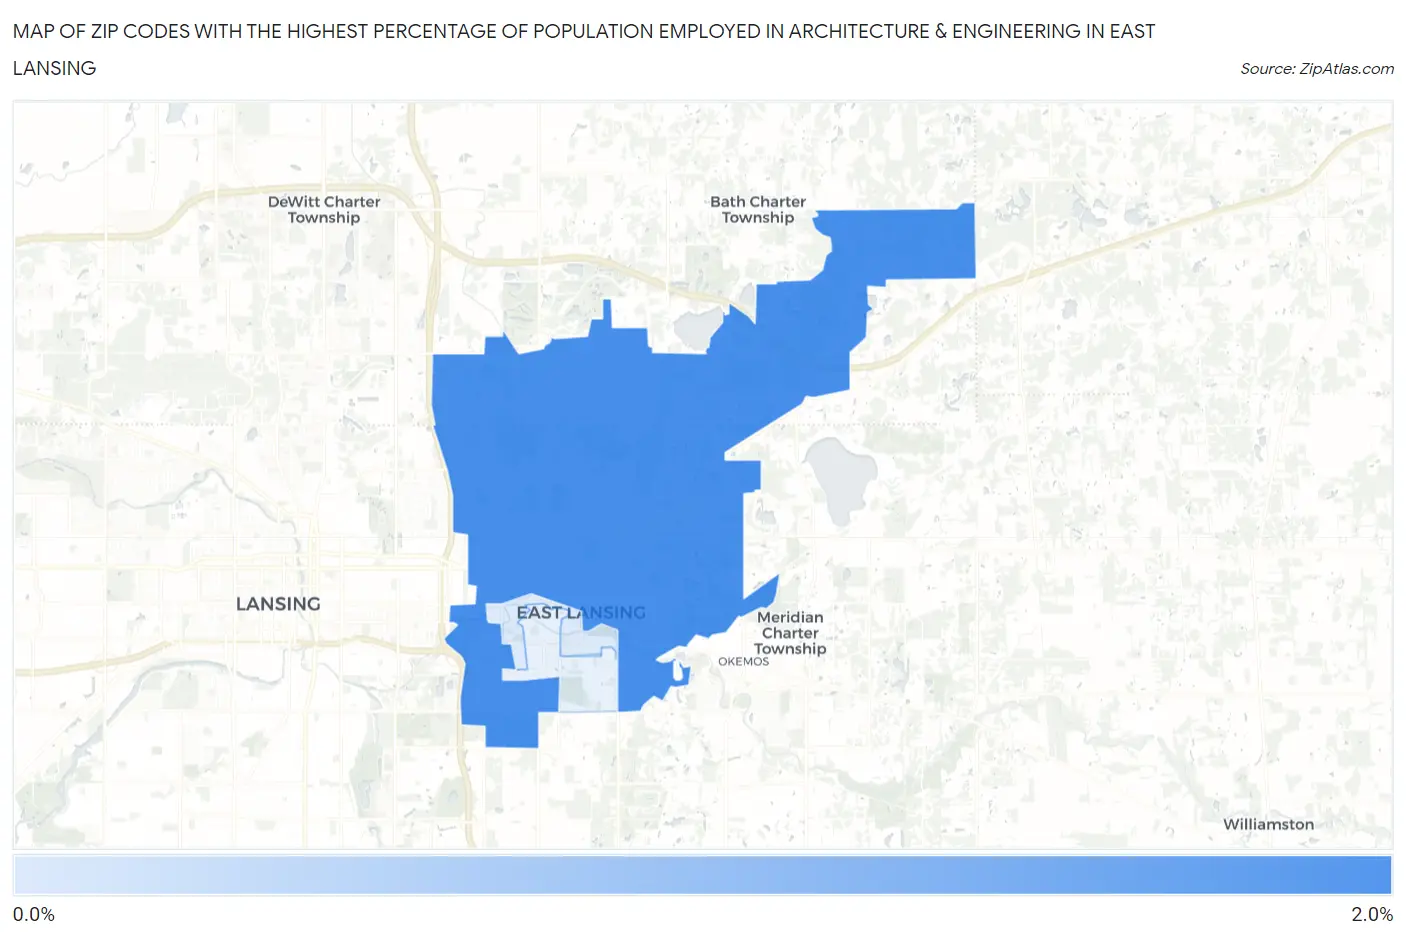
Map of Zip Codes with the Highest Percentage of Population Employed in Architecture & Engineering in East Lansing
0.39%
1.9%
Zip Codes with the Highest Percentage of Population Employed in Architecture & Engineering in East Lansing, MI
| Zip Code | % Employed | vs State | vs National | |
| 1. | 48823 | 1.9% | 3.4%(-1.48)#483 | 2.1%(-0.267)#10,348 |
| 2. | 48825 | 0.39% | 3.4%(-2.97)#809 | 2.1%(-1.76)#21,008 |
1
Common Questions
What are the Top Zip Codes with the Highest Percentage of Population Employed in Architecture & Engineering in East Lansing, MI?
Top Zip Codes with the Highest Percentage of Population Employed in Architecture & Engineering in East Lansing, MI are:
What zip code has the Highest Percentage of Population Employed in Architecture & Engineering in East Lansing, MI?
48823 has the Highest Percentage of Population Employed in Architecture & Engineering in East Lansing, MI with 1.9%.
What is the Percentage of Population Employed in Architecture & Engineering in East Lansing, MI?
Percentage of Population Employed in Architecture & Engineering in East Lansing is 1.5%.
What is the Percentage of Population Employed in Architecture & Engineering in Michigan?
Percentage of Population Employed in Architecture & Engineering in Michigan is 3.4%.
What is the Percentage of Population Employed in Architecture & Engineering in the United States?
Percentage of Population Employed in Architecture & Engineering in the United States is 2.1%.