Zip Codes with the Highest Percentage of Population Employed in Architecture & Engineering in Pontiac, MI
RELATED REPORTS & OPTIONS
Architecture & Engineering
Pontiac
Compare Zip Codes
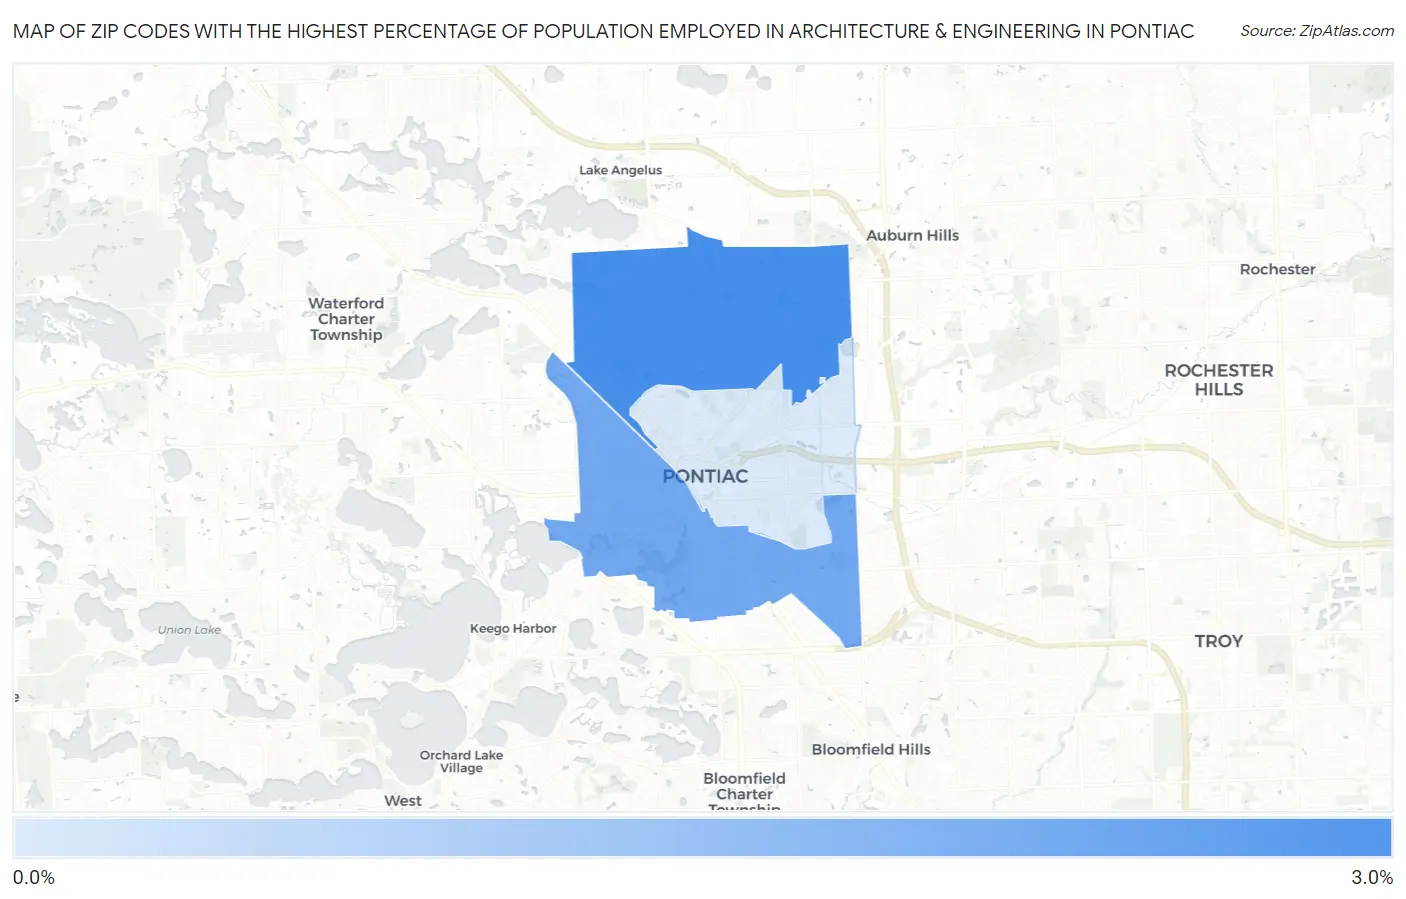
Map of Zip Codes with the Highest Percentage of Population Employed in Architecture & Engineering in Pontiac
0.31%
2.6%
Zip Codes with the Highest Percentage of Population Employed in Architecture & Engineering in Pontiac, MI
| Zip Code | % Employed | vs State | vs National | |
| 1. | 48340 | 2.6% | 3.4%(-0.722)#332 | 2.1%(+0.496)#6,390 |
| 2. | 48341 | 2.0% | 3.4%(-1.39)#452 | 2.1%(-0.167)#9,730 |
| 3. | 48342 | 0.31% | 3.4%(-3.05)#821 | 2.1%(-1.83)#21,463 |
1
Common Questions
What are the Top Zip Codes with the Highest Percentage of Population Employed in Architecture & Engineering in Pontiac, MI?
Top Zip Codes with the Highest Percentage of Population Employed in Architecture & Engineering in Pontiac, MI are:
What zip code has the Highest Percentage of Population Employed in Architecture & Engineering in Pontiac, MI?
48340 has the Highest Percentage of Population Employed in Architecture & Engineering in Pontiac, MI with 2.6%.
What is the Percentage of Population Employed in Architecture & Engineering in Pontiac, MI?
Percentage of Population Employed in Architecture & Engineering in Pontiac is 1.9%.
What is the Percentage of Population Employed in Architecture & Engineering in Michigan?
Percentage of Population Employed in Architecture & Engineering in Michigan is 3.4%.
What is the Percentage of Population Employed in Architecture & Engineering in the United States?
Percentage of Population Employed in Architecture & Engineering in the United States is 2.1%.