Zip Codes with the Highest Percentage of Population Employed in Architecture & Engineering in Southfield, MI
RELATED REPORTS & OPTIONS
Architecture & Engineering
Southfield
Compare Zip Codes
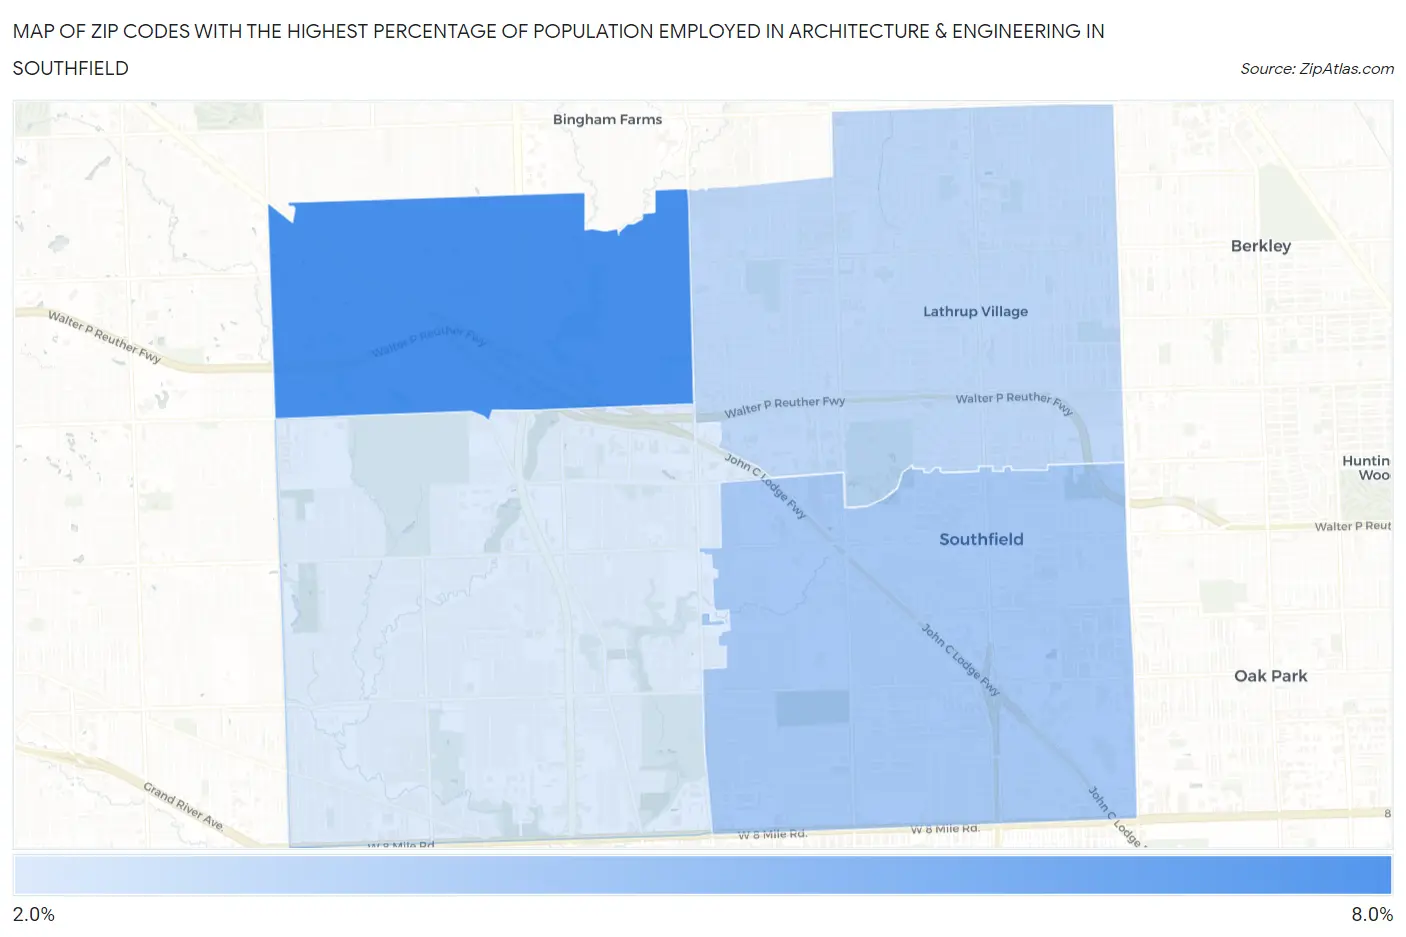
Map of Zip Codes with the Highest Percentage of Population Employed in Architecture & Engineering in Southfield
2.5%
6.2%
Zip Codes with the Highest Percentage of Population Employed in Architecture & Engineering in Southfield, MI
| Zip Code | % Employed | vs State | vs National | |
| 1. | 48034 | 6.2% | 3.4%(+2.83)#64 | 2.1%(+4.05)#1,002 |
| 2. | 48075 | 3.9% | 3.4%(+0.493)#187 | 2.1%(+1.71)#2,992 |
| 3. | 48076 | 3.3% | 3.4%(-0.072)#239 | 2.1%(+1.15)#4,212 |
| 4. | 48033 | 2.5% | 3.4%(-0.884)#361 | 2.1%(+0.333)#7,077 |
1
Common Questions
What are the Top 3 Zip Codes with the Highest Percentage of Population Employed in Architecture & Engineering in Southfield, MI?
Top 3 Zip Codes with the Highest Percentage of Population Employed in Architecture & Engineering in Southfield, MI are:
What zip code has the Highest Percentage of Population Employed in Architecture & Engineering in Southfield, MI?
48034 has the Highest Percentage of Population Employed in Architecture & Engineering in Southfield, MI with 6.2%.
What is the Percentage of Population Employed in Architecture & Engineering in Southfield, MI?
Percentage of Population Employed in Architecture & Engineering in Southfield is 3.9%.
What is the Percentage of Population Employed in Architecture & Engineering in Michigan?
Percentage of Population Employed in Architecture & Engineering in Michigan is 3.4%.
What is the Percentage of Population Employed in Architecture & Engineering in the United States?
Percentage of Population Employed in Architecture & Engineering in the United States is 2.1%.