Farmington Hills, MI Map & Demographics
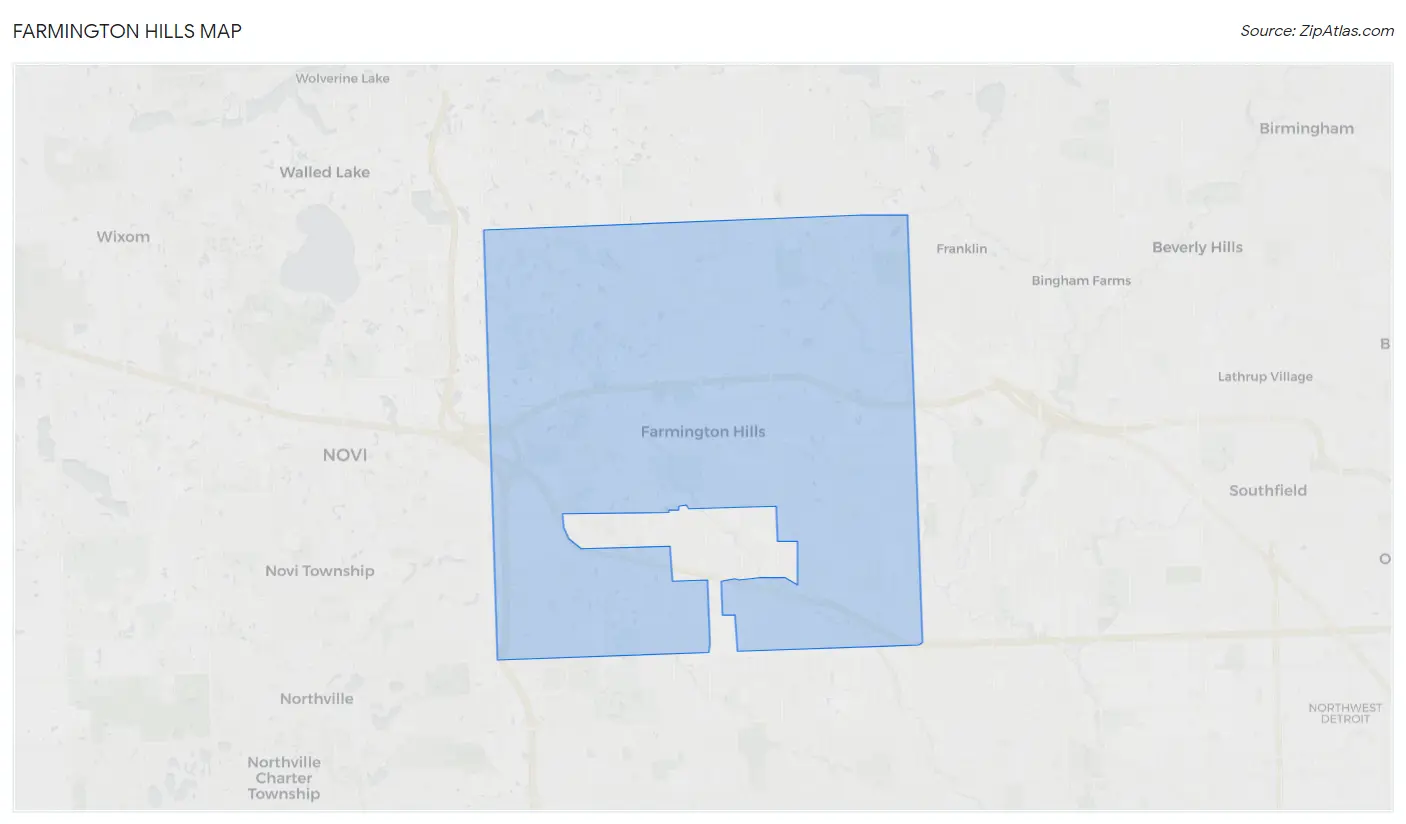
Farmington Hills Map
Farmington Hills Overview
$53,661
PER CAPITA INCOME
$129,403
AVG FAMILY INCOME
$101,728
AVG HOUSEHOLD INCOME
39.3%
WAGE / INCOME GAP [ % ]
60.7¢/ $1
WAGE / INCOME GAP [ $ ]
0.42
INEQUALITY / GINI INDEX
83,562
TOTAL POPULATION
41,677
MALE POPULATION
41,885
FEMALE POPULATION
99.50
MALES / 100 FEMALES
100.50
FEMALES / 100 MALES
41.6
MEDIAN AGE
3.0
AVG FAMILY SIZE
2.3
AVG HOUSEHOLD SIZE
47,506
LABOR FORCE [ PEOPLE ]
67.2%
PERCENT IN LABOR FORCE
4.8%
UNEMPLOYMENT RATE
Farmington Hills Area Codes
Income in Farmington Hills
Income Overview in Farmington Hills
Per Capita Income in Farmington Hills is $53,661, while median incomes of families and households are $129,403 and $101,728 respectively.
| Characteristic | Number | Measure |
| Per Capita Income | 83,562 | $53,661 |
| Median Family Income | 21,590 | $129,403 |
| Mean Family Income | 21,590 | $146,547 |
| Median Household Income | 35,366 | $101,728 |
| Mean Household Income | 35,366 | $124,925 |
| Income Deficit | 21,590 | $0 |
| Wage / Income Gap (%) | 83,562 | 39.27% |
| Wage / Income Gap ($) | 83,562 | 60.73¢ per $1 |
| Gini / Inequality Index | 83,562 | 0.42 |
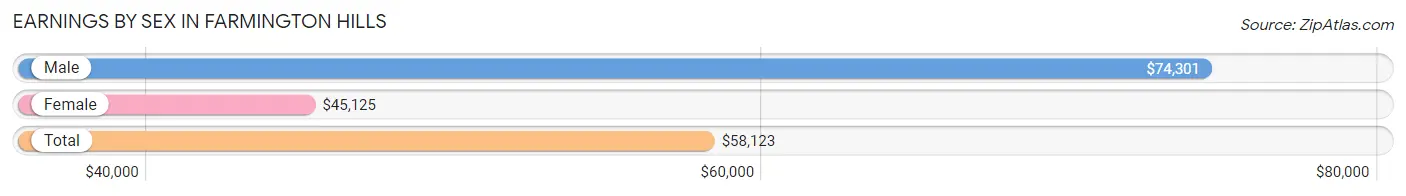
Earnings by Sex in Farmington Hills
Average Earnings in Farmington Hills are $58,123, $74,301 for men and $45,125 for women, a difference of 39.3%.
| Sex | Number | Average Earnings |
| Male | 27,022 (55.3%) | $74,301 |
| Female | 21,818 (44.7%) | $45,125 |
| Total | 48,840 (100.0%) | $58,123 |
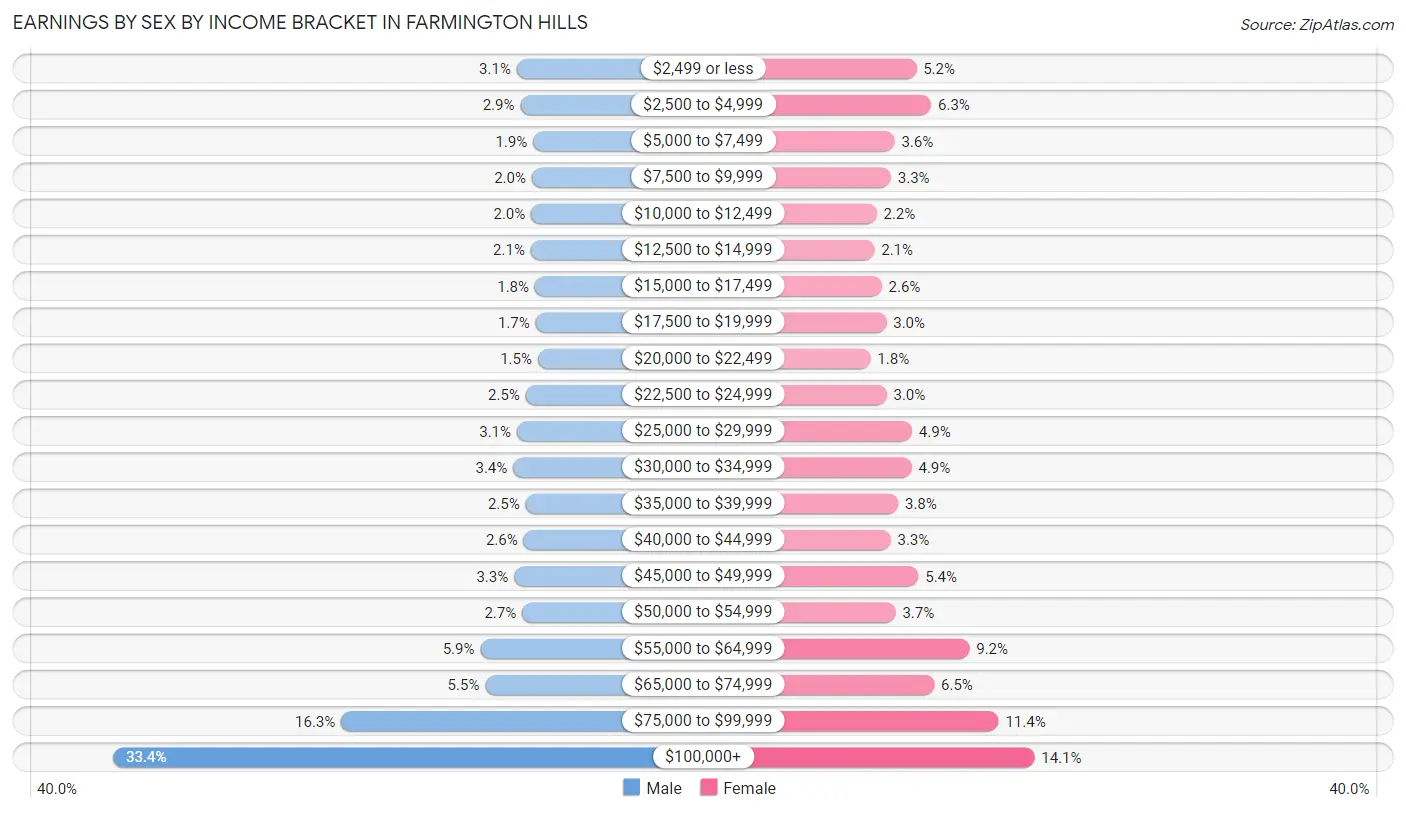
Earnings by Sex by Income Bracket in Farmington Hills
The most common earnings brackets in Farmington Hills are $100,000+ for men (9,016 | 33.4%) and $100,000+ for women (3,065 | 14.1%).
| Income | Male | Female |
| $2,499 or less | 842 (3.1%) | 1,135 (5.2%) |
| $2,500 to $4,999 | 771 (2.9%) | 1,378 (6.3%) |
| $5,000 to $7,499 | 512 (1.9%) | 778 (3.6%) |
| $7,500 to $9,999 | 538 (2.0%) | 720 (3.3%) |
| $10,000 to $12,499 | 551 (2.0%) | 486 (2.2%) |
| $12,500 to $14,999 | 560 (2.1%) | 450 (2.1%) |
| $15,000 to $17,499 | 475 (1.8%) | 570 (2.6%) |
| $17,500 to $19,999 | 463 (1.7%) | 645 (3.0%) |
| $20,000 to $22,499 | 415 (1.5%) | 387 (1.8%) |
| $22,500 to $24,999 | 663 (2.5%) | 651 (3.0%) |
| $25,000 to $29,999 | 840 (3.1%) | 1,064 (4.9%) |
| $30,000 to $34,999 | 917 (3.4%) | 1,059 (4.9%) |
| $35,000 to $39,999 | 664 (2.5%) | 837 (3.8%) |
| $40,000 to $44,999 | 704 (2.6%) | 716 (3.3%) |
| $45,000 to $49,999 | 896 (3.3%) | 1,170 (5.4%) |
| $50,000 to $54,999 | 734 (2.7%) | 797 (3.6%) |
| $55,000 to $64,999 | 1,582 (5.9%) | 2,003 (9.2%) |
| $65,000 to $74,999 | 1,481 (5.5%) | 1,426 (6.5%) |
| $75,000 to $99,999 | 4,398 (16.3%) | 2,481 (11.4%) |
| $100,000+ | 9,016 (33.4%) | 3,065 (14.1%) |
| Total | 27,022 (100.0%) | 21,818 (100.0%) |
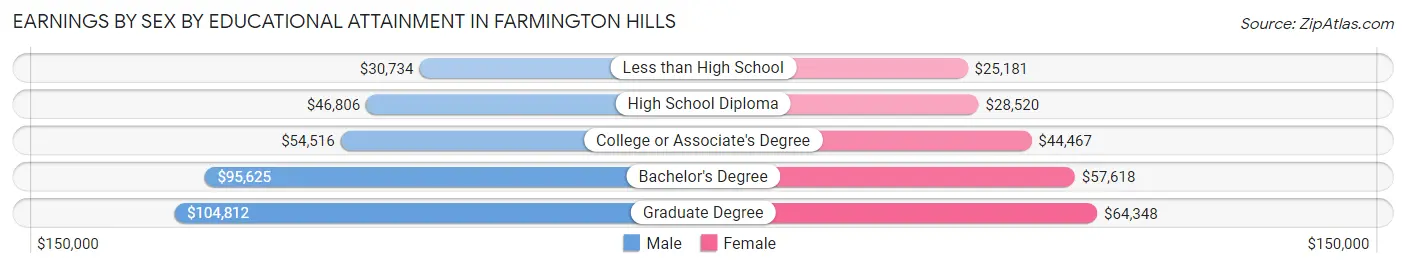
Earnings by Sex by Educational Attainment in Farmington Hills
Average earnings in Farmington Hills are $86,242 for men and $51,171 for women, a difference of 40.7%. Men with an educational attainment of graduate degree enjoy the highest average annual earnings of $104,812, while those with less than high school education earn the least with $30,734. Women with an educational attainment of graduate degree earn the most with the average annual earnings of $64,348, while those with less than high school education have the smallest earnings of $25,181.
| Educational Attainment | Male Income | Female Income |
| Less than High School | $30,734 | $25,181 |
| High School Diploma | $46,806 | $28,520 |
| College or Associate's Degree | $54,516 | $44,467 |
| Bachelor's Degree | $95,625 | $57,618 |
| Graduate Degree | $104,812 | $64,348 |
| Total | $86,242 | $51,171 |
Family Income in Farmington Hills
Family Income Brackets in Farmington Hills
According to the Farmington Hills family income data, there are 5,505 families falling into the $100,000 to $149,999 income range, which is the most common income bracket and makes up 25.5% of all families. Conversely, the $10,000 to $14,999 income bracket is the least frequent group with only 43 families (0.2%) belonging to this category.
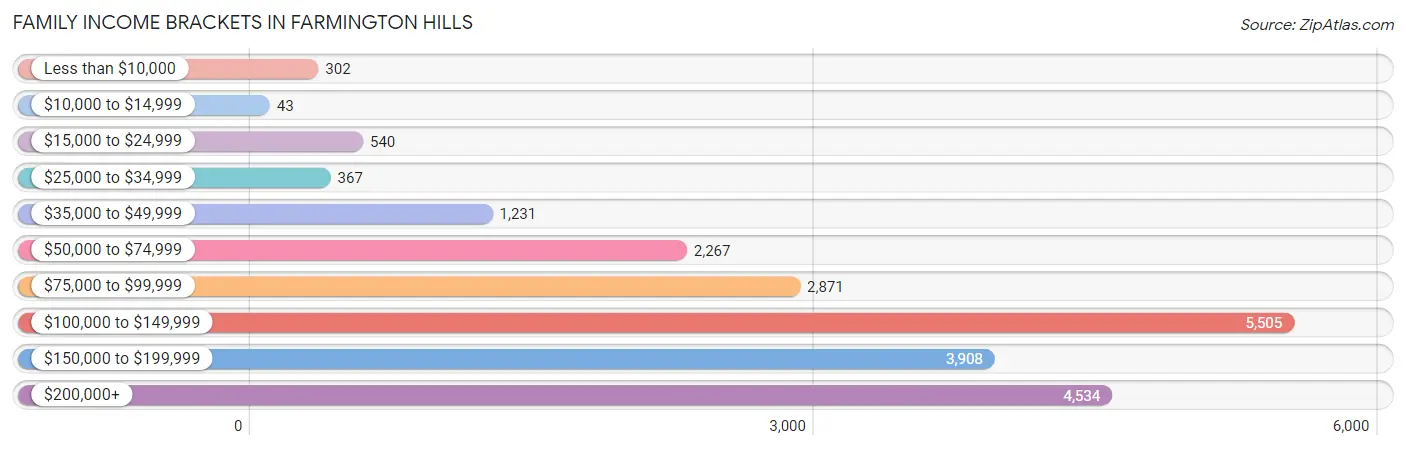
| Income Bracket | # Families | % Families |
| Less than $10,000 | 302 | 1.4% |
| $10,000 to $14,999 | 43 | 0.2% |
| $15,000 to $24,999 | 540 | 2.5% |
| $25,000 to $34,999 | 367 | 1.7% |
| $35,000 to $49,999 | 1,231 | 5.7% |
| $50,000 to $74,999 | 2,267 | 10.5% |
| $75,000 to $99,999 | 2,871 | 13.3% |
| $100,000 to $149,999 | 5,505 | 25.5% |
| $150,000 to $199,999 | 3,908 | 18.1% |
| $200,000+ | 4,534 | 21.0% |
Family Income by Famaliy Size in Farmington Hills
7+ person families (246 | 1.1%) account for the highest median family income in Farmington Hills with $169,716 per family, while 2-person families (9,973 | 46.2%) have the highest median income of $56,363 per family member.
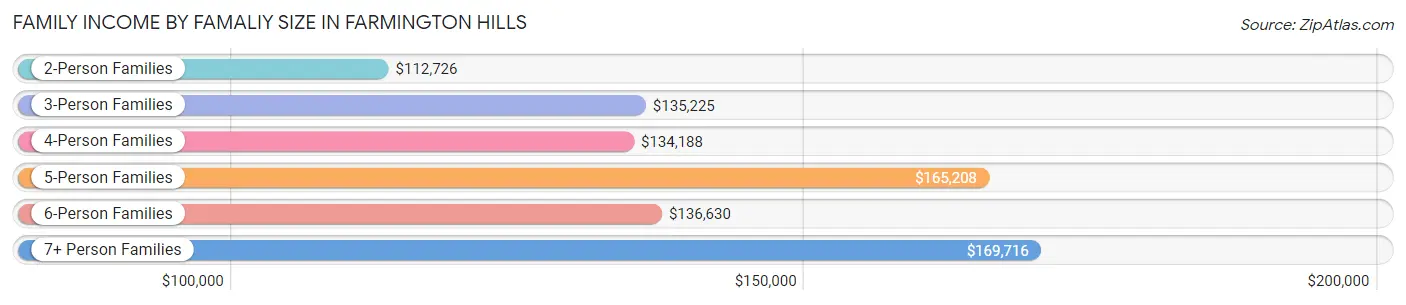
| Income Bracket | # Families | Median Income |
| 2-Person Families | 9,973 (46.2%) | $112,726 |
| 3-Person Families | 5,481 (25.4%) | $135,225 |
| 4-Person Families | 3,969 (18.4%) | $134,188 |
| 5-Person Families | 1,367 (6.3%) | $165,208 |
| 6-Person Families | 554 (2.6%) | $136,630 |
| 7+ Person Families | 246 (1.1%) | $169,716 |
| Total | 21,590 (100.0%) | $129,403 |
Family Income by Number of Earners in Farmington Hills
The median family income in Farmington Hills is $129,403, with families comprising 3+ earners (3,257) having the highest median family income of $168,719, while families with no earners (2,525) have the lowest median family income of $79,409, accounting for 15.1% and 11.7% of families, respectively.
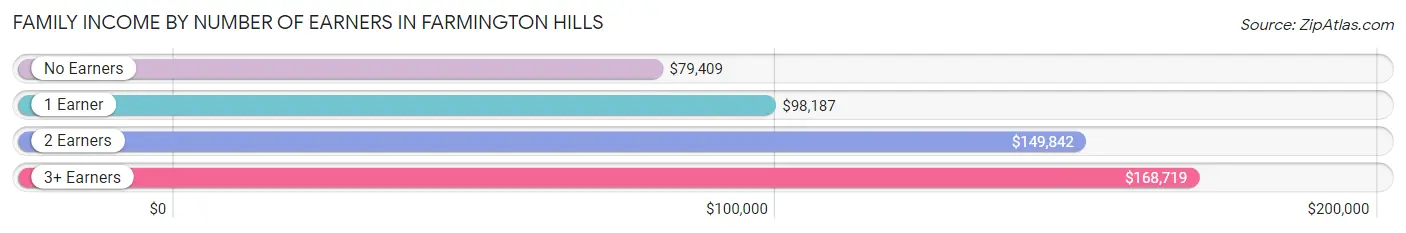
| Number of Earners | # Families | Median Income |
| No Earners | 2,525 (11.7%) | $79,409 |
| 1 Earner | 6,427 (29.8%) | $98,187 |
| 2 Earners | 9,381 (43.4%) | $149,842 |
| 3+ Earners | 3,257 (15.1%) | $168,719 |
| Total | 21,590 (100.0%) | $129,403 |
Household Income in Farmington Hills
Household Income Brackets in Farmington Hills
With 7,604 households falling in the category, the $100,000 to $149,999 income range is the most frequent in Farmington Hills, accounting for 21.5% of all households. In contrast, only 530 households (1.5%) fall into the $10,000 to $14,999 income bracket, making it the least populous group.
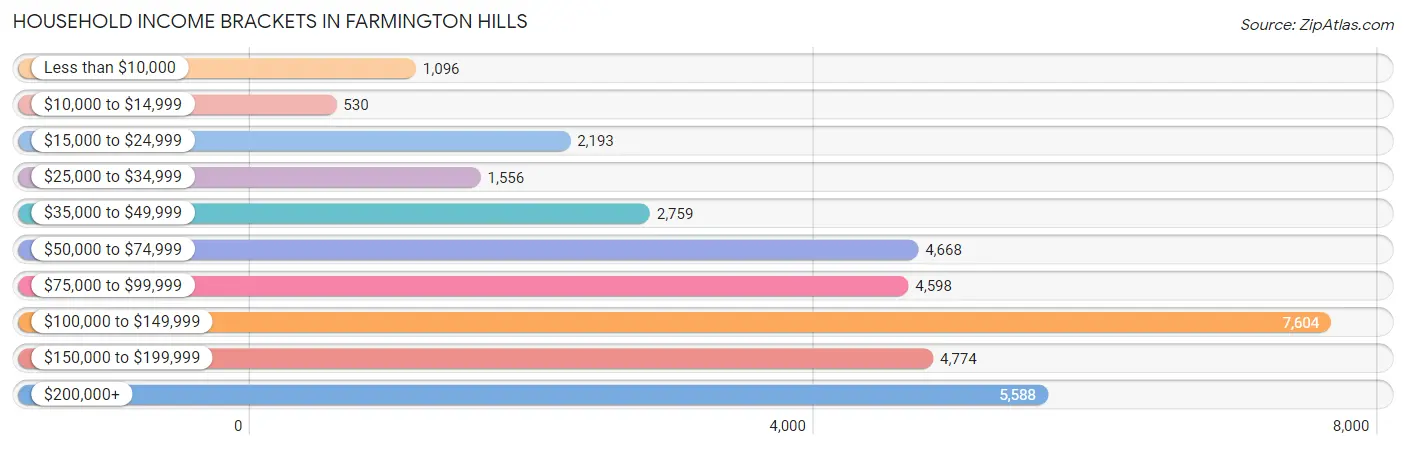
| Income Bracket | # Households | % Households |
| Less than $10,000 | 1,096 | 3.1% |
| $10,000 to $14,999 | 530 | 1.5% |
| $15,000 to $24,999 | 2,193 | 6.2% |
| $25,000 to $34,999 | 1,556 | 4.4% |
| $35,000 to $49,999 | 2,759 | 7.8% |
| $50,000 to $74,999 | 4,668 | 13.2% |
| $75,000 to $99,999 | 4,598 | 13.0% |
| $100,000 to $149,999 | 7,604 | 21.5% |
| $150,000 to $199,999 | 4,774 | 13.5% |
| $200,000+ | 5,588 | 15.8% |
Household Income by Householder Age in Farmington Hills
The median household income in Farmington Hills is $101,728, with the highest median household income of $120,557 found in the 45 to 64 years age bracket for the primary householder. A total of 12,203 households (34.5%) fall into this category. Meanwhile, the 15 to 24 years age bracket for the primary householder has the lowest median household income of $48,574, with 829 households (2.3%) in this group.
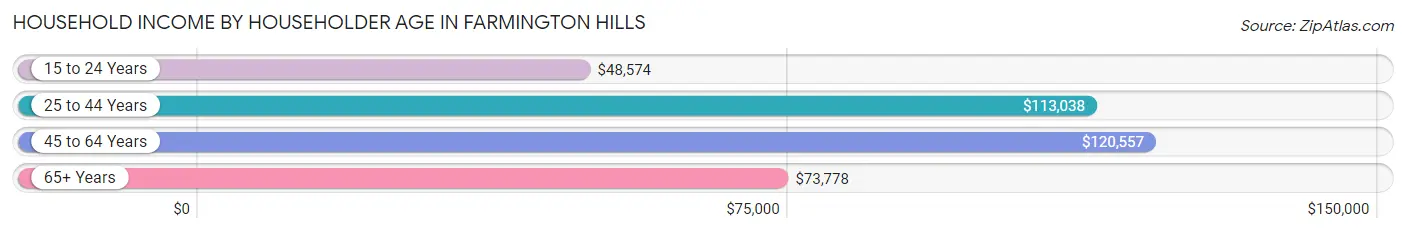
| Income Bracket | # Households | Median Income |
| 15 to 24 Years | 829 (2.3%) | $48,574 |
| 25 to 44 Years | 11,480 (32.5%) | $113,038 |
| 45 to 64 Years | 12,203 (34.5%) | $120,557 |
| 65+ Years | 10,854 (30.7%) | $73,778 |
| Total | 35,366 (100.0%) | $101,728 |
Poverty in Farmington Hills
Income Below Poverty by Sex and Age in Farmington Hills
With 5.1% poverty level for males and 6.3% for females among the residents of Farmington Hills, 18 to 24 year old males and 15 year old females are the most vulnerable to poverty, with 667 males (16.7%) and 69 females (22.0%) in their respective age groups living below the poverty level.
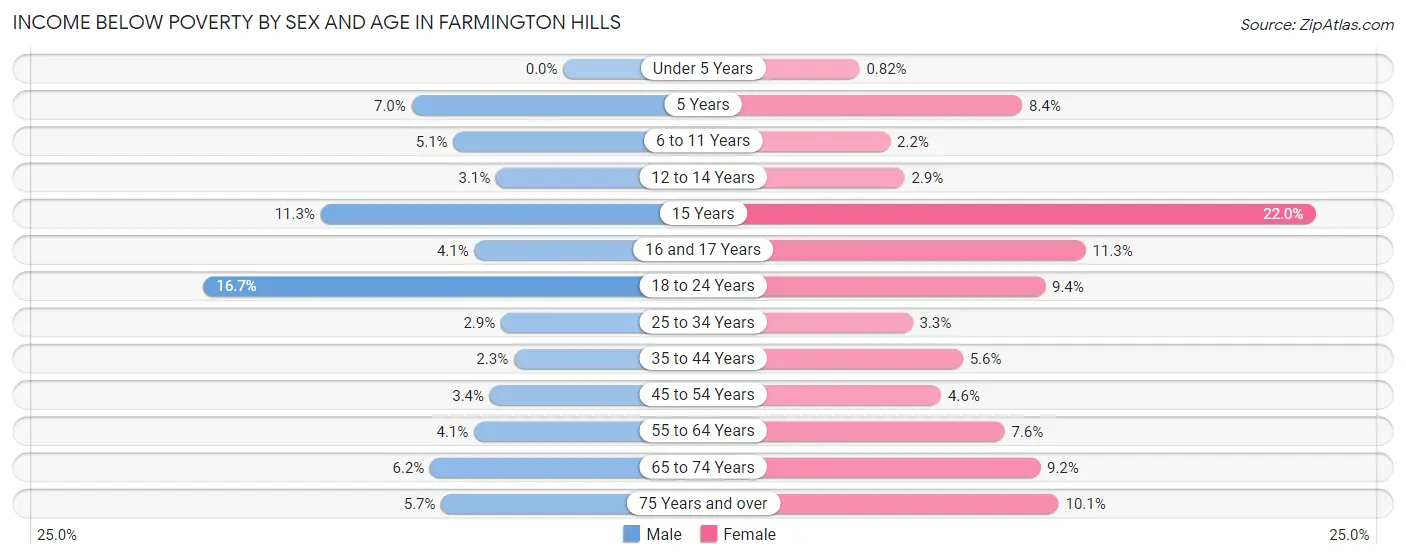
| Age Bracket | Male | Female |
| Under 5 Years | 0 (0.0%) | 17 (0.8%) |
| 5 Years | 28 (7.0%) | 21 (8.4%) |
| 6 to 11 Years | 121 (5.1%) | 51 (2.2%) |
| 12 to 14 Years | 41 (3.1%) | 36 (2.9%) |
| 15 Years | 50 (11.3%) | 69 (22.0%) |
| 16 and 17 Years | 43 (4.1%) | 107 (11.3%) |
| 18 to 24 Years | 667 (16.7%) | 301 (9.4%) |
| 25 to 34 Years | 197 (2.9%) | 195 (3.3%) |
| 35 to 44 Years | 112 (2.3%) | 289 (5.6%) |
| 45 to 54 Years | 188 (3.4%) | 253 (4.6%) |
| 55 to 64 Years | 210 (4.1%) | 440 (7.5%) |
| 65 to 74 Years | 281 (6.2%) | 434 (9.2%) |
| 75 Years and over | 172 (5.7%) | 415 (10.1%) |
| Total | 2,110 (5.1%) | 2,628 (6.3%) |
Income Above Poverty by Sex and Age in Farmington Hills
According to the poverty statistics in Farmington Hills, males aged under 5 years and females aged under 5 years are the age groups that are most secure financially, with 100.0% of males and 99.2% of females in these age groups living above the poverty line.
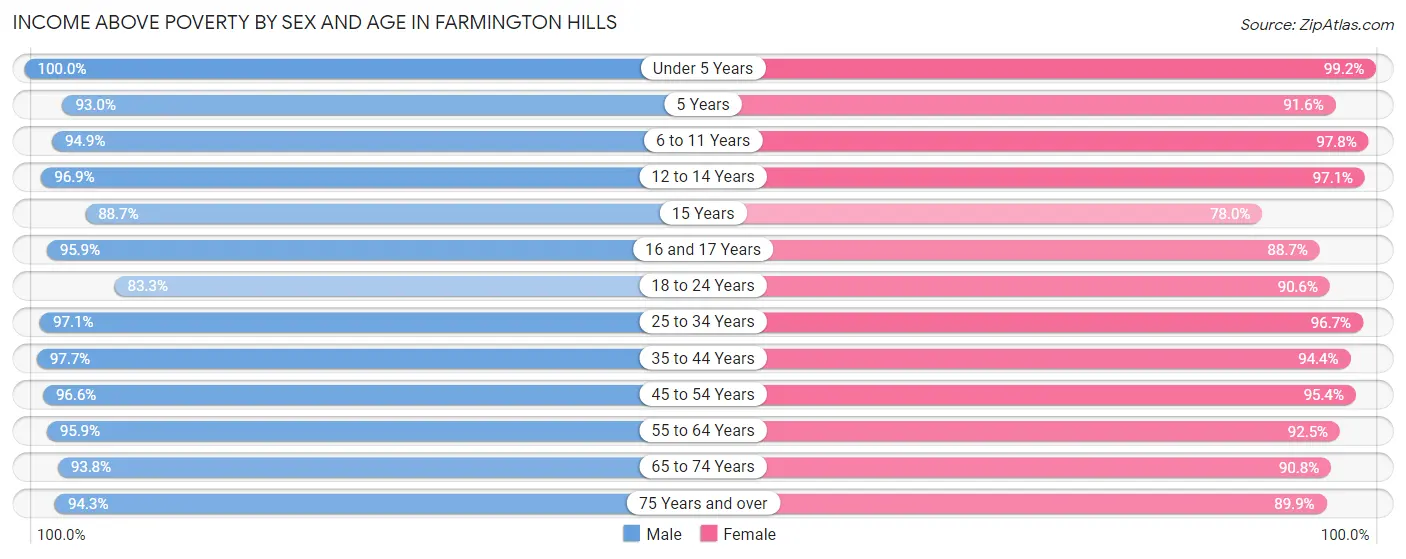
| Age Bracket | Male | Female |
| Under 5 Years | 2,066 (100.0%) | 2,061 (99.2%) |
| 5 Years | 370 (93.0%) | 230 (91.6%) |
| 6 to 11 Years | 2,250 (94.9%) | 2,222 (97.8%) |
| 12 to 14 Years | 1,275 (96.9%) | 1,202 (97.1%) |
| 15 Years | 394 (88.7%) | 245 (78.0%) |
| 16 and 17 Years | 1,000 (95.9%) | 839 (88.7%) |
| 18 to 24 Years | 3,326 (83.3%) | 2,892 (90.6%) |
| 25 to 34 Years | 6,617 (97.1%) | 5,754 (96.7%) |
| 35 to 44 Years | 4,771 (97.7%) | 4,859 (94.4%) |
| 45 to 54 Years | 5,329 (96.6%) | 5,236 (95.4%) |
| 55 to 64 Years | 4,863 (95.9%) | 5,389 (92.4%) |
| 65 to 74 Years | 4,266 (93.8%) | 4,282 (90.8%) |
| 75 Years and over | 2,865 (94.3%) | 3,710 (89.9%) |
| Total | 39,392 (94.9%) | 38,921 (93.7%) |
Income Below Poverty Among Married-Couple Families in Farmington Hills
The poverty statistics for married-couple families in Farmington Hills show that 2.0% or 342 of the total 17,296 families live below the poverty line. Families with 3 or 4 children have the highest poverty rate of 2.8%, comprising of 27 families. On the other hand, families with 5 or more children have the lowest poverty rate of 0.0%, which includes 0 families.
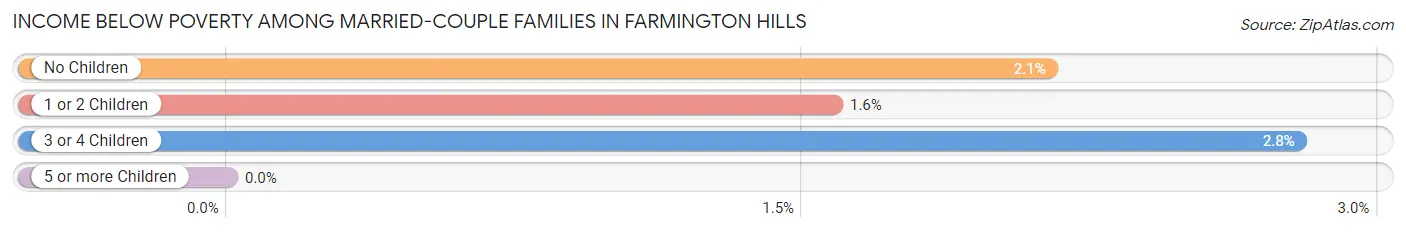
| Children | Above Poverty | Below Poverty |
| No Children | 10,233 (97.9%) | 224 (2.1%) |
| 1 or 2 Children | 5,665 (98.4%) | 91 (1.6%) |
| 3 or 4 Children | 942 (97.2%) | 27 (2.8%) |
| 5 or more Children | 114 (100.0%) | 0 (0.0%) |
| Total | 16,954 (98.0%) | 342 (2.0%) |
Income Below Poverty Among Single-Parent Households in Farmington Hills
According to the poverty data in Farmington Hills, 3.0% or 39 single-father households and 11.7% or 351 single-mother households are living below the poverty line. Among single-father households, those with 3 or 4 children have the highest poverty rate, with 24 households (29.6%) experiencing poverty. Likewise, among single-mother households, those with 1 or 2 children have the highest poverty rate, with 247 households (17.0%) falling below the poverty line.
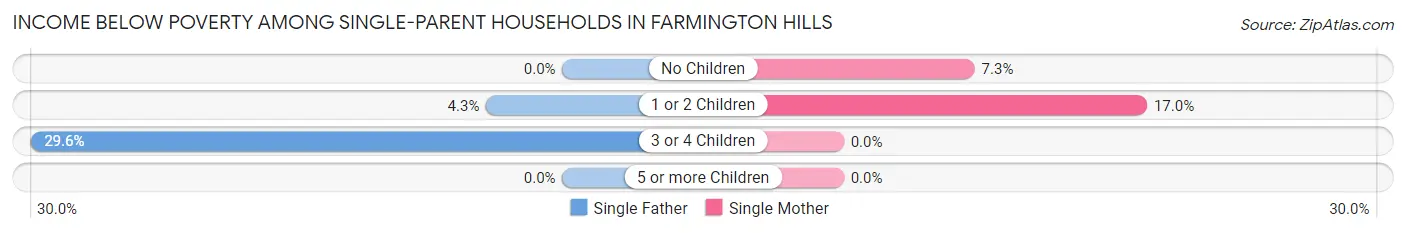
| Children | Single Father | Single Mother |
| No Children | 0 (0.0%) | 104 (7.3%) |
| 1 or 2 Children | 15 (4.3%) | 247 (17.0%) |
| 3 or 4 Children | 24 (29.6%) | 0 (0.0%) |
| 5 or more Children | 0 (0.0%) | 0 (0.0%) |
| Total | 39 (3.0%) | 351 (11.7%) |
Income Below Poverty Among Married-Couple vs Single-Parent Households in Farmington Hills
The poverty data for Farmington Hills shows that 342 of the married-couple family households (2.0%) and 390 of the single-parent households (9.1%) are living below the poverty level. Within the married-couple family households, those with 3 or 4 children have the highest poverty rate, with 27 households (2.8%) falling below the poverty line. Among the single-parent households, those with 1 or 2 children have the highest poverty rate, with 262 household (14.5%) living below poverty.
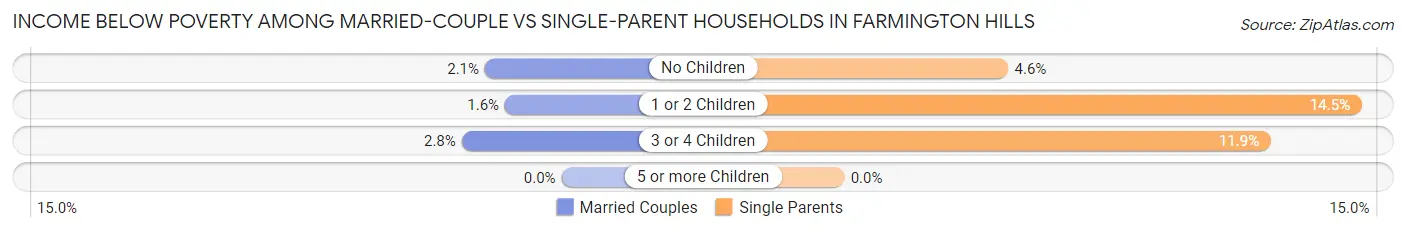
| Children | Married-Couple Families | Single-Parent Households |
| No Children | 224 (2.1%) | 104 (4.6%) |
| 1 or 2 Children | 91 (1.6%) | 262 (14.5%) |
| 3 or 4 Children | 27 (2.8%) | 24 (11.9%) |
| 5 or more Children | 0 (0.0%) | 0 (0.0%) |
| Total | 342 (2.0%) | 390 (9.1%) |
Race in Farmington Hills
The most populous races in Farmington Hills are White / Caucasian (50,707 | 60.7%), Black / African American (14,863 | 17.8%), and Asian (12,109 | 14.5%).
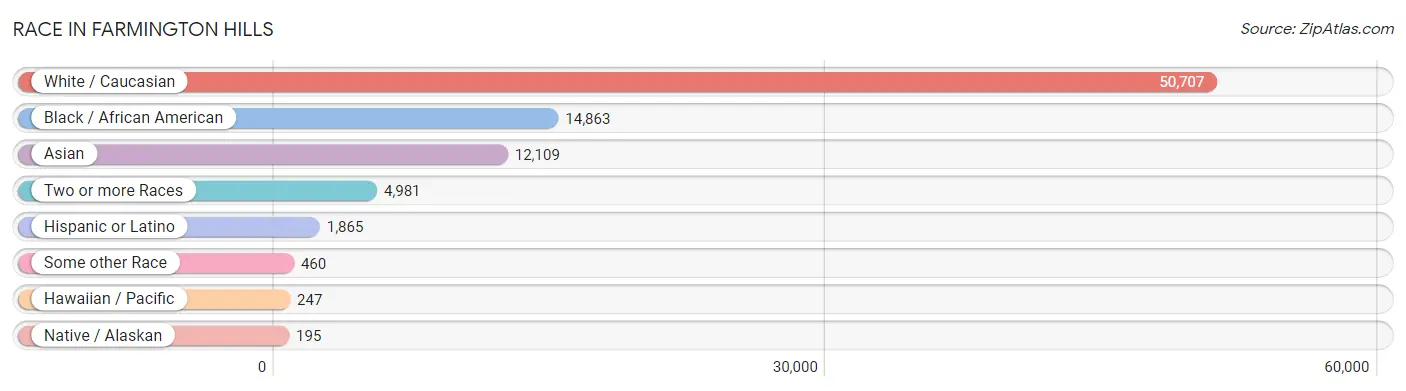
| Race | # Population | % Population |
| Asian | 12,109 | 14.5% |
| Black / African American | 14,863 | 17.8% |
| Hawaiian / Pacific | 247 | 0.3% |
| Hispanic or Latino | 1,865 | 2.2% |
| Native / Alaskan | 195 | 0.2% |
| White / Caucasian | 50,707 | 60.7% |
| Two or more Races | 4,981 | 6.0% |
| Some other Race | 460 | 0.5% |
| Total | 83,562 | 100.0% |
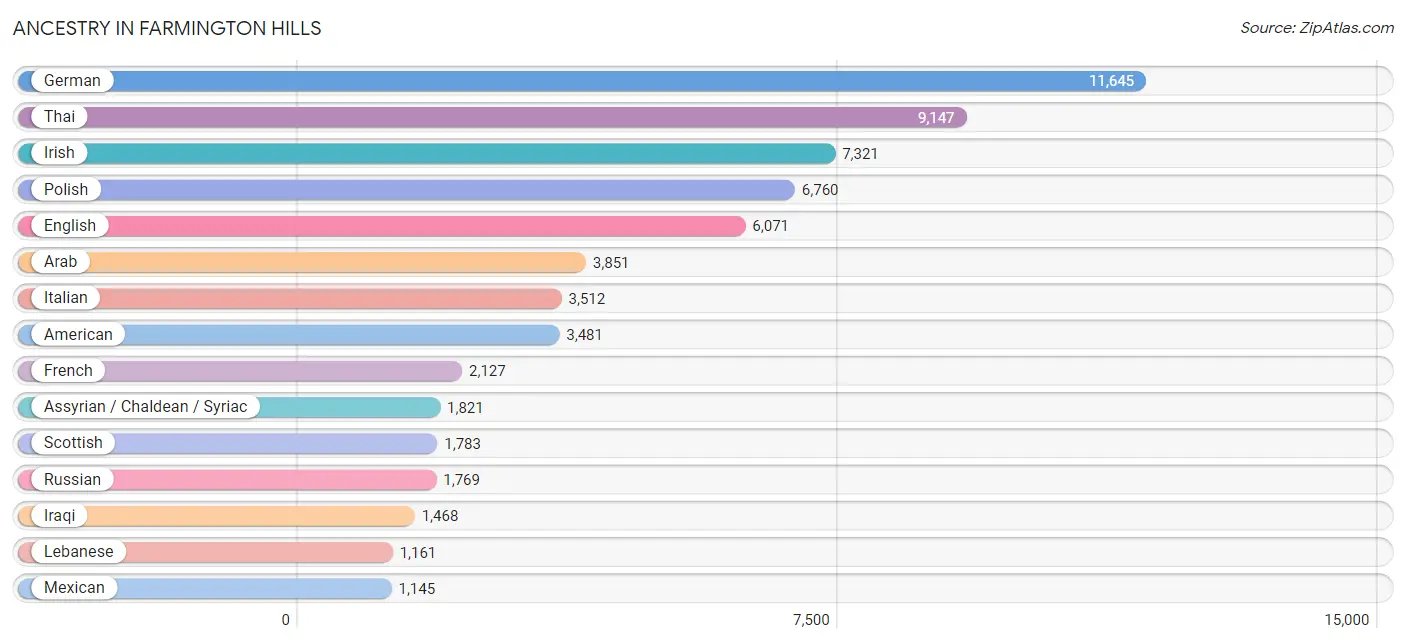
Ancestry in Farmington Hills
The most populous ancestries reported in Farmington Hills are German (11,645 | 13.9%), Thai (9,147 | 11.0%), Irish (7,321 | 8.8%), Polish (6,760 | 8.1%), and English (6,071 | 7.3%), together accounting for 49.0% of all Farmington Hills residents.
| Ancestry | # Population | % Population |
| African | 712 | 0.9% |
| Albanian | 577 | 0.7% |
| American | 3,481 | 4.2% |
| Arab | 3,851 | 4.6% |
| Argentinean | 10 | 0.0% |
| Armenian | 612 | 0.7% |
| Assyrian / Chaldean / Syriac | 1,821 | 2.2% |
| Austrian | 303 | 0.4% |
| Barbadian | 32 | 0.0% |
| Belgian | 276 | 0.3% |
| Belizean | 4 | 0.0% |
| Bhutanese | 956 | 1.1% |
| Blackfeet | 80 | 0.1% |
| Bolivian | 8 | 0.0% |
| Brazilian | 79 | 0.1% |
| British | 342 | 0.4% |
| Bulgarian | 27 | 0.0% |
| Burmese | 869 | 1.0% |
| Canadian | 464 | 0.6% |
| Central American | 106 | 0.1% |
| Cherokee | 107 | 0.1% |
| Chickasaw | 13 | 0.0% |
| Chilean | 44 | 0.1% |
| Chippewa | 33 | 0.0% |
| Choctaw | 32 | 0.0% |
| Colombian | 135 | 0.2% |
| Creek | 9 | 0.0% |
| Croatian | 83 | 0.1% |
| Cuban | 45 | 0.1% |
| Czech | 308 | 0.4% |
| Czechoslovakian | 33 | 0.0% |
| Danish | 224 | 0.3% |
| Dominican | 110 | 0.1% |
| Dutch | 664 | 0.8% |
| Eastern European | 685 | 0.8% |
| Egyptian | 79 | 0.1% |
| English | 6,071 | 7.3% |
| Estonian | 6 | 0.0% |
| Ethiopian | 13 | 0.0% |
| European | 1,073 | 1.3% |
| Filipino | 138 | 0.2% |
| Finnish | 634 | 0.8% |
| French | 2,127 | 2.5% |
| French American Indian | 28 | 0.0% |
| French Canadian | 507 | 0.6% |
| German | 11,645 | 13.9% |
| Ghanaian | 15 | 0.0% |
| Greek | 454 | 0.5% |
| Guatemalan | 91 | 0.1% |
| Haitian | 63 | 0.1% |
| Hungarian | 893 | 1.1% |
| Indian (Asian) | 747 | 0.9% |
| Iranian | 111 | 0.1% |
| Iraqi | 1,468 | 1.8% |
| Irish | 7,321 | 8.8% |
| Iroquois | 10 | 0.0% |
| Israeli | 60 | 0.1% |
| Italian | 3,512 | 4.2% |
| Jamaican | 131 | 0.2% |
| Jordanian | 47 | 0.1% |
| Korean | 735 | 0.9% |
| Laotian | 11 | 0.0% |
| Latvian | 7 | 0.0% |
| Lebanese | 1,161 | 1.4% |
| Lithuanian | 360 | 0.4% |
| Macedonian | 68 | 0.1% |
| Malaysian | 23 | 0.0% |
| Maltese | 385 | 0.5% |
| Mexican | 1,145 | 1.4% |
| Moroccan | 42 | 0.1% |
| Native Hawaiian | 37 | 0.0% |
| Nigerian | 157 | 0.2% |
| Northern European | 59 | 0.1% |
| Norwegian | 269 | 0.3% |
| Ottawa | 36 | 0.0% |
| Pakistani | 13 | 0.0% |
| Palestinian | 171 | 0.2% |
| Panamanian | 7 | 0.0% |
| Pennsylvania German | 23 | 0.0% |
| Peruvian | 38 | 0.1% |
| Polish | 6,760 | 8.1% |
| Portuguese | 39 | 0.1% |
| Potawatomi | 7 | 0.0% |
| Puerto Rican | 94 | 0.1% |
| Romanian | 885 | 1.1% |
| Russian | 1,769 | 2.1% |
| Salvadoran | 8 | 0.0% |
| Scandinavian | 111 | 0.1% |
| Scotch-Irish | 363 | 0.4% |
| Scottish | 1,783 | 2.1% |
| Serbian | 49 | 0.1% |
| Slavic | 118 | 0.1% |
| Slovak | 231 | 0.3% |
| Slovene | 70 | 0.1% |
| South African | 47 | 0.1% |
| South American | 235 | 0.3% |
| Spaniard | 66 | 0.1% |
| Spanish | 33 | 0.0% |
| Sri Lankan | 150 | 0.2% |
| Subsaharan African | 1,081 | 1.3% |
| Sudanese | 11 | 0.0% |
| Swedish | 425 | 0.5% |
| Swiss | 262 | 0.3% |
| Syrian | 73 | 0.1% |
| Thai | 9,147 | 11.0% |
| Trinidadian and Tobagonian | 101 | 0.1% |
| Turkish | 24 | 0.0% |
| Ugandan | 37 | 0.0% |
| Ukrainian | 377 | 0.4% |
| Vietnamese | 124 | 0.2% |
| Welsh | 412 | 0.5% |
| West Indian | 47 | 0.1% |
| Yugoslavian | 87 | 0.1% | View All 113 Rows |
Immigrants in Farmington Hills
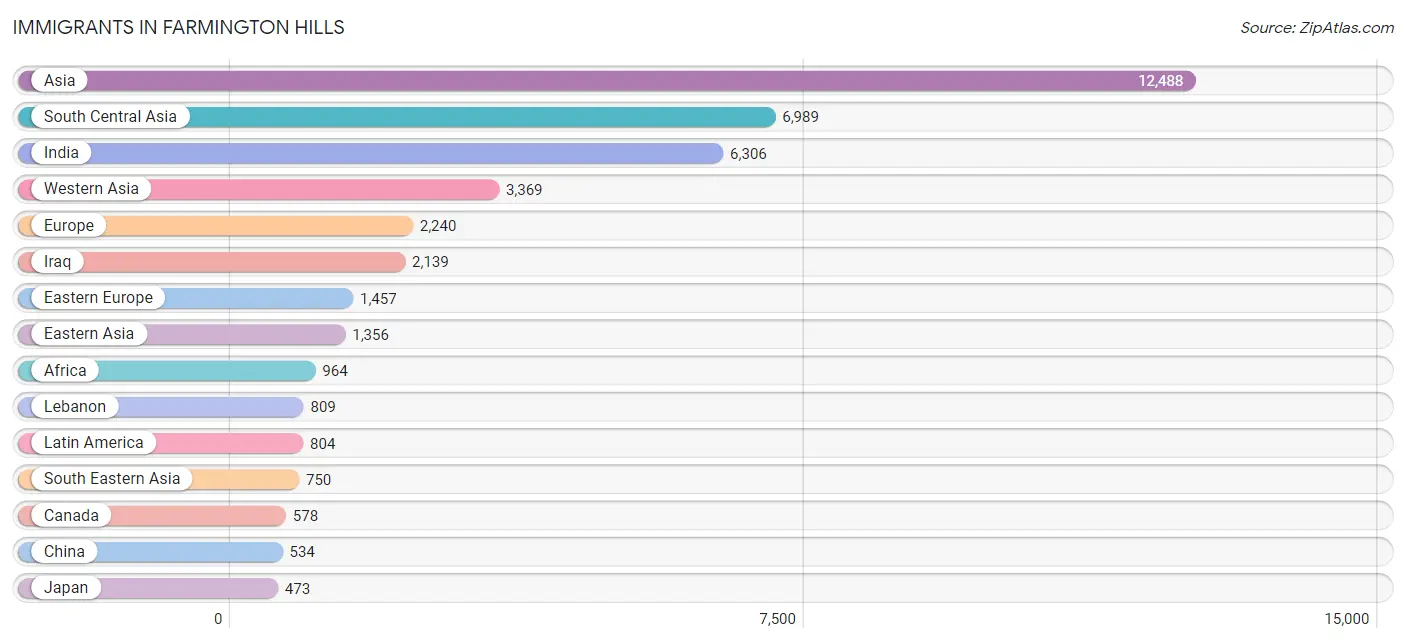
The most numerous immigrant groups reported in Farmington Hills came from Asia (12,488 | 14.9%), South Central Asia (6,989 | 8.4%), India (6,306 | 7.5%), Western Asia (3,369 | 4.0%), and Europe (2,240 | 2.7%), together accounting for 37.6% of all Farmington Hills residents.
| Immigration Origin | # Population | % Population |
| Africa | 964 | 1.1% |
| Albania | 164 | 0.2% |
| Armenia | 26 | 0.0% |
| Asia | 12,488 | 14.9% |
| Australia | 24 | 0.0% |
| Austria | 8 | 0.0% |
| Bahamas | 1 | 0.0% |
| Bangladesh | 87 | 0.1% |
| Barbados | 18 | 0.0% |
| Belarus | 10 | 0.0% |
| Belgium | 7 | 0.0% |
| Belize | 4 | 0.0% |
| Bosnia and Herzegovina | 35 | 0.0% |
| Brazil | 54 | 0.1% |
| Canada | 578 | 0.7% |
| Caribbean | 178 | 0.2% |
| Central America | 459 | 0.5% |
| Chile | 15 | 0.0% |
| China | 534 | 0.6% |
| Colombia | 77 | 0.1% |
| Czechoslovakia | 69 | 0.1% |
| Dominican Republic | 12 | 0.0% |
| Eastern Africa | 187 | 0.2% |
| Eastern Asia | 1,356 | 1.6% |
| Eastern Europe | 1,457 | 1.7% |
| Egypt | 244 | 0.3% |
| El Salvador | 8 | 0.0% |
| England | 222 | 0.3% |
| Europe | 2,240 | 2.7% |
| France | 52 | 0.1% |
| Germany | 261 | 0.3% |
| Ghana | 157 | 0.2% |
| Greece | 24 | 0.0% |
| Guatemala | 18 | 0.0% |
| Haiti | 45 | 0.1% |
| Hong Kong | 27 | 0.0% |
| Hungary | 21 | 0.0% |
| India | 6,306 | 7.5% |
| Indonesia | 11 | 0.0% |
| Iran | 142 | 0.2% |
| Iraq | 2,139 | 2.6% |
| Ireland | 7 | 0.0% |
| Israel | 85 | 0.1% |
| Italy | 28 | 0.0% |
| Jamaica | 73 | 0.1% |
| Japan | 473 | 0.6% |
| Jordan | 52 | 0.1% |
| Kazakhstan | 31 | 0.0% |
| Kenya | 10 | 0.0% |
| Korea | 349 | 0.4% |
| Kuwait | 51 | 0.1% |
| Latin America | 804 | 1.0% |
| Lebanon | 809 | 1.0% |
| Lithuania | 20 | 0.0% |
| Malaysia | 10 | 0.0% |
| Mexico | 429 | 0.5% |
| Morocco | 53 | 0.1% |
| Nigeria | 165 | 0.2% |
| North Macedonia | 20 | 0.0% |
| Northern Africa | 322 | 0.4% |
| Northern Europe | 378 | 0.4% |
| Oceania | 30 | 0.0% |
| Pakistan | 246 | 0.3% |
| Peru | 21 | 0.0% |
| Philippines | 411 | 0.5% |
| Poland | 163 | 0.2% |
| Portugal | 8 | 0.0% |
| Romania | 321 | 0.4% |
| Russia | 325 | 0.4% |
| Saudi Arabia | 93 | 0.1% |
| Scotland | 60 | 0.1% |
| Serbia | 39 | 0.1% |
| South Africa | 68 | 0.1% |
| South America | 167 | 0.2% |
| South Central Asia | 6,989 | 8.4% |
| South Eastern Asia | 750 | 0.9% |
| Southern Europe | 70 | 0.1% |
| Sri Lanka | 154 | 0.2% |
| Switzerland | 7 | 0.0% |
| Syria | 57 | 0.1% |
| Taiwan | 198 | 0.2% |
| Trinidad and Tobago | 25 | 0.0% |
| Turkey | 17 | 0.0% |
| Uganda | 42 | 0.1% |
| Ukraine | 105 | 0.1% |
| Uzbekistan | 18 | 0.0% |
| Vietnam | 135 | 0.2% |
| Western Africa | 322 | 0.4% |
| Western Asia | 3,369 | 4.0% |
| Western Europe | 335 | 0.4% |
| Yemen | 4 | 0.0% |
| Zimbabwe | 19 | 0.0% | View All 92 Rows |
Sex and Age in Farmington Hills
Sex and Age in Farmington Hills
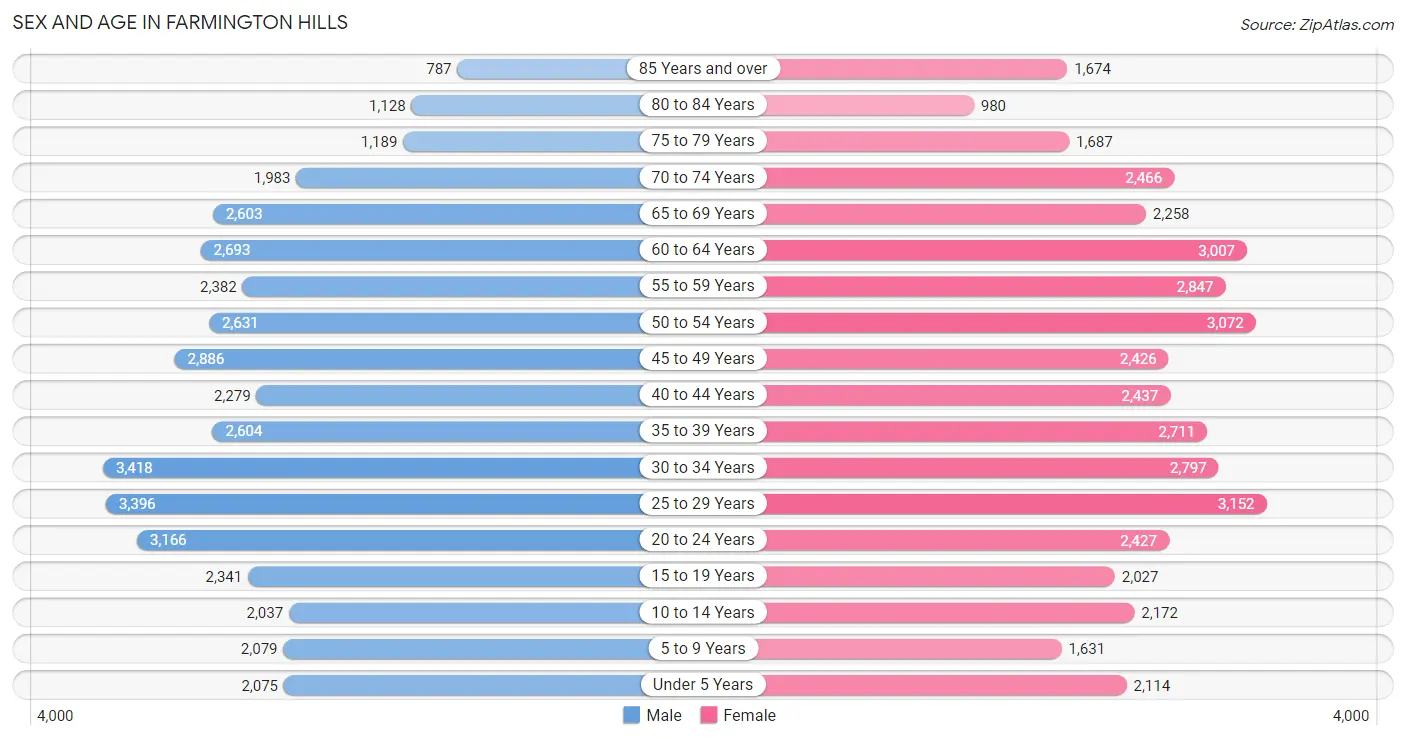
The most populous age groups in Farmington Hills are 30 to 34 Years (3,418 | 8.2%) for men and 25 to 29 Years (3,152 | 7.5%) for women.
| Age Bracket | Male | Female |
| Under 5 Years | 2,075 (5.0%) | 2,114 (5.1%) |
| 5 to 9 Years | 2,079 (5.0%) | 1,631 (3.9%) |
| 10 to 14 Years | 2,037 (4.9%) | 2,172 (5.2%) |
| 15 to 19 Years | 2,341 (5.6%) | 2,027 (4.8%) |
| 20 to 24 Years | 3,166 (7.6%) | 2,427 (5.8%) |
| 25 to 29 Years | 3,396 (8.2%) | 3,152 (7.5%) |
| 30 to 34 Years | 3,418 (8.2%) | 2,797 (6.7%) |
| 35 to 39 Years | 2,604 (6.2%) | 2,711 (6.5%) |
| 40 to 44 Years | 2,279 (5.5%) | 2,437 (5.8%) |
| 45 to 49 Years | 2,886 (6.9%) | 2,426 (5.8%) |
| 50 to 54 Years | 2,631 (6.3%) | 3,072 (7.3%) |
| 55 to 59 Years | 2,382 (5.7%) | 2,847 (6.8%) |
| 60 to 64 Years | 2,693 (6.5%) | 3,007 (7.2%) |
| 65 to 69 Years | 2,603 (6.2%) | 2,258 (5.4%) |
| 70 to 74 Years | 1,983 (4.8%) | 2,466 (5.9%) |
| 75 to 79 Years | 1,189 (2.9%) | 1,687 (4.0%) |
| 80 to 84 Years | 1,128 (2.7%) | 980 (2.3%) |
| 85 Years and over | 787 (1.9%) | 1,674 (4.0%) |
| Total | 41,677 (100.0%) | 41,885 (100.0%) |
Families and Households in Farmington Hills
Median Family Size in Farmington Hills
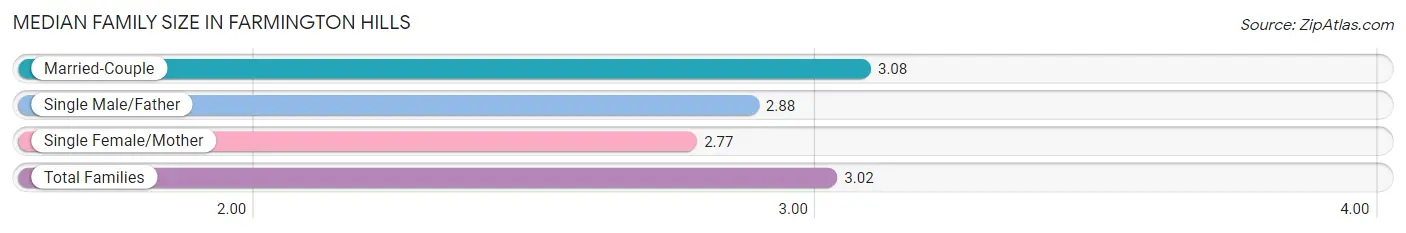
The median family size in Farmington Hills is 3.02 persons per family, with married-couple families (17,296 | 80.1%) accounting for the largest median family size of 3.08 persons per family. On the other hand, single female/mother families (3,010 | 13.9%) represent the smallest median family size with 2.77 persons per family.
| Family Type | # Families | Family Size |
| Married-Couple | 17,296 (80.1%) | 3.08 |
| Single Male/Father | 1,284 (5.9%) | 2.88 |
| Single Female/Mother | 3,010 (13.9%) | 2.77 |
| Total Families | 21,590 (100.0%) | 3.02 |
Median Household Size in Farmington Hills
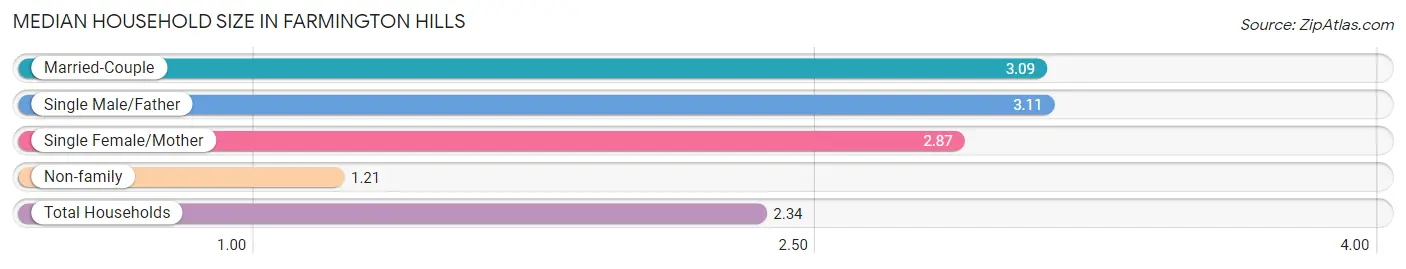
The median household size in Farmington Hills is 2.34 persons per household, with single male/father households (1,284 | 3.6%) accounting for the largest median household size of 3.11 persons per household. non-family households (13,776 | 39.0%) represent the smallest median household size with 1.21 persons per household.
| Household Type | # Households | Household Size |
| Married-Couple | 17,296 (48.9%) | 3.09 |
| Single Male/Father | 1,284 (3.6%) | 3.11 |
| Single Female/Mother | 3,010 (8.5%) | 2.87 |
| Non-family | 13,776 (39.0%) | 1.21 |
| Total Households | 35,366 (100.0%) | 2.34 |
Household Size by Marriage Status in Farmington Hills
Out of a total of 35,366 households in Farmington Hills, 21,590 (61.1%) are family households, while 13,776 (39.0%) are nonfamily households. The most numerous type of family households are 2-person households, comprising 9,651, and the most common type of nonfamily households are 1-person households, comprising 11,571.
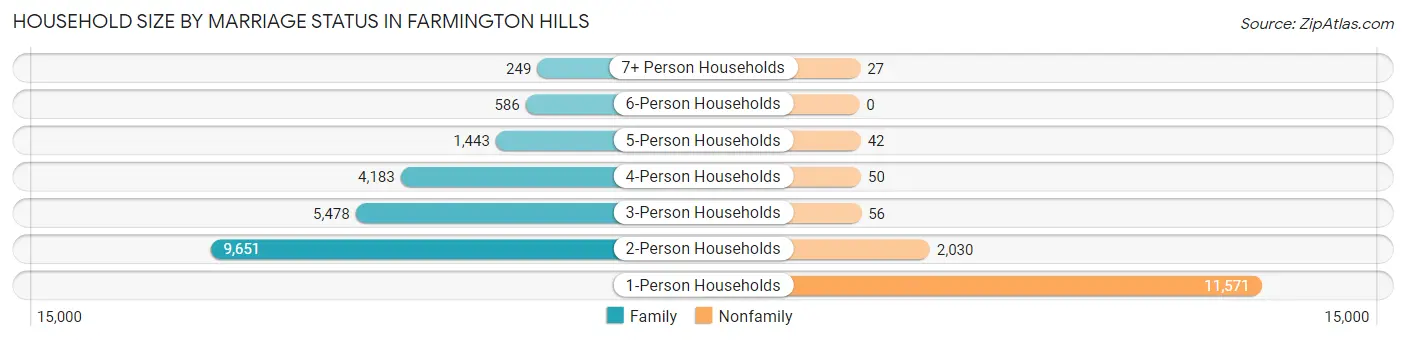
| Household Size | Family Households | Nonfamily Households |
| 1-Person Households | - | 11,571 (32.7%) |
| 2-Person Households | 9,651 (27.3%) | 2,030 (5.7%) |
| 3-Person Households | 5,478 (15.5%) | 56 (0.2%) |
| 4-Person Households | 4,183 (11.8%) | 50 (0.1%) |
| 5-Person Households | 1,443 (4.1%) | 42 (0.1%) |
| 6-Person Households | 586 (1.7%) | 0 (0.0%) |
| 7+ Person Households | 249 (0.7%) | 27 (0.1%) |
| Total | 21,590 (61.1%) | 13,776 (39.0%) |
Female Fertility in Farmington Hills
Fertility by Age in Farmington Hills
Average fertility rate in Farmington Hills is 59.0 births per 1,000 women. Women in the age bracket of 20 to 34 years have the highest fertility rate with 83.0 births per 1,000 women. Women in the age bracket of 20 to 34 years acount for 63.2% of all women with births.
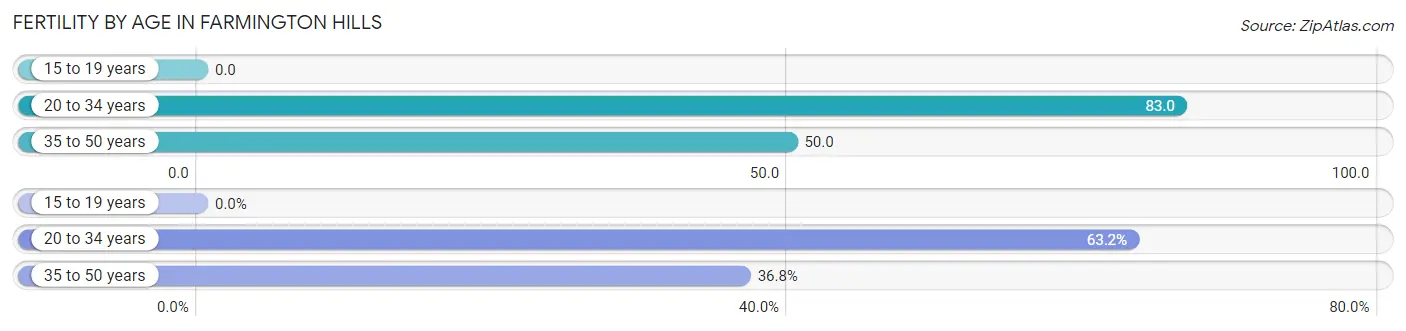
| Age Bracket | Women with Births | Births / 1,000 Women |
| 15 to 19 years | 0 (0.0%) | 0.0 |
| 20 to 34 years | 693 (63.2%) | 83.0 |
| 35 to 50 years | 404 (36.8%) | 50.0 |
| Total | 1,097 (100.0%) | 59.0 |
Fertility by Age by Marriage Status in Farmington Hills
83.6% of women with births (1,097) in Farmington Hills are married. The highest percentage of unmarried women with births falls into 35 to 50 years age bracket with 37.1% of them unmarried at the time of birth, while the lowest percentage of unmarried women with births belong to 20 to 34 years age bracket with 4.3% of them unmarried.
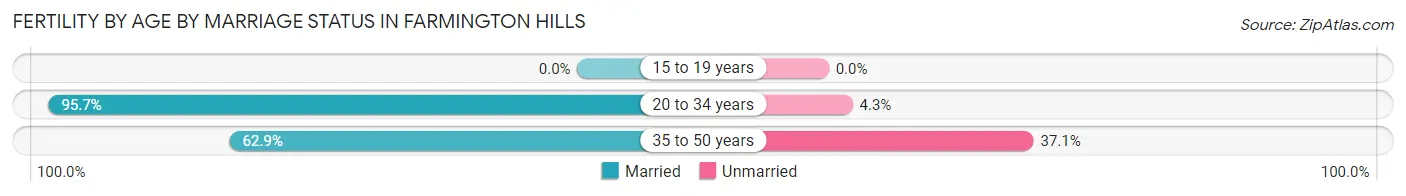
| Age Bracket | Married | Unmarried |
| 15 to 19 years | 0 (0.0%) | 0 (0.0%) |
| 20 to 34 years | 663 (95.7%) | 30 (4.3%) |
| 35 to 50 years | 254 (62.9%) | 150 (37.1%) |
| Total | 917 (83.6%) | 180 (16.4%) |
Fertility by Education in Farmington Hills
Average fertility rate in Farmington Hills is 59.0 births per 1,000 women. Women with the education attainment of graduate degree have the highest fertility rate of 124.0 births per 1,000 women, while women with the education attainment of college or associate's degree have the lowest fertility at 13.0 births per 1,000 women. Women with the education attainment of graduate degree represent 46.9% of all women with births.
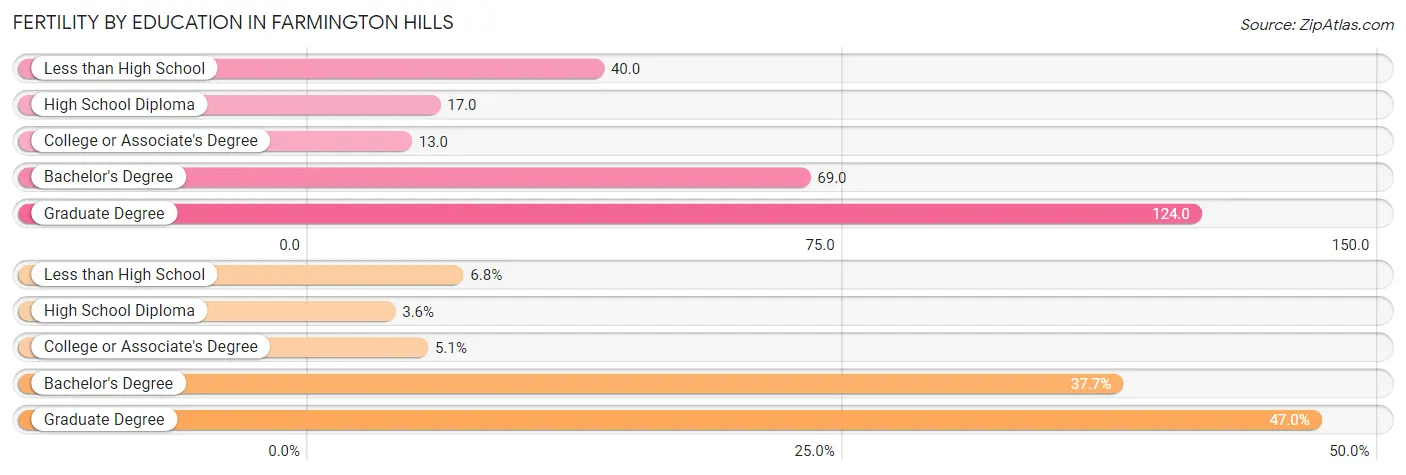
| Educational Attainment | Women with Births | Births / 1,000 Women |
| Less than High School | 74 (6.8%) | 40.0 |
| High School Diploma | 39 (3.6%) | 17.0 |
| College or Associate's Degree | 56 (5.1%) | 13.0 |
| Bachelor's Degree | 413 (37.7%) | 69.0 |
| Graduate Degree | 515 (46.9%) | 124.0 |
| Total | 1,097 (100.0%) | 59.0 |
Fertility by Education by Marriage Status in Farmington Hills
16.4% of women with births in Farmington Hills are unmarried. Women with the educational attainment of college or associate's degree are most likely to be married with 100.0% of them married at childbirth, while women with the educational attainment of less than high school are least likely to be married with 81.1% of them unmarried at childbirth.
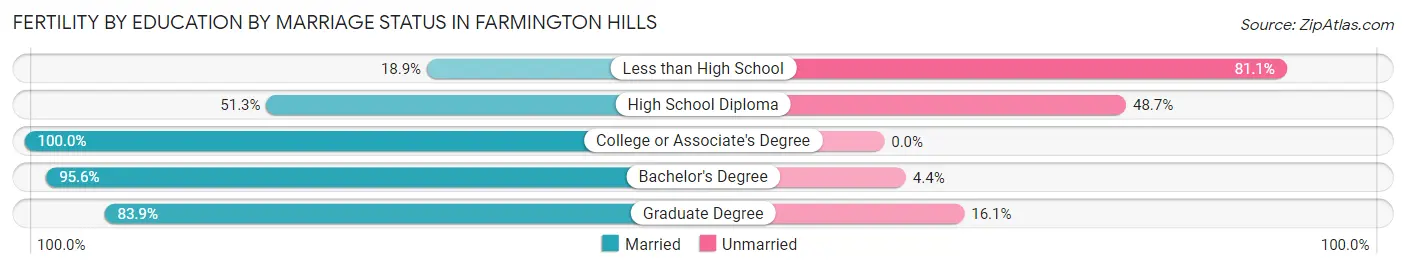
| Educational Attainment | Married | Unmarried |
| Less than High School | 14 (18.9%) | 60 (81.1%) |
| High School Diploma | 20 (51.3%) | 19 (48.7%) |
| College or Associate's Degree | 56 (100.0%) | 0 (0.0%) |
| Bachelor's Degree | 395 (95.6%) | 18 (4.4%) |
| Graduate Degree | 432 (83.9%) | 83 (16.1%) |
| Total | 917 (83.6%) | 180 (16.4%) |
Employment Characteristics in Farmington Hills
Employment by Class of Employer in Farmington Hills
Among the 44,482 employed individuals in Farmington Hills, private company employees (33,039 | 74.3%), not-for-profit organizations (4,251 | 9.6%), and self-employed (incorporated) (2,060 | 4.6%) make up the most common classes of employment.
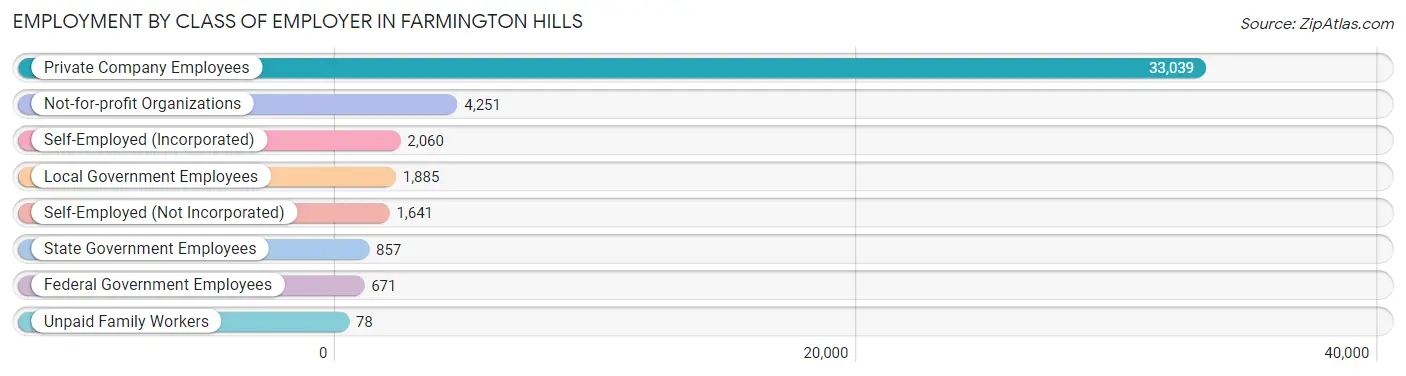
| Employer Class | # Employees | % Employees |
| Private Company Employees | 33,039 | 74.3% |
| Self-Employed (Incorporated) | 2,060 | 4.6% |
| Self-Employed (Not Incorporated) | 1,641 | 3.7% |
| Not-for-profit Organizations | 4,251 | 9.6% |
| Local Government Employees | 1,885 | 4.2% |
| State Government Employees | 857 | 1.9% |
| Federal Government Employees | 671 | 1.5% |
| Unpaid Family Workers | 78 | 0.2% |
| Total | 44,482 | 100.0% |
Employment Status by Age in Farmington Hills
According to the labor force statistics for Farmington Hills, out of the total population over 16 years of age (70,694), 67.2% or 47,506 individuals are in the labor force, with 4.8% or 2,280 of them unemployed. The age group with the highest labor force participation rate is 25 to 29 years, with 89.8% or 5,880 individuals in the labor force. Within the labor force, the 20 to 24 years age range has the highest percentage of unemployed individuals, with 16.7% or 799 of them being unemployed.
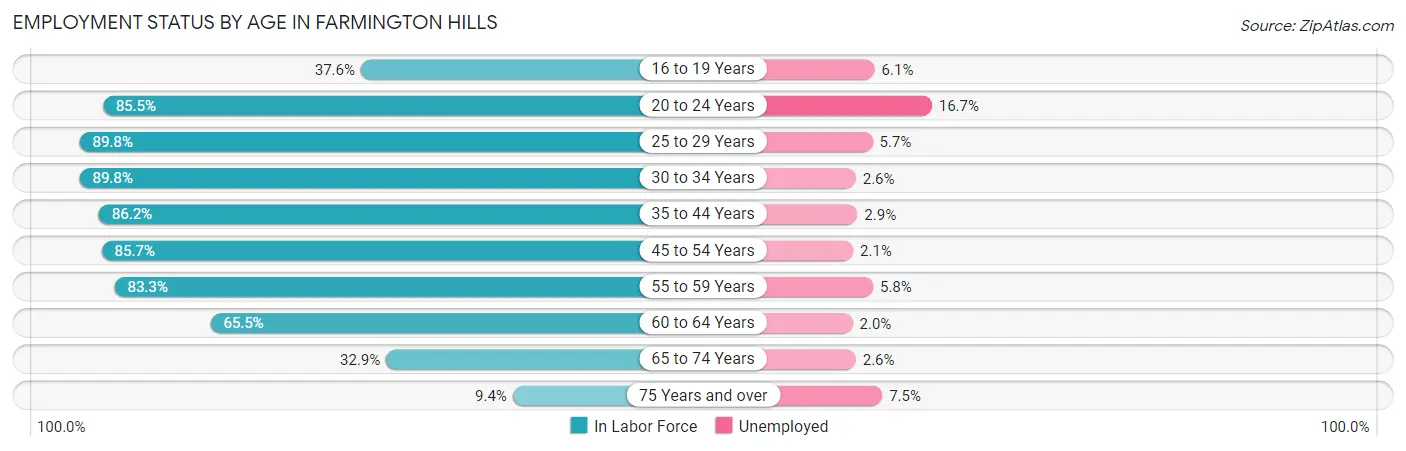
| Age Bracket | In Labor Force | Unemployed |
| 16 to 19 Years | 1,357 (37.6%) | 83 (6.1%) |
| 20 to 24 Years | 4,782 (85.5%) | 799 (16.7%) |
| 25 to 29 Years | 5,880 (89.8%) | 335 (5.7%) |
| 30 to 34 Years | 5,581 (89.8%) | 145 (2.6%) |
| 35 to 44 Years | 8,647 (86.2%) | 251 (2.9%) |
| 45 to 54 Years | 9,440 (85.7%) | 198 (2.1%) |
| 55 to 59 Years | 4,356 (83.3%) | 253 (5.8%) |
| 60 to 64 Years | 3,734 (65.5%) | 75 (2.0%) |
| 65 to 74 Years | 3,063 (32.9%) | 80 (2.6%) |
| 75 Years and over | 700 (9.4%) | 52 (7.5%) |
| Total | 47,506 (67.2%) | 2,280 (4.8%) |
Employment Status by Educational Attainment in Farmington Hills
According to labor force statistics for Farmington Hills, 84.1% of individuals (37,625) out of the total population between 25 and 64 years of age (44,738) are in the labor force, with 3.3% or 1,242 of them being unemployed. The group with the highest labor force participation rate are those with the educational attainment of bachelor's degree or higher, with 87.1% or 24,099 individuals in the labor force. Within the labor force, individuals with less than high school education have the highest percentage of unemployment, with 7.3% or 81 of them being unemployed.
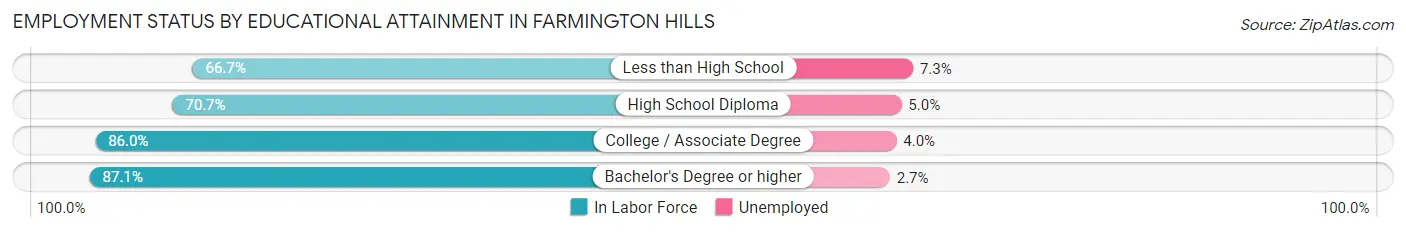
| Educational Attainment | In Labor Force | Unemployed |
| Less than High School | 1,105 (66.7%) | 121 (7.3%) |
| High School Diploma | 3,875 (70.7%) | 274 (5.0%) |
| College / Associate Degree | 8,542 (86.0%) | 397 (4.0%) |
| Bachelor's Degree or higher | 24,099 (87.1%) | 747 (2.7%) |
| Total | 37,625 (84.1%) | 1,476 (3.3%) |
Employment Occupations by Sex in Farmington Hills
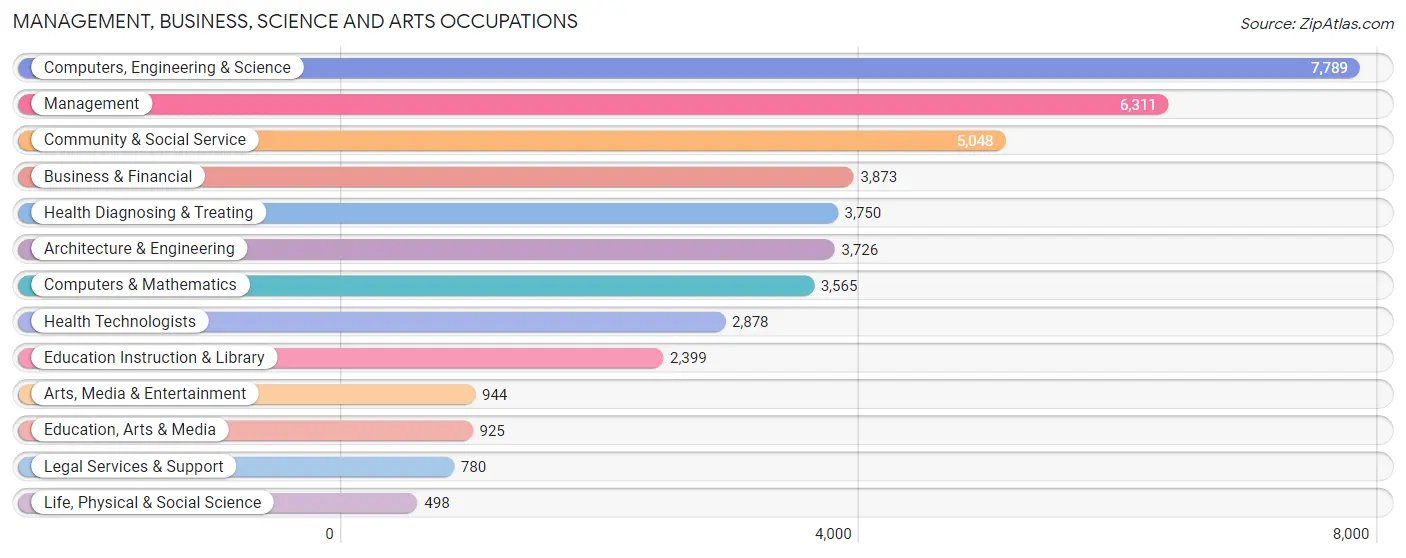
Management, Business, Science and Arts Occupations
The most common Management, Business, Science and Arts occupations in Farmington Hills are Computers, Engineering & Science (7,789 | 17.2%), Management (6,311 | 14.0%), Community & Social Service (5,048 | 11.2%), Business & Financial (3,873 | 8.6%), and Health Diagnosing & Treating (3,750 | 8.3%).
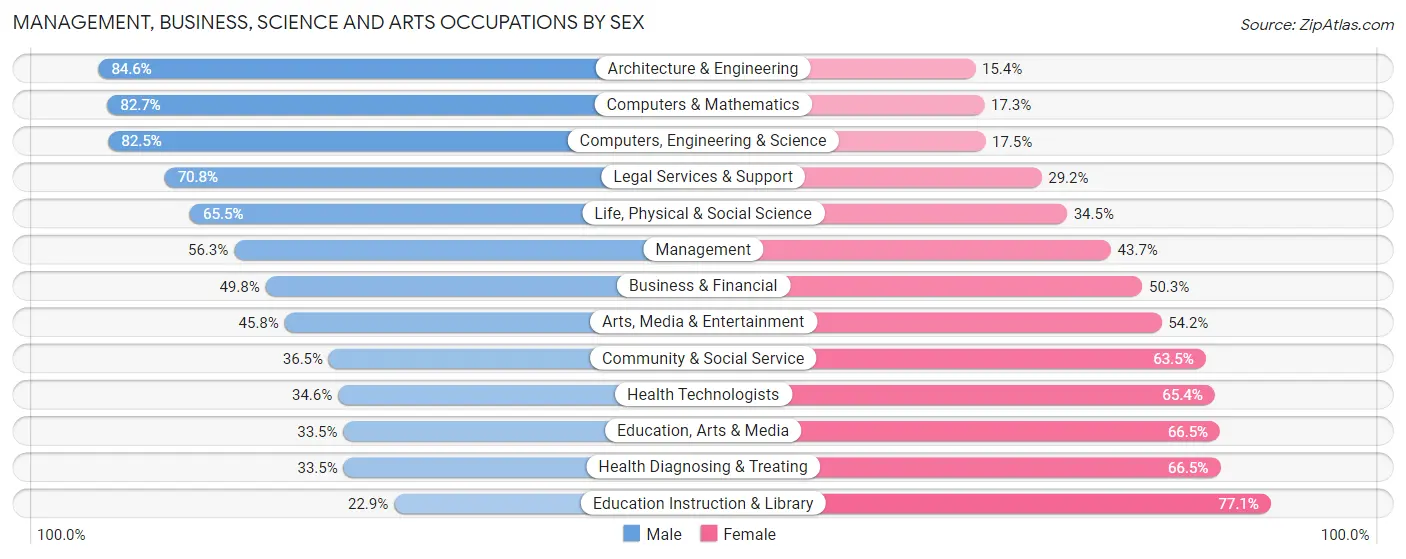
Management, Business, Science and Arts Occupations by Sex
Within the Management, Business, Science and Arts occupations in Farmington Hills, the most male-oriented occupations are Architecture & Engineering (84.6%), Computers & Mathematics (82.7%), and Computers, Engineering & Science (82.5%), while the most female-oriented occupations are Education Instruction & Library (77.1%), Health Diagnosing & Treating (66.5%), and Education, Arts & Media (66.5%).
| Occupation | Male | Female |
| Management | 3,553 (56.3%) | 2,758 (43.7%) |
| Business & Financial | 1,927 (49.7%) | 1,946 (50.2%) |
| Computers, Engineering & Science | 6,427 (82.5%) | 1,362 (17.5%) |
| Computers & Mathematics | 2,949 (82.7%) | 616 (17.3%) |
| Architecture & Engineering | 3,152 (84.6%) | 574 (15.4%) |
| Life, Physical & Social Science | 326 (65.5%) | 172 (34.5%) |
| Community & Social Service | 1,844 (36.5%) | 3,204 (63.5%) |
| Education, Arts & Media | 310 (33.5%) | 615 (66.5%) |
| Legal Services & Support | 552 (70.8%) | 228 (29.2%) |
| Education Instruction & Library | 550 (22.9%) | 1,849 (77.1%) |
| Arts, Media & Entertainment | 432 (45.8%) | 512 (54.2%) |
| Health Diagnosing & Treating | 1,255 (33.5%) | 2,495 (66.5%) |
| Health Technologists | 996 (34.6%) | 1,882 (65.4%) |
| Total (Category) | 15,006 (56.0%) | 11,765 (44.0%) |
| Total (Overall) | 25,246 (55.8%) | 19,995 (44.2%) |
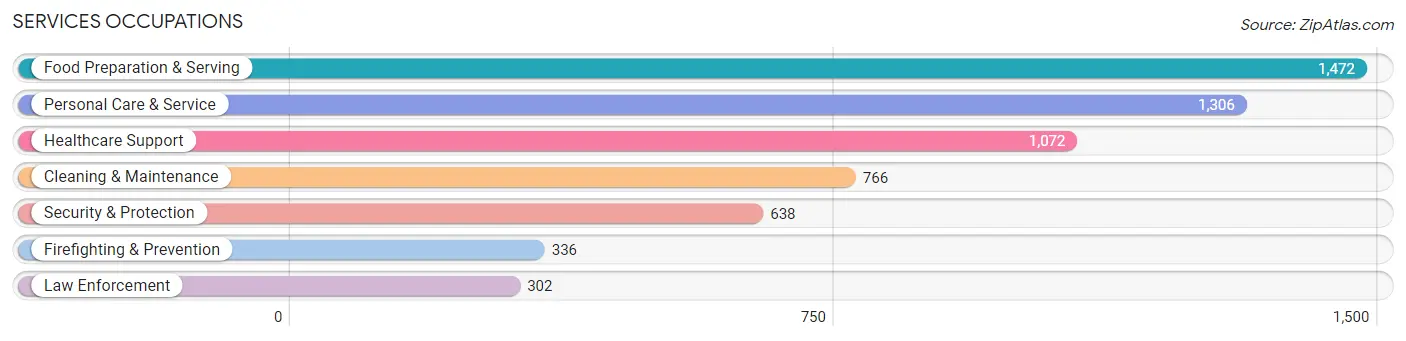
Services Occupations
The most common Services occupations in Farmington Hills are Food Preparation & Serving (1,472 | 3.3%), Personal Care & Service (1,306 | 2.9%), Healthcare Support (1,072 | 2.4%), Cleaning & Maintenance (766 | 1.7%), and Security & Protection (638 | 1.4%).
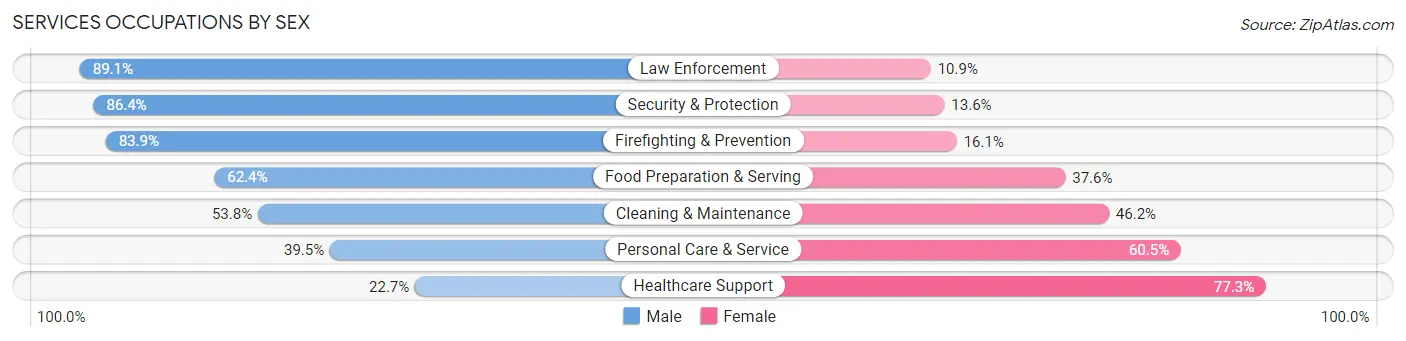
Services Occupations by Sex
Within the Services occupations in Farmington Hills, the most male-oriented occupations are Law Enforcement (89.1%), Security & Protection (86.4%), and Firefighting & Prevention (83.9%), while the most female-oriented occupations are Healthcare Support (77.3%), Personal Care & Service (60.5%), and Cleaning & Maintenance (46.2%).
| Occupation | Male | Female |
| Healthcare Support | 243 (22.7%) | 829 (77.3%) |
| Security & Protection | 551 (86.4%) | 87 (13.6%) |
| Firefighting & Prevention | 282 (83.9%) | 54 (16.1%) |
| Law Enforcement | 269 (89.1%) | 33 (10.9%) |
| Food Preparation & Serving | 919 (62.4%) | 553 (37.6%) |
| Cleaning & Maintenance | 412 (53.8%) | 354 (46.2%) |
| Personal Care & Service | 516 (39.5%) | 790 (60.5%) |
| Total (Category) | 2,641 (50.3%) | 2,613 (49.7%) |
| Total (Overall) | 25,246 (55.8%) | 19,995 (44.2%) |
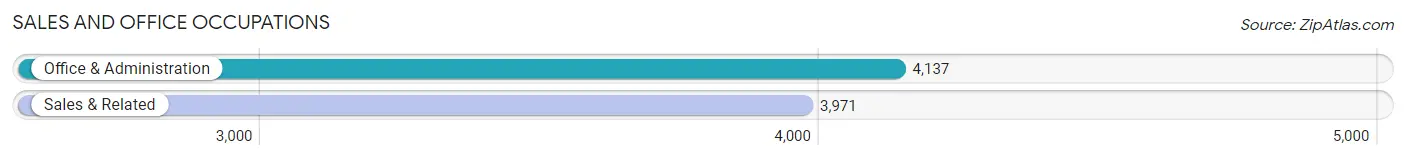
Sales and Office Occupations
The most common Sales and Office occupations in Farmington Hills are Office & Administration (4,137 | 9.1%), and Sales & Related (3,971 | 8.8%).
Sales and Office Occupations by Sex
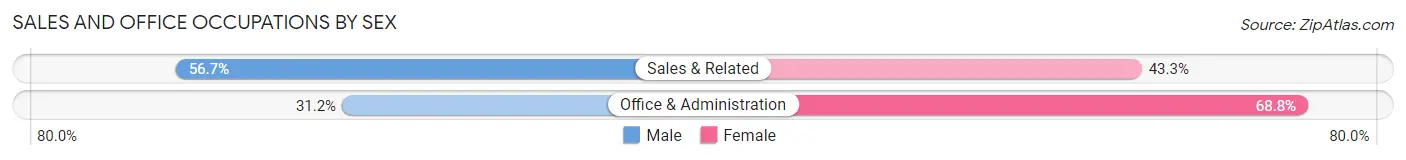
| Occupation | Male | Female |
| Sales & Related | 2,253 (56.7%) | 1,718 (43.3%) |
| Office & Administration | 1,290 (31.2%) | 2,847 (68.8%) |
| Total (Category) | 3,543 (43.7%) | 4,565 (56.3%) |
| Total (Overall) | 25,246 (55.8%) | 19,995 (44.2%) |
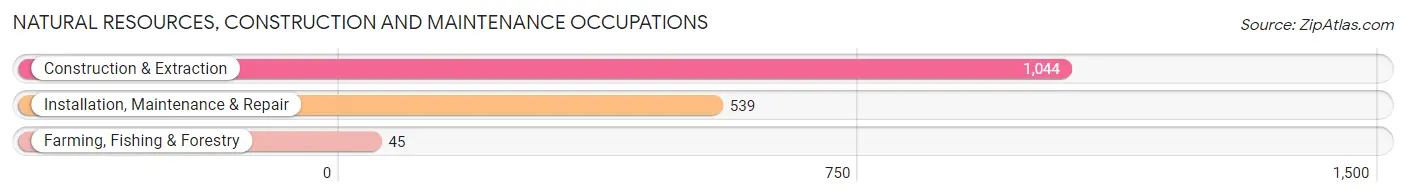
Natural Resources, Construction and Maintenance Occupations
The most common Natural Resources, Construction and Maintenance occupations in Farmington Hills are Construction & Extraction (1,044 | 2.3%), Installation, Maintenance & Repair (539 | 1.2%), and Farming, Fishing & Forestry (45 | 0.1%).
Natural Resources, Construction and Maintenance Occupations by Sex
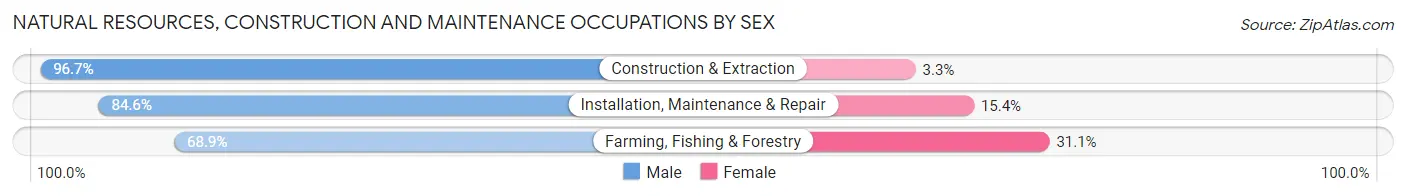
| Occupation | Male | Female |
| Farming, Fishing & Forestry | 31 (68.9%) | 14 (31.1%) |
| Construction & Extraction | 1,010 (96.7%) | 34 (3.3%) |
| Installation, Maintenance & Repair | 456 (84.6%) | 83 (15.4%) |
| Total (Category) | 1,497 (91.9%) | 131 (8.1%) |
| Total (Overall) | 25,246 (55.8%) | 19,995 (44.2%) |
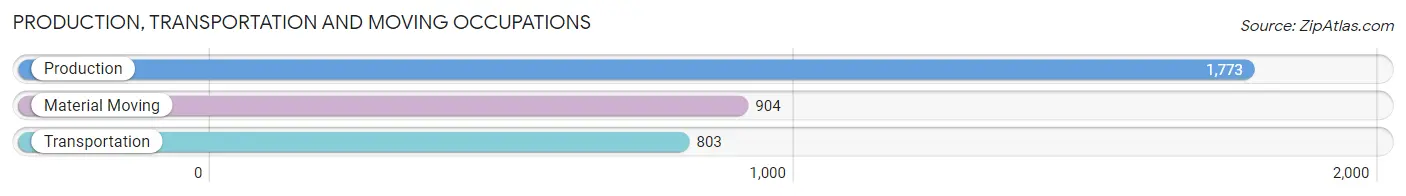
Production, Transportation and Moving Occupations
The most common Production, Transportation and Moving occupations in Farmington Hills are Production (1,773 | 3.9%), Material Moving (904 | 2.0%), and Transportation (803 | 1.8%).
Production, Transportation and Moving Occupations by Sex
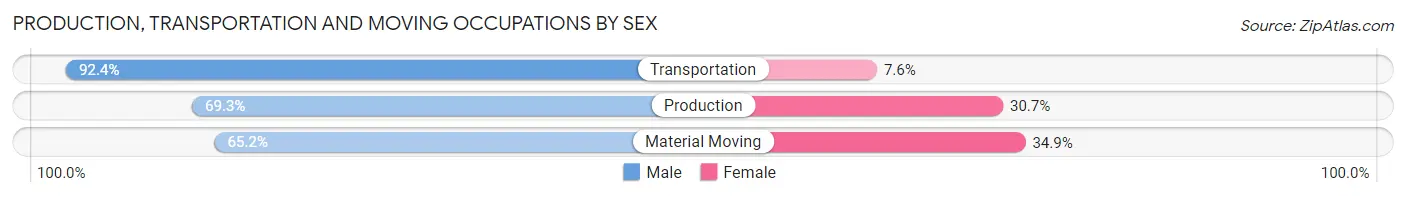
| Occupation | Male | Female |
| Production | 1,228 (69.3%) | 545 (30.7%) |
| Transportation | 742 (92.4%) | 61 (7.6%) |
| Material Moving | 589 (65.1%) | 315 (34.8%) |
| Total (Category) | 2,559 (73.5%) | 921 (26.5%) |
| Total (Overall) | 25,246 (55.8%) | 19,995 (44.2%) |
Employment Industries by Sex in Farmington Hills
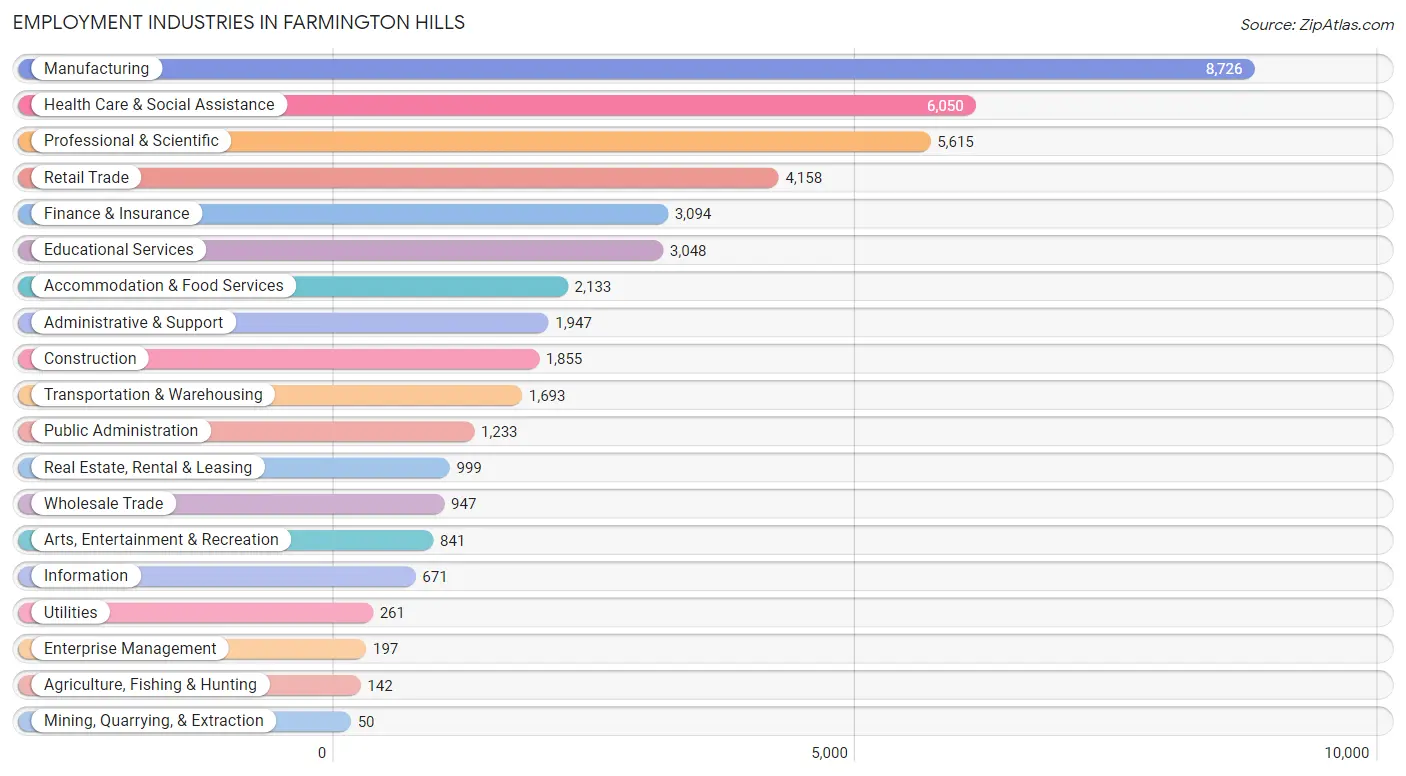
Employment Industries in Farmington Hills
The major employment industries in Farmington Hills include Manufacturing (8,726 | 19.3%), Health Care & Social Assistance (6,050 | 13.4%), Professional & Scientific (5,615 | 12.4%), Retail Trade (4,158 | 9.2%), and Finance & Insurance (3,094 | 6.8%).
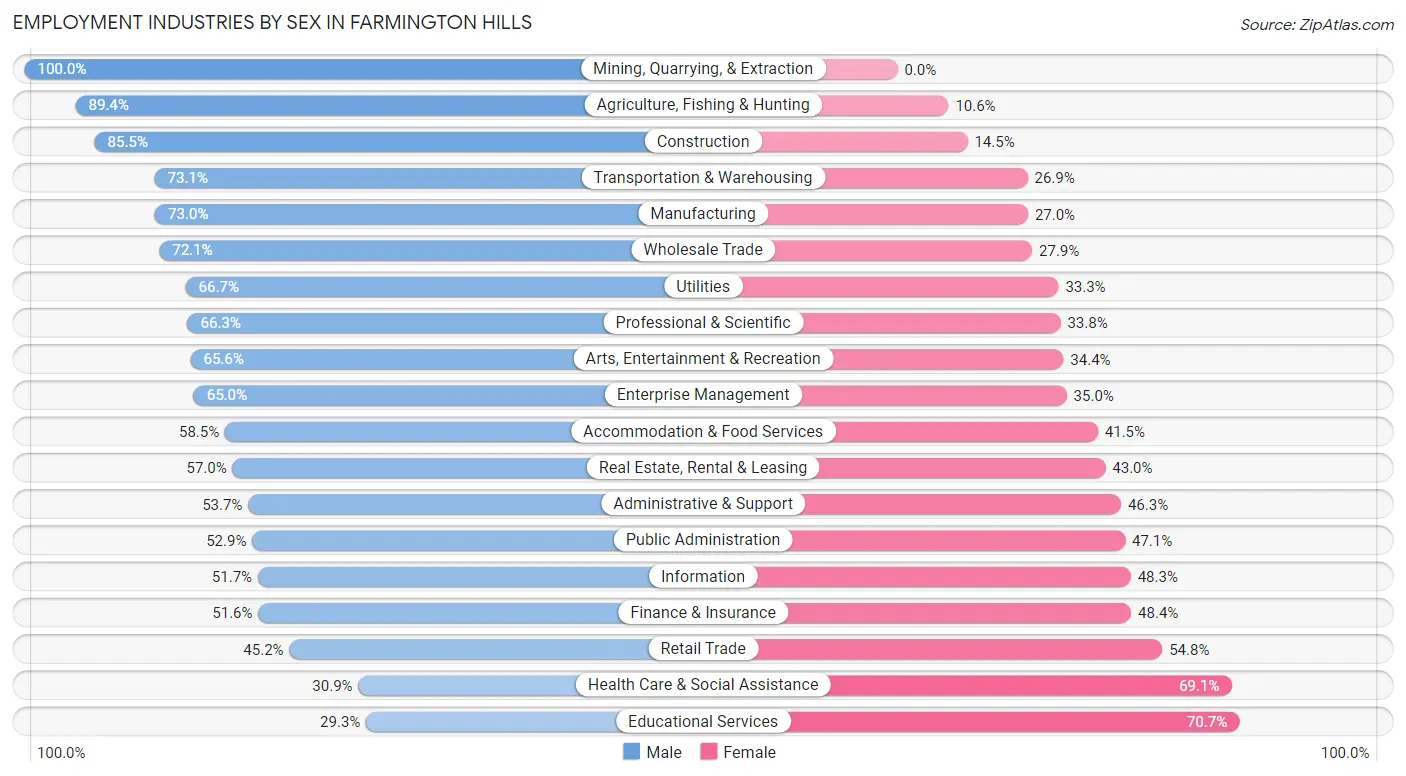
Employment Industries by Sex in Farmington Hills
The Farmington Hills industries that see more men than women are Mining, Quarrying, & Extraction (100.0%), Agriculture, Fishing & Hunting (89.4%), and Construction (85.5%), whereas the industries that tend to have a higher number of women are Educational Services (70.7%), Health Care & Social Assistance (69.1%), and Retail Trade (54.8%).
| Industry | Male | Female |
| Agriculture, Fishing & Hunting | 127 (89.4%) | 15 (10.6%) |
| Mining, Quarrying, & Extraction | 50 (100.0%) | 0 (0.0%) |
| Construction | 1,586 (85.5%) | 269 (14.5%) |
| Manufacturing | 6,368 (73.0%) | 2,358 (27.0%) |
| Wholesale Trade | 683 (72.1%) | 264 (27.9%) |
| Retail Trade | 1,879 (45.2%) | 2,279 (54.8%) |
| Transportation & Warehousing | 1,237 (73.1%) | 456 (26.9%) |
| Utilities | 174 (66.7%) | 87 (33.3%) |
| Information | 347 (51.7%) | 324 (48.3%) |
| Finance & Insurance | 1,597 (51.6%) | 1,497 (48.4%) |
| Real Estate, Rental & Leasing | 569 (57.0%) | 430 (43.0%) |
| Professional & Scientific | 3,720 (66.2%) | 1,895 (33.8%) |
| Enterprise Management | 128 (65.0%) | 69 (35.0%) |
| Administrative & Support | 1,046 (53.7%) | 901 (46.3%) |
| Educational Services | 893 (29.3%) | 2,155 (70.7%) |
| Health Care & Social Assistance | 1,870 (30.9%) | 4,180 (69.1%) |
| Arts, Entertainment & Recreation | 552 (65.6%) | 289 (34.4%) |
| Accommodation & Food Services | 1,248 (58.5%) | 885 (41.5%) |
| Public Administration | 652 (52.9%) | 581 (47.1%) |
| Total | 25,246 (55.8%) | 19,995 (44.2%) |
Education in Farmington Hills
School Enrollment in Farmington Hills
The most common levels of schooling among the 18,073 students in Farmington Hills are college / undergraduate (4,203 | 23.3%), high school (3,612 | 20.0%), and middle school (3,173 | 17.6%).
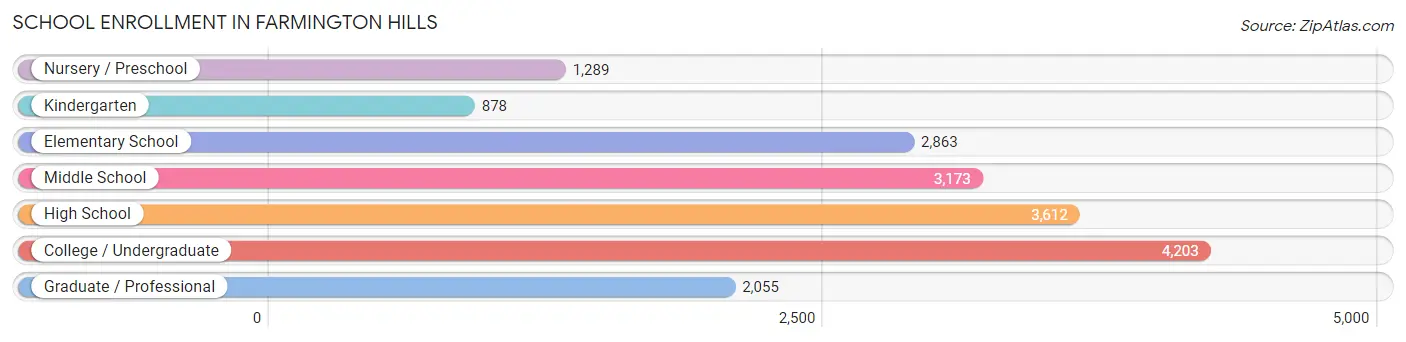
| School Level | # Students | % Students |
| Nursery / Preschool | 1,289 | 7.1% |
| Kindergarten | 878 | 4.9% |
| Elementary School | 2,863 | 15.8% |
| Middle School | 3,173 | 17.6% |
| High School | 3,612 | 20.0% |
| College / Undergraduate | 4,203 | 23.3% |
| Graduate / Professional | 2,055 | 11.4% |
| Total | 18,073 | 100.0% |
School Enrollment by Age by Funding Source in Farmington Hills
Out of a total of 18,073 students who are enrolled in schools in Farmington Hills, 3,759 (20.8%) attend a private institution, while the remaining 14,314 (79.2%) are enrolled in public schools. The age group of 3 to 4 year olds has the highest likelihood of being enrolled in private schools, with 565 (50.4% in the age bracket) enrolled. Conversely, the age group of 18 to 19 year olds has the lowest likelihood of being enrolled in a private school, with 1,259 (90.4% in the age bracket) attending a public institution.
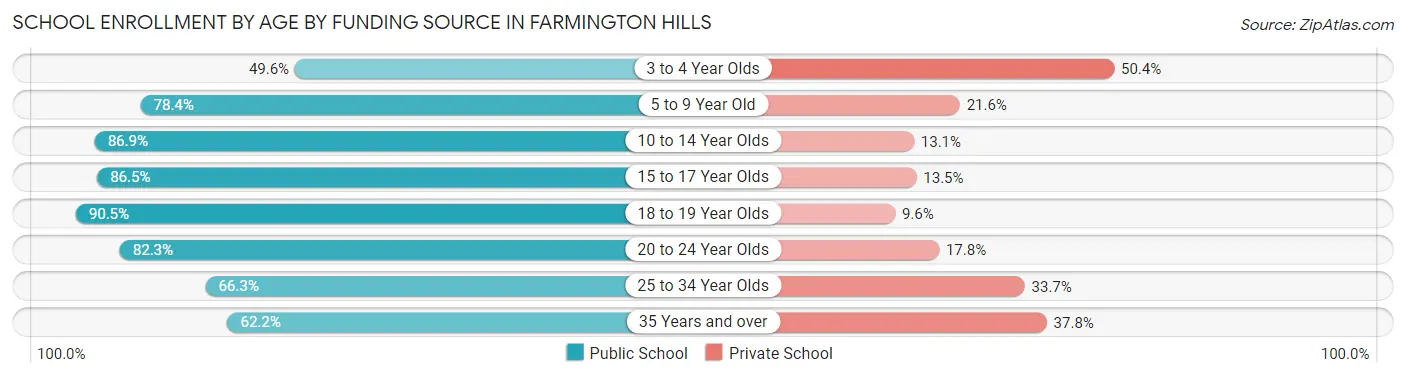
| Age Bracket | Public School | Private School |
| 3 to 4 Year Olds | 557 (49.6%) | 565 (50.4%) |
| 5 to 9 Year Old | 2,808 (78.4%) | 774 (21.6%) |
| 10 to 14 Year Olds | 3,612 (86.9%) | 543 (13.1%) |
| 15 to 17 Year Olds | 2,305 (86.5%) | 361 (13.5%) |
| 18 to 19 Year Olds | 1,259 (90.4%) | 133 (9.6%) |
| 20 to 24 Year Olds | 2,025 (82.3%) | 437 (17.7%) |
| 25 to 34 Year Olds | 1,139 (66.3%) | 579 (33.7%) |
| 35 Years and over | 607 (62.2%) | 369 (37.8%) |
| Total | 14,314 (79.2%) | 3,759 (20.8%) |
Educational Attainment by Field of Study in Farmington Hills
Business (7,439 | 19.9%), engineering (7,128 | 19.1%), education (3,645 | 9.7%), science & technology (3,440 | 9.2%), and computers & mathematics (2,418 | 6.5%) are the most common fields of study among 37,404 individuals in Farmington Hills who have obtained a bachelor's degree or higher.
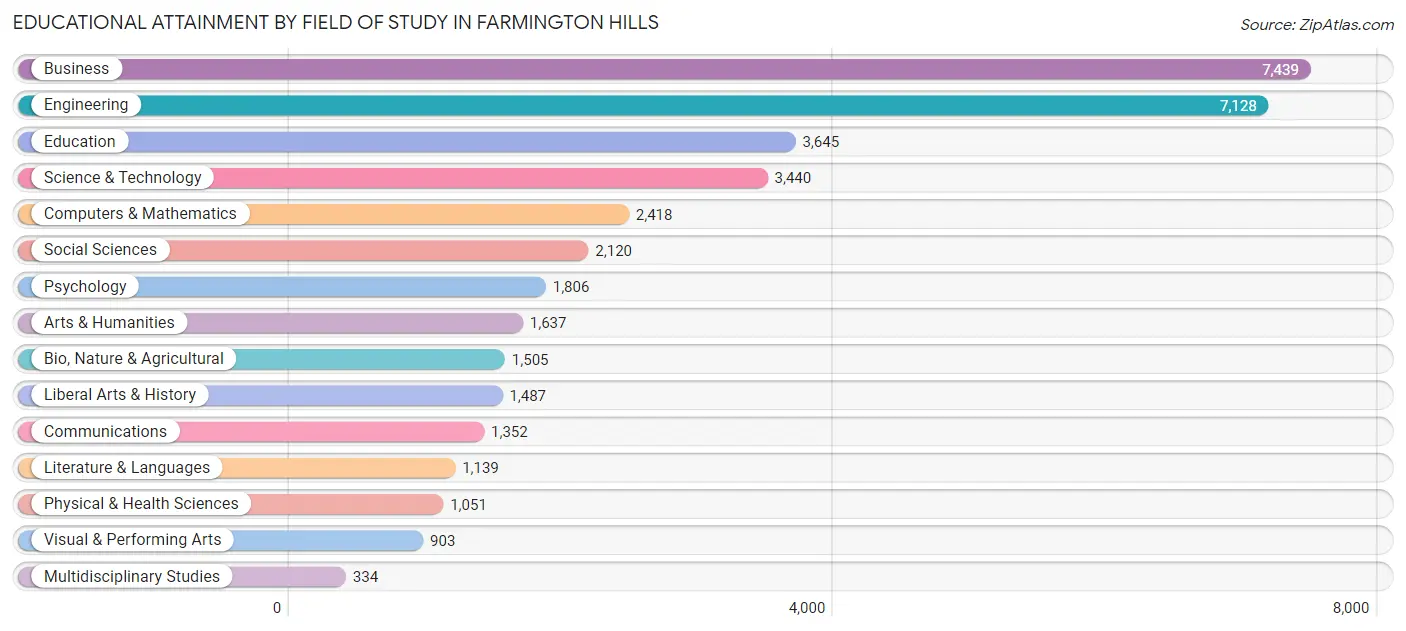
| Field of Study | # Graduates | % Graduates |
| Computers & Mathematics | 2,418 | 6.5% |
| Bio, Nature & Agricultural | 1,505 | 4.0% |
| Physical & Health Sciences | 1,051 | 2.8% |
| Psychology | 1,806 | 4.8% |
| Social Sciences | 2,120 | 5.7% |
| Engineering | 7,128 | 19.1% |
| Multidisciplinary Studies | 334 | 0.9% |
| Science & Technology | 3,440 | 9.2% |
| Business | 7,439 | 19.9% |
| Education | 3,645 | 9.7% |
| Literature & Languages | 1,139 | 3.0% |
| Liberal Arts & History | 1,487 | 4.0% |
| Visual & Performing Arts | 903 | 2.4% |
| Communications | 1,352 | 3.6% |
| Arts & Humanities | 1,637 | 4.4% |
| Total | 37,404 | 100.0% |
Transportation & Commute in Farmington Hills
Vehicle Availability by Sex in Farmington Hills
The most prevalent vehicle ownership categories in Farmington Hills are males with 2 vehicles (11,476, accounting for 46.0%) and females with 2 vehicles (9,303, making up 59.0%).
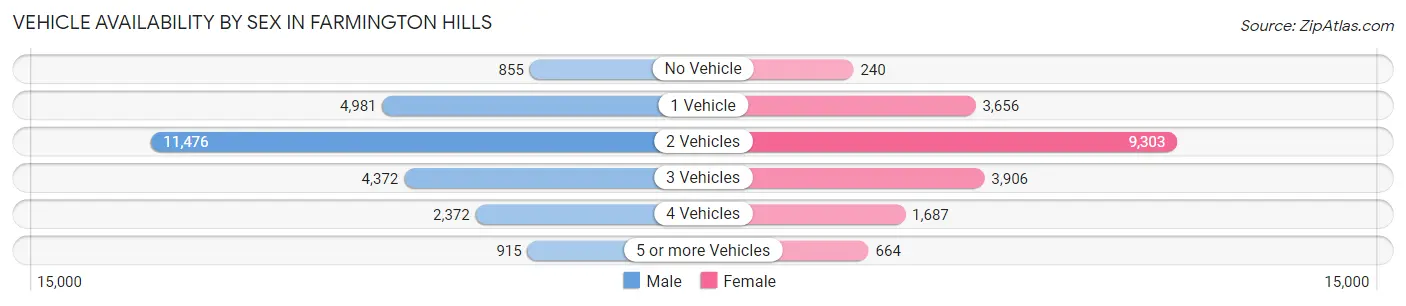
| Vehicles Available | Male | Female |
| No Vehicle | 855 (3.4%) | 240 (1.2%) |
| 1 Vehicle | 4,981 (20.0%) | 3,656 (18.8%) |
| 2 Vehicles | 11,476 (46.0%) | 9,303 (47.8%) |
| 3 Vehicles | 4,372 (17.5%) | 3,906 (20.1%) |
| 4 Vehicles | 2,372 (9.5%) | 1,687 (8.7%) |
| 5 or more Vehicles | 915 (3.7%) | 664 (3.4%) |
| Total | 24,971 (100.0%) | 19,456 (100.0%) |
Commute Time in Farmington Hills
The most frequently occuring commute durations in Farmington Hills are 30 to 34 minutes (7,231 commuters, 19.6%), 15 to 19 minutes (6,178 commuters, 16.8%), and 20 to 24 minutes (6,067 commuters, 16.5%).
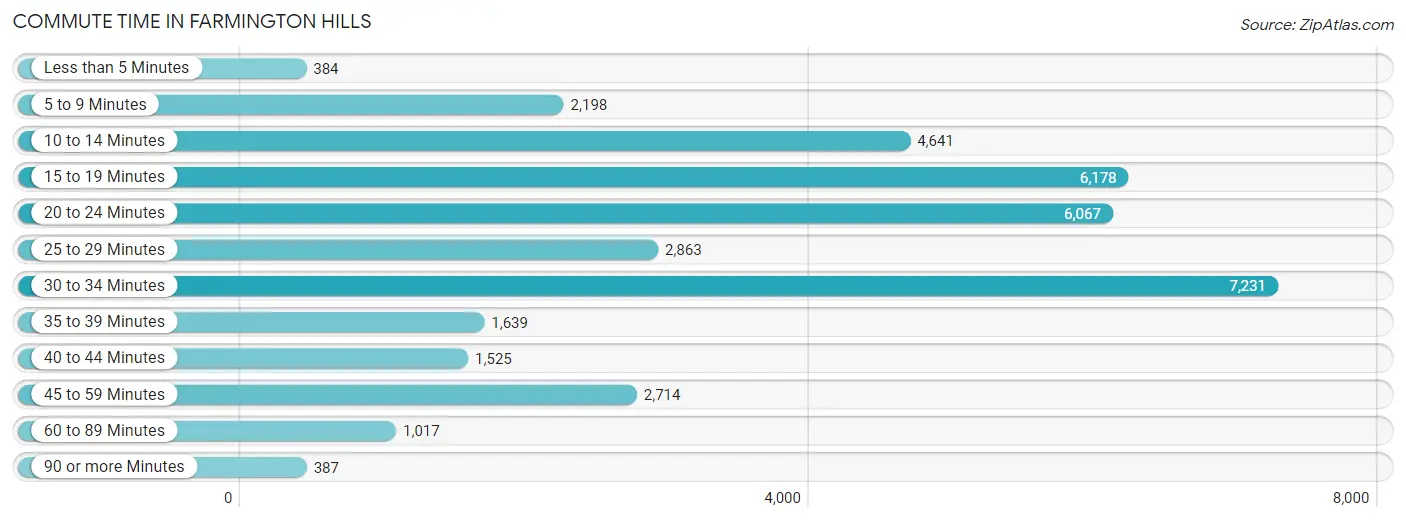
| Commute Time | # Commuters | % Commuters |
| Less than 5 Minutes | 384 | 1.0% |
| 5 to 9 Minutes | 2,198 | 6.0% |
| 10 to 14 Minutes | 4,641 | 12.6% |
| 15 to 19 Minutes | 6,178 | 16.8% |
| 20 to 24 Minutes | 6,067 | 16.5% |
| 25 to 29 Minutes | 2,863 | 7.8% |
| 30 to 34 Minutes | 7,231 | 19.6% |
| 35 to 39 Minutes | 1,639 | 4.4% |
| 40 to 44 Minutes | 1,525 | 4.1% |
| 45 to 59 Minutes | 2,714 | 7.4% |
| 60 to 89 Minutes | 1,017 | 2.8% |
| 90 or more Minutes | 387 | 1.1% |
Commute Time by Sex in Farmington Hills
The most common commute times in Farmington Hills are 30 to 34 minutes (4,587 commuters, 21.7%) for males and 20 to 24 minutes (3,246 commuters, 20.7%) for females.
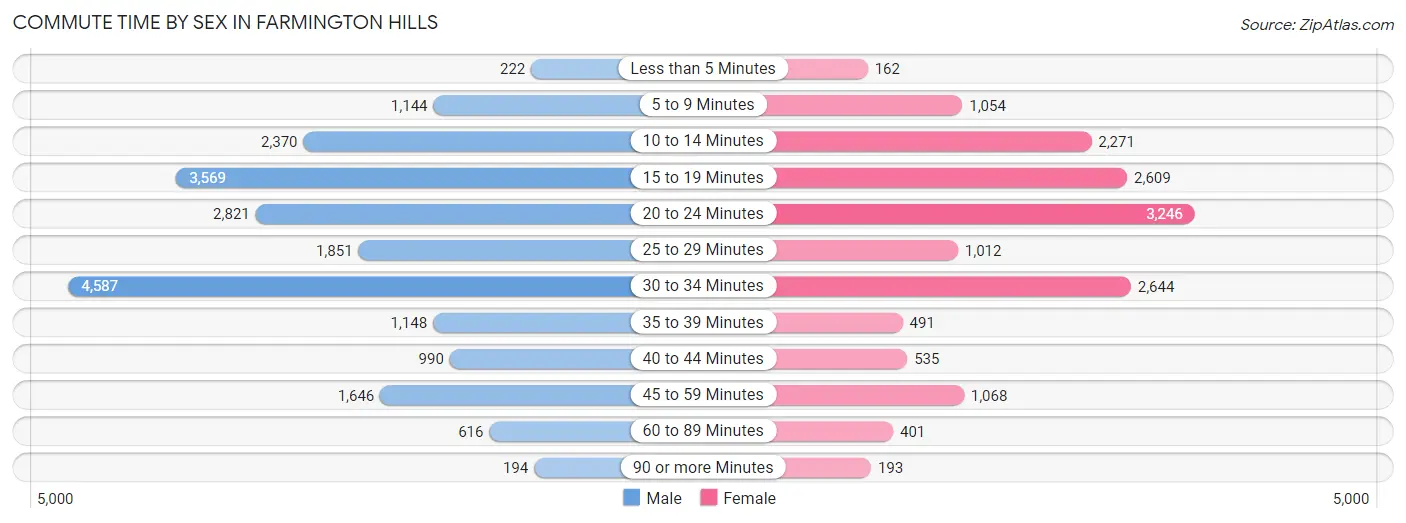
| Commute Time | Male | Female |
| Less than 5 Minutes | 222 (1.1%) | 162 (1.0%) |
| 5 to 9 Minutes | 1,144 (5.4%) | 1,054 (6.7%) |
| 10 to 14 Minutes | 2,370 (11.2%) | 2,271 (14.5%) |
| 15 to 19 Minutes | 3,569 (16.9%) | 2,609 (16.6%) |
| 20 to 24 Minutes | 2,821 (13.3%) | 3,246 (20.7%) |
| 25 to 29 Minutes | 1,851 (8.7%) | 1,012 (6.5%) |
| 30 to 34 Minutes | 4,587 (21.7%) | 2,644 (16.9%) |
| 35 to 39 Minutes | 1,148 (5.4%) | 491 (3.1%) |
| 40 to 44 Minutes | 990 (4.7%) | 535 (3.4%) |
| 45 to 59 Minutes | 1,646 (7.8%) | 1,068 (6.8%) |
| 60 to 89 Minutes | 616 (2.9%) | 401 (2.6%) |
| 90 or more Minutes | 194 (0.9%) | 193 (1.2%) |
Time of Departure to Work by Sex in Farmington Hills
The most frequent times of departure to work in Farmington Hills are 7:30 AM to 7:59 AM (3,257, 15.4%) for males and 7:00 AM to 7:29 AM (2,448, 15.6%) for females.
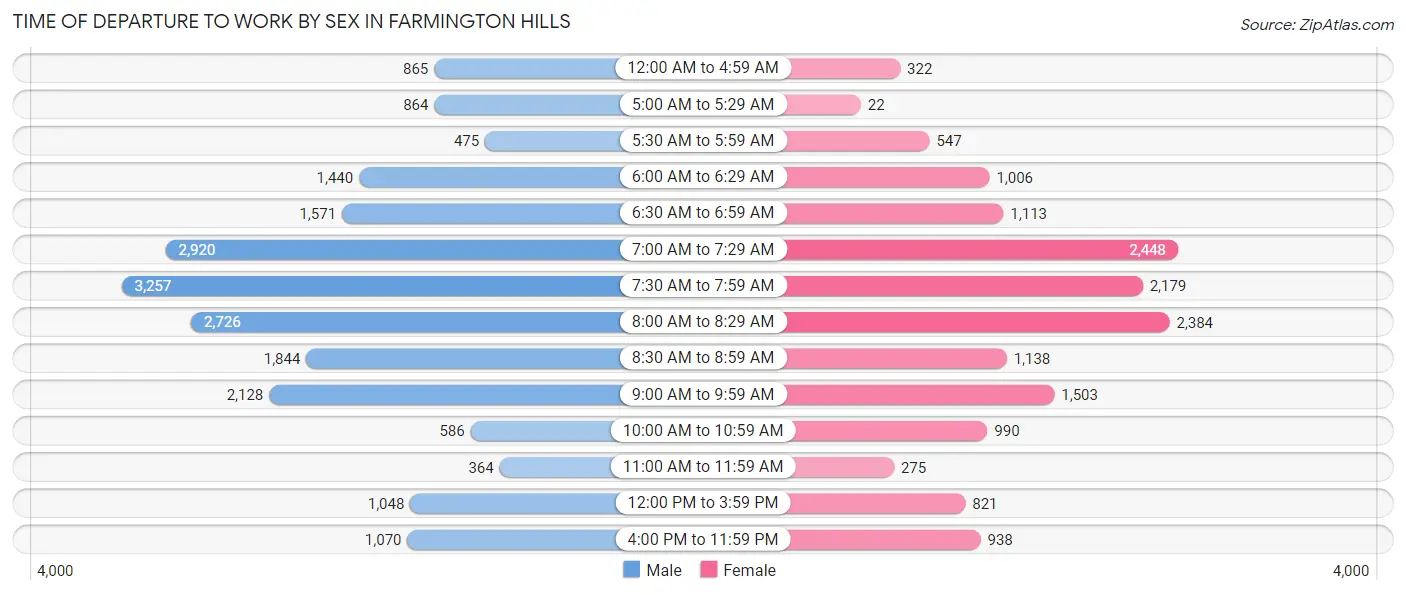
| Time of Departure | Male | Female |
| 12:00 AM to 4:59 AM | 865 (4.1%) | 322 (2.1%) |
| 5:00 AM to 5:29 AM | 864 (4.1%) | 22 (0.1%) |
| 5:30 AM to 5:59 AM | 475 (2.2%) | 547 (3.5%) |
| 6:00 AM to 6:29 AM | 1,440 (6.8%) | 1,006 (6.4%) |
| 6:30 AM to 6:59 AM | 1,571 (7.4%) | 1,113 (7.1%) |
| 7:00 AM to 7:29 AM | 2,920 (13.8%) | 2,448 (15.6%) |
| 7:30 AM to 7:59 AM | 3,257 (15.4%) | 2,179 (13.9%) |
| 8:00 AM to 8:29 AM | 2,726 (12.9%) | 2,384 (15.2%) |
| 8:30 AM to 8:59 AM | 1,844 (8.7%) | 1,138 (7.2%) |
| 9:00 AM to 9:59 AM | 2,128 (10.1%) | 1,503 (9.6%) |
| 10:00 AM to 10:59 AM | 586 (2.8%) | 990 (6.3%) |
| 11:00 AM to 11:59 AM | 364 (1.7%) | 275 (1.8%) |
| 12:00 PM to 3:59 PM | 1,048 (5.0%) | 821 (5.2%) |
| 4:00 PM to 11:59 PM | 1,070 (5.1%) | 938 (6.0%) |
| Total | 21,158 (100.0%) | 15,686 (100.0%) |
Housing Occupancy in Farmington Hills
Occupancy by Ownership in Farmington Hills
Of the total 35,366 dwellings in Farmington Hills, owner-occupied units account for 22,741 (64.3%), while renter-occupied units make up 12,625 (35.7%).
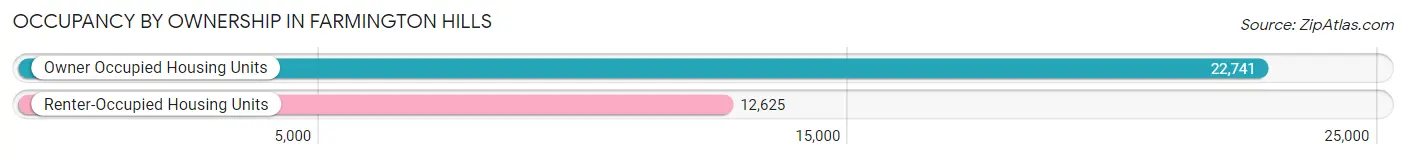
| Occupancy | # Housing Units | % Housing Units |
| Owner Occupied Housing Units | 22,741 | 64.3% |
| Renter-Occupied Housing Units | 12,625 | 35.7% |
| Total Occupied Housing Units | 35,366 | 100.0% |
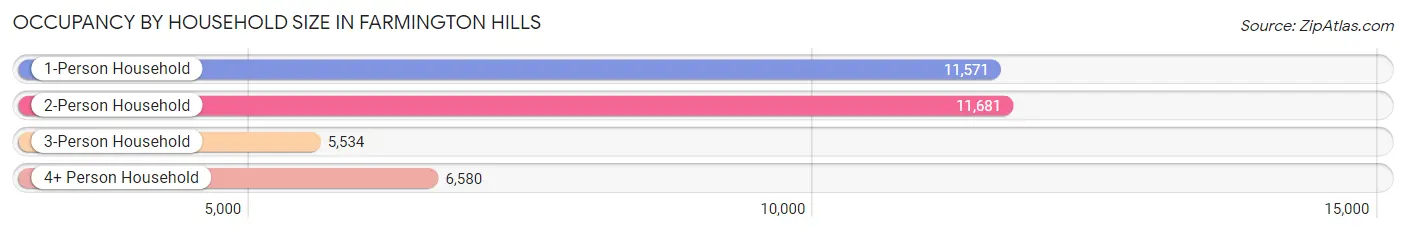
Occupancy by Household Size in Farmington Hills
| Household Size | # Housing Units | % Housing Units |
| 1-Person Household | 11,571 | 32.7% |
| 2-Person Household | 11,681 | 33.0% |
| 3-Person Household | 5,534 | 15.7% |
| 4+ Person Household | 6,580 | 18.6% |
| Total Housing Units | 35,366 | 100.0% |
Occupancy by Ownership by Household Size in Farmington Hills
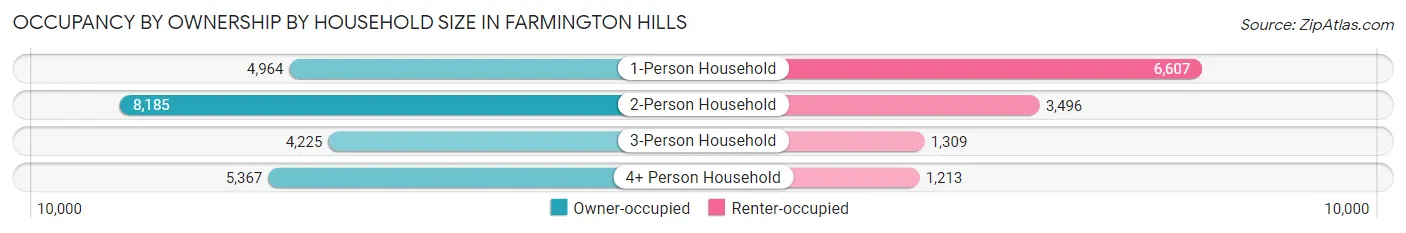
| Household Size | Owner-occupied | Renter-occupied |
| 1-Person Household | 4,964 (42.9%) | 6,607 (57.1%) |
| 2-Person Household | 8,185 (70.1%) | 3,496 (29.9%) |
| 3-Person Household | 4,225 (76.3%) | 1,309 (23.6%) |
| 4+ Person Household | 5,367 (81.6%) | 1,213 (18.4%) |
| Total Housing Units | 22,741 (64.3%) | 12,625 (35.7%) |
Occupancy by Educational Attainment in Farmington Hills
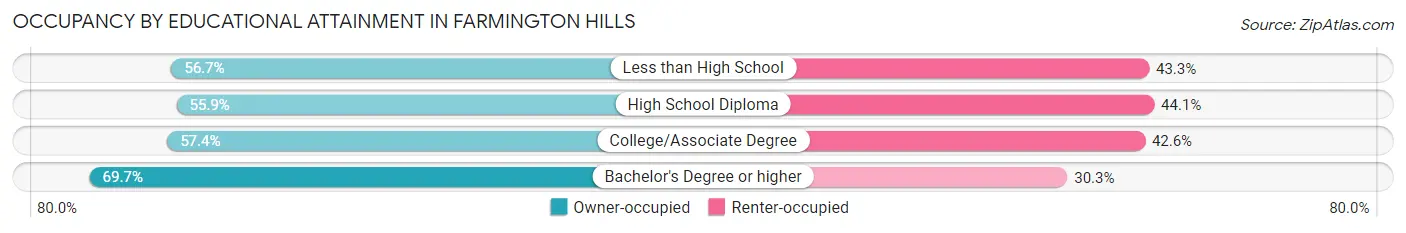
| Household Size | Owner-occupied | Renter-occupied |
| Less than High School | 675 (56.7%) | 515 (43.3%) |
| High School Diploma | 2,534 (55.9%) | 1,998 (44.1%) |
| College/Associate Degree | 5,236 (57.4%) | 3,890 (42.6%) |
| Bachelor's Degree or higher | 14,296 (69.7%) | 6,222 (30.3%) |
Occupancy by Age of Householder in Farmington Hills
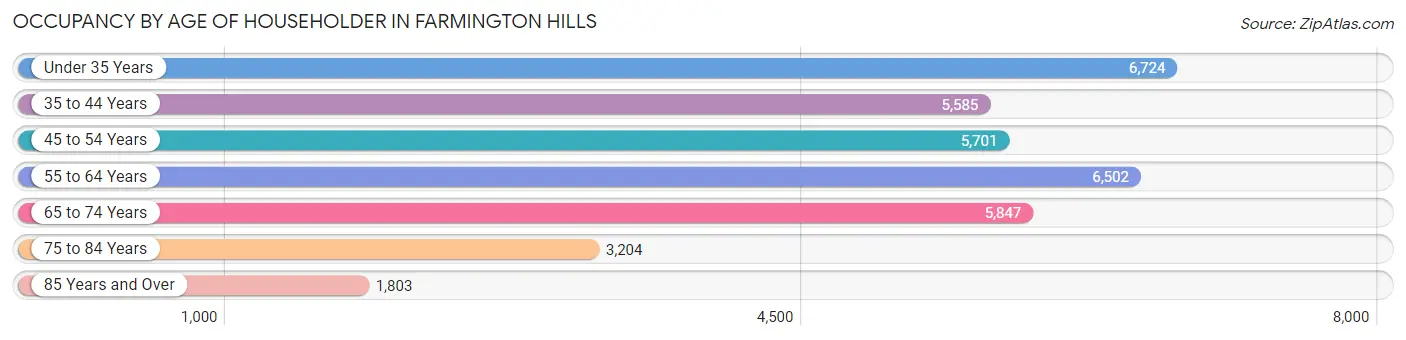
| Age Bracket | # Households | % Households |
| Under 35 Years | 6,724 | 19.0% |
| 35 to 44 Years | 5,585 | 15.8% |
| 45 to 54 Years | 5,701 | 16.1% |
| 55 to 64 Years | 6,502 | 18.4% |
| 65 to 74 Years | 5,847 | 16.5% |
| 75 to 84 Years | 3,204 | 9.1% |
| 85 Years and Over | 1,803 | 5.1% |
| Total | 35,366 | 100.0% |
Housing Finances in Farmington Hills
Median Income by Occupancy in Farmington Hills
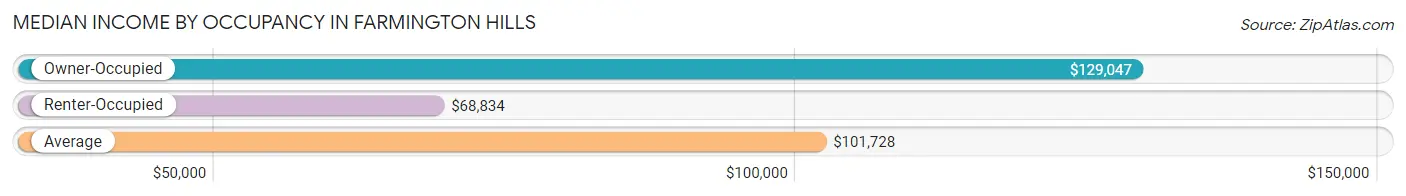
| Occupancy Type | # Households | Median Income |
| Owner-Occupied | 22,741 (64.3%) | $129,047 |
| Renter-Occupied | 12,625 (35.7%) | $68,834 |
| Average | 35,366 (100.0%) | $101,728 |
Occupancy by Householder Income Bracket in Farmington Hills
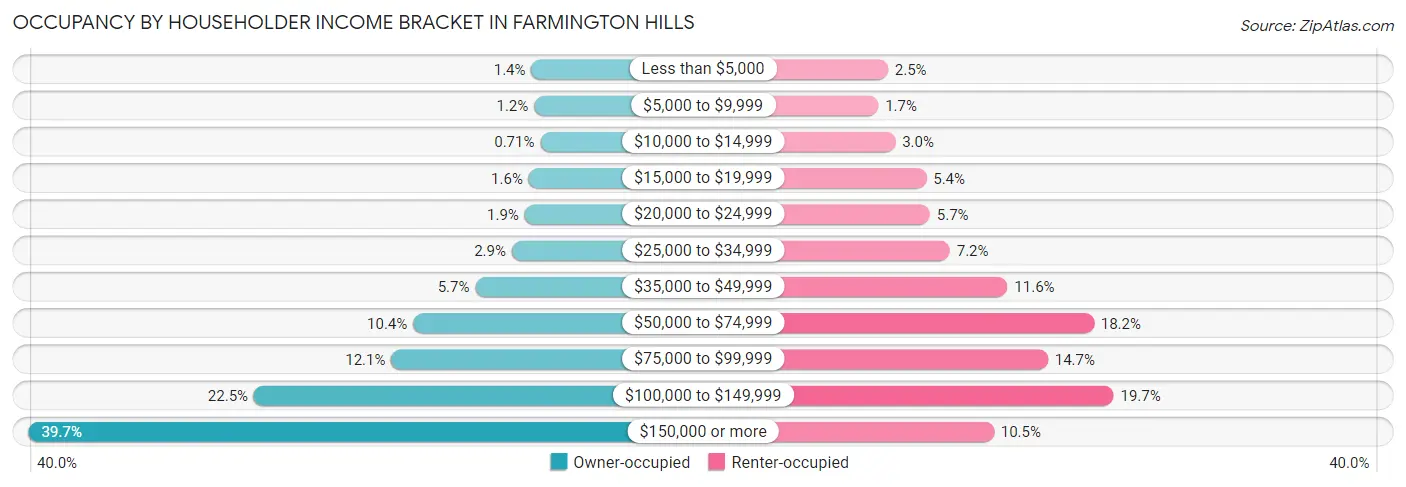
| Income Bracket | Owner-occupied | Renter-occupied |
| Less than $5,000 | 316 (1.4%) | 310 (2.5%) |
| $5,000 to $9,999 | 269 (1.2%) | 218 (1.7%) |
| $10,000 to $14,999 | 161 (0.7%) | 381 (3.0%) |
| $15,000 to $19,999 | 362 (1.6%) | 680 (5.4%) |
| $20,000 to $24,999 | 431 (1.9%) | 715 (5.7%) |
| $25,000 to $34,999 | 655 (2.9%) | 906 (7.2%) |
| $35,000 to $49,999 | 1,288 (5.7%) | 1,461 (11.6%) |
| $50,000 to $74,999 | 2,365 (10.4%) | 2,292 (18.1%) |
| $75,000 to $99,999 | 2,743 (12.1%) | 1,850 (14.6%) |
| $100,000 to $149,999 | 5,123 (22.5%) | 2,482 (19.7%) |
| $150,000 or more | 9,028 (39.7%) | 1,330 (10.5%) |
| Total | 22,741 (100.0%) | 12,625 (100.0%) |
Monthly Housing Cost Tiers in Farmington Hills
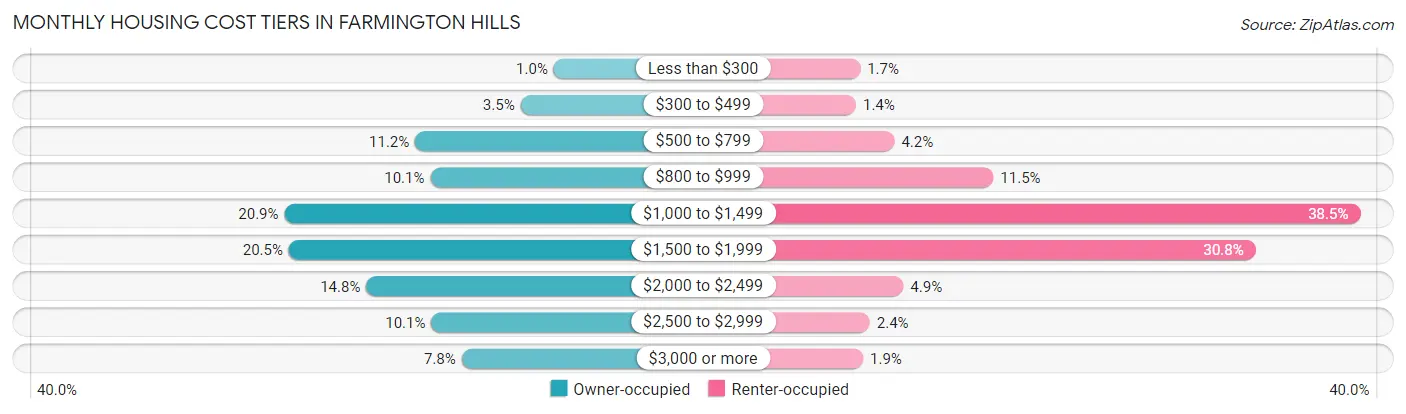
| Monthly Cost | Owner-occupied | Renter-occupied |
| Less than $300 | 235 (1.0%) | 212 (1.7%) |
| $300 to $499 | 791 (3.5%) | 173 (1.4%) |
| $500 to $799 | 2,557 (11.2%) | 530 (4.2%) |
| $800 to $999 | 2,302 (10.1%) | 1,451 (11.5%) |
| $1,000 to $1,499 | 4,746 (20.9%) | 4,861 (38.5%) |
| $1,500 to $1,999 | 4,671 (20.5%) | 3,887 (30.8%) |
| $2,000 to $2,499 | 3,374 (14.8%) | 613 (4.9%) |
| $2,500 to $2,999 | 2,286 (10.1%) | 302 (2.4%) |
| $3,000 or more | 1,779 (7.8%) | 238 (1.9%) |
| Total | 22,741 (100.0%) | 12,625 (100.0%) |
Physical Housing Characteristics in Farmington Hills
Housing Structures in Farmington Hills
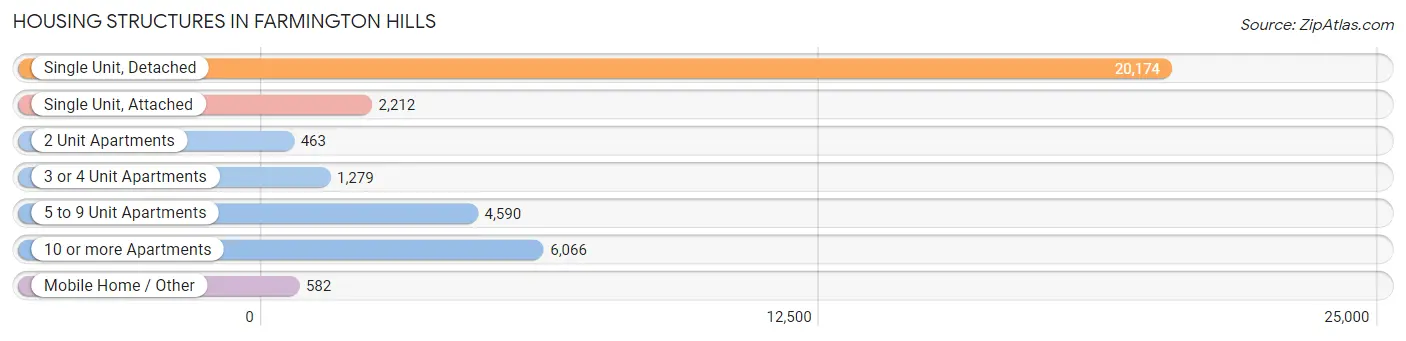
| Structure Type | # Housing Units | % Housing Units |
| Single Unit, Detached | 20,174 | 57.0% |
| Single Unit, Attached | 2,212 | 6.2% |
| 2 Unit Apartments | 463 | 1.3% |
| 3 or 4 Unit Apartments | 1,279 | 3.6% |
| 5 to 9 Unit Apartments | 4,590 | 13.0% |
| 10 or more Apartments | 6,066 | 17.2% |
| Mobile Home / Other | 582 | 1.7% |
| Total | 35,366 | 100.0% |
Housing Structures by Occupancy in Farmington Hills
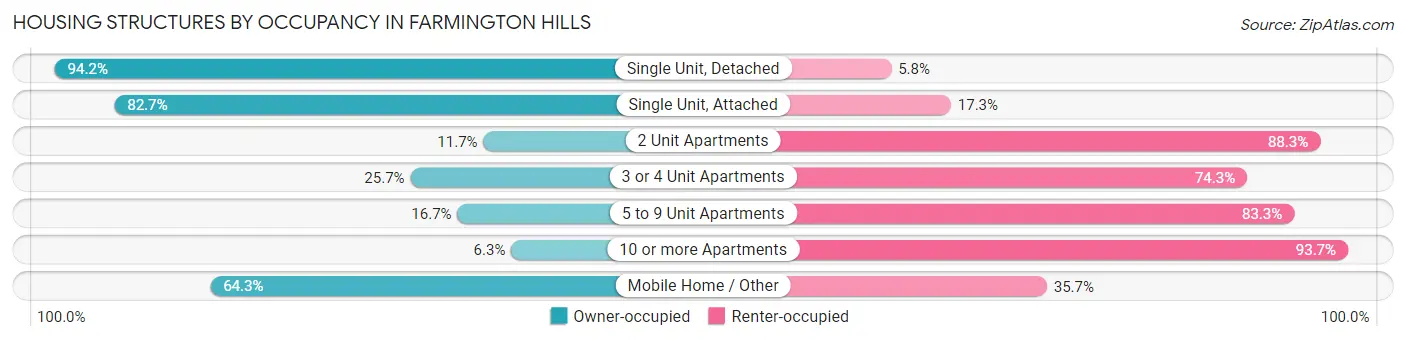
| Structure Type | Owner-occupied | Renter-occupied |
| Single Unit, Detached | 19,007 (94.2%) | 1,167 (5.8%) |
| Single Unit, Attached | 1,830 (82.7%) | 382 (17.3%) |
| 2 Unit Apartments | 54 (11.7%) | 409 (88.3%) |
| 3 or 4 Unit Apartments | 329 (25.7%) | 950 (74.3%) |
| 5 to 9 Unit Apartments | 765 (16.7%) | 3,825 (83.3%) |
| 10 or more Apartments | 382 (6.3%) | 5,684 (93.7%) |
| Mobile Home / Other | 374 (64.3%) | 208 (35.7%) |
| Total | 22,741 (64.3%) | 12,625 (35.7%) |
Housing Structures by Number of Rooms in Farmington Hills
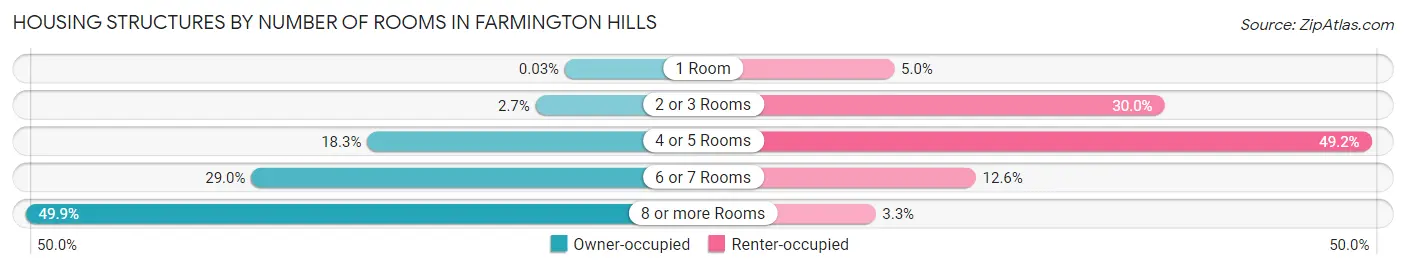
| Number of Rooms | Owner-occupied | Renter-occupied |
| 1 Room | 7 (0.0%) | 632 (5.0%) |
| 2 or 3 Rooms | 622 (2.7%) | 3,789 (30.0%) |
| 4 or 5 Rooms | 4,163 (18.3%) | 6,205 (49.1%) |
| 6 or 7 Rooms | 6,602 (29.0%) | 1,585 (12.6%) |
| 8 or more Rooms | 11,347 (49.9%) | 414 (3.3%) |
| Total | 22,741 (100.0%) | 12,625 (100.0%) |
Housing Structure by Heating Type in Farmington Hills
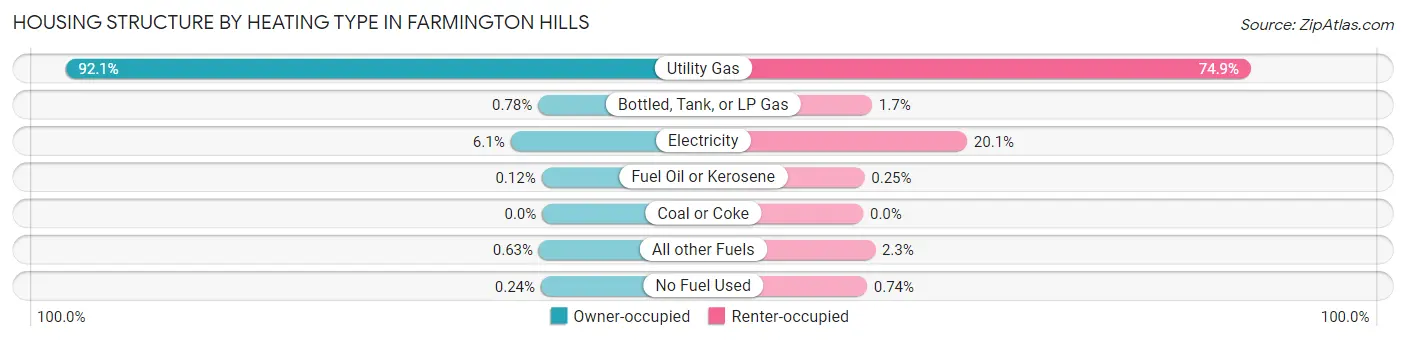
| Heating Type | Owner-occupied | Renter-occupied |
| Utility Gas | 20,948 (92.1%) | 9,460 (74.9%) |
| Bottled, Tank, or LP Gas | 178 (0.8%) | 216 (1.7%) |
| Electricity | 1,389 (6.1%) | 2,534 (20.1%) |
| Fuel Oil or Kerosene | 28 (0.1%) | 31 (0.3%) |
| Coal or Coke | 0 (0.0%) | 0 (0.0%) |
| All other Fuels | 144 (0.6%) | 291 (2.3%) |
| No Fuel Used | 54 (0.2%) | 93 (0.7%) |
| Total | 22,741 (100.0%) | 12,625 (100.0%) |
Household Vehicle Usage in Farmington Hills
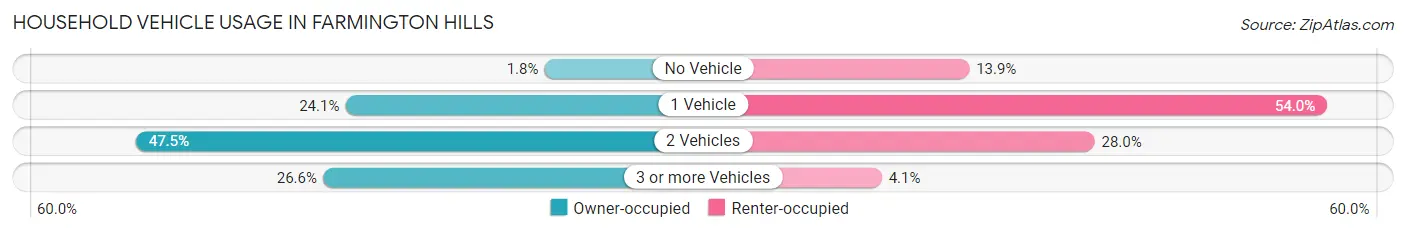
| Vehicles per Household | Owner-occupied | Renter-occupied |
| No Vehicle | 405 (1.8%) | 1,758 (13.9%) |
| 1 Vehicle | 5,475 (24.1%) | 6,817 (54.0%) |
| 2 Vehicles | 10,811 (47.5%) | 3,530 (28.0%) |
| 3 or more Vehicles | 6,050 (26.6%) | 520 (4.1%) |
| Total | 22,741 (100.0%) | 12,625 (100.0%) |
Real Estate & Mortgages in Farmington Hills
Real Estate and Mortgage Overview in Farmington Hills
| Characteristic | Without Mortgage | With Mortgage |
| Housing Units | 7,691 | 15,050 |
| Median Property Value | $302,800 | $327,100 |
| Median Household Income | $100,194 | $6,657 |
| Monthly Housing Costs | $845 | $1,757 |
| Real Estate Taxes | $4,832 | $288 |
Property Value by Mortgage Status in Farmington Hills
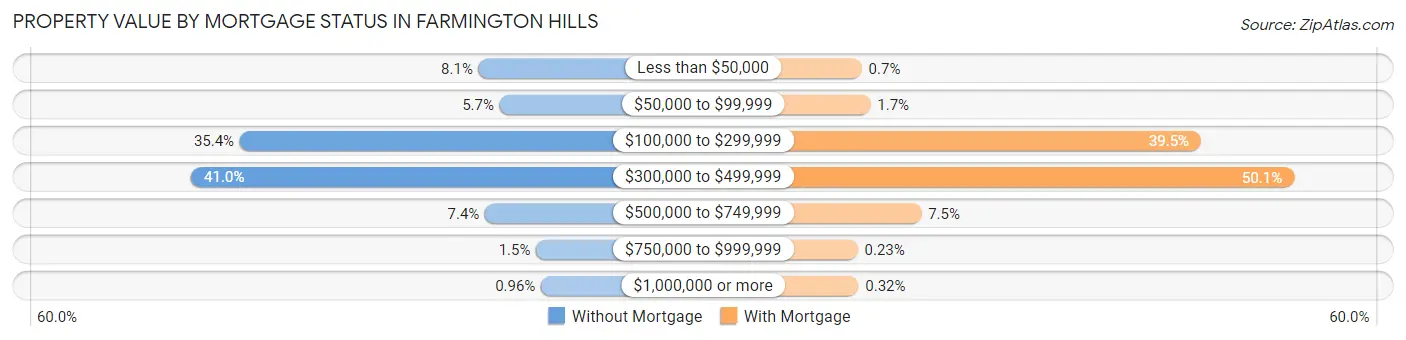
| Property Value | Without Mortgage | With Mortgage |
| Less than $50,000 | 623 (8.1%) | 105 (0.7%) |
| $50,000 to $99,999 | 438 (5.7%) | 254 (1.7%) |
| $100,000 to $299,999 | 2,722 (35.4%) | 5,940 (39.5%) |
| $300,000 to $499,999 | 3,151 (41.0%) | 7,541 (50.1%) |
| $500,000 to $749,999 | 566 (7.4%) | 1,128 (7.5%) |
| $750,000 to $999,999 | 117 (1.5%) | 34 (0.2%) |
| $1,000,000 or more | 74 (1.0%) | 48 (0.3%) |
| Total | 7,691 (100.0%) | 15,050 (100.0%) |
Household Income by Mortgage Status in Farmington Hills
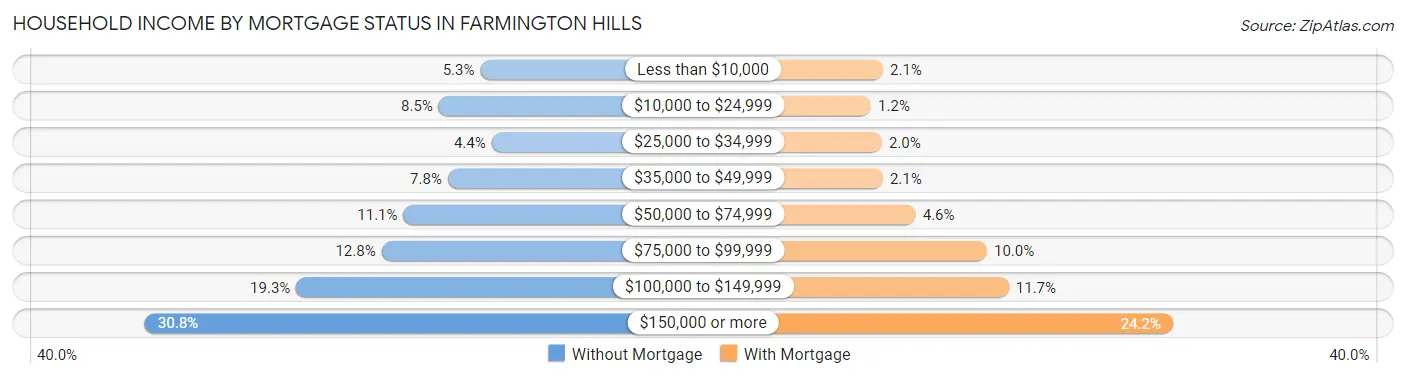
| Household Income | Without Mortgage | With Mortgage |
| Less than $10,000 | 406 (5.3%) | 316 (2.1%) |
| $10,000 to $24,999 | 650 (8.5%) | 179 (1.2%) |
| $25,000 to $34,999 | 340 (4.4%) | 304 (2.0%) |
| $35,000 to $49,999 | 597 (7.8%) | 315 (2.1%) |
| $50,000 to $74,999 | 857 (11.1%) | 691 (4.6%) |
| $75,000 to $99,999 | 985 (12.8%) | 1,508 (10.0%) |
| $100,000 to $149,999 | 1,485 (19.3%) | 1,758 (11.7%) |
| $150,000 or more | 2,371 (30.8%) | 3,638 (24.2%) |
| Total | 7,691 (100.0%) | 15,050 (100.0%) |
Property Value to Household Income Ratio in Farmington Hills
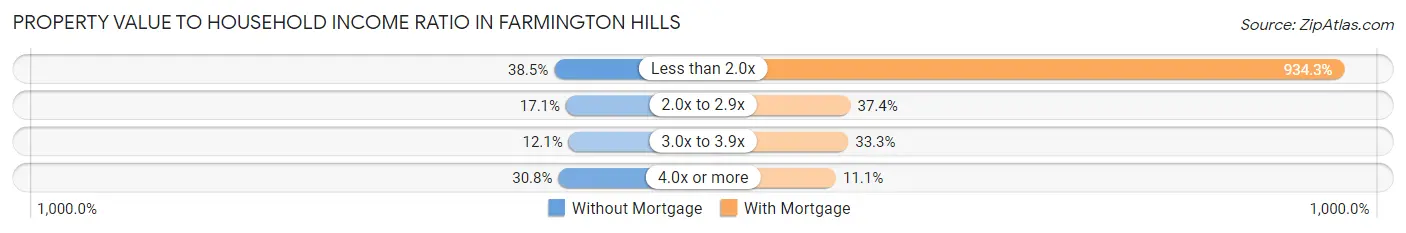
| Value-to-Income Ratio | Without Mortgage | With Mortgage |
| Less than 2.0x | 2,961 (38.5%) | 140,615 (934.3%) |
| 2.0x to 2.9x | 1,311 (17.1%) | 5,634 (37.4%) |
| 3.0x to 3.9x | 928 (12.1%) | 5,017 (33.3%) |
| 4.0x or more | 2,365 (30.7%) | 1,673 (11.1%) |
| Total | 7,691 (100.0%) | 15,050 (100.0%) |
Real Estate Taxes by Mortgage Status in Farmington Hills
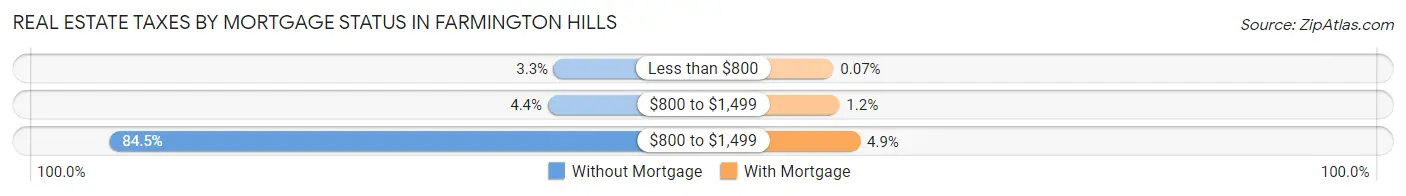
| Property Taxes | Without Mortgage | With Mortgage |
| Less than $800 | 255 (3.3%) | 10 (0.1%) |
| $800 to $1,499 | 340 (4.4%) | 175 (1.2%) |
| $800 to $1,499 | 6,499 (84.5%) | 743 (4.9%) |
| Total | 7,691 (100.0%) | 15,050 (100.0%) |
Health & Disability in Farmington Hills
Health Insurance Coverage by Age in Farmington Hills
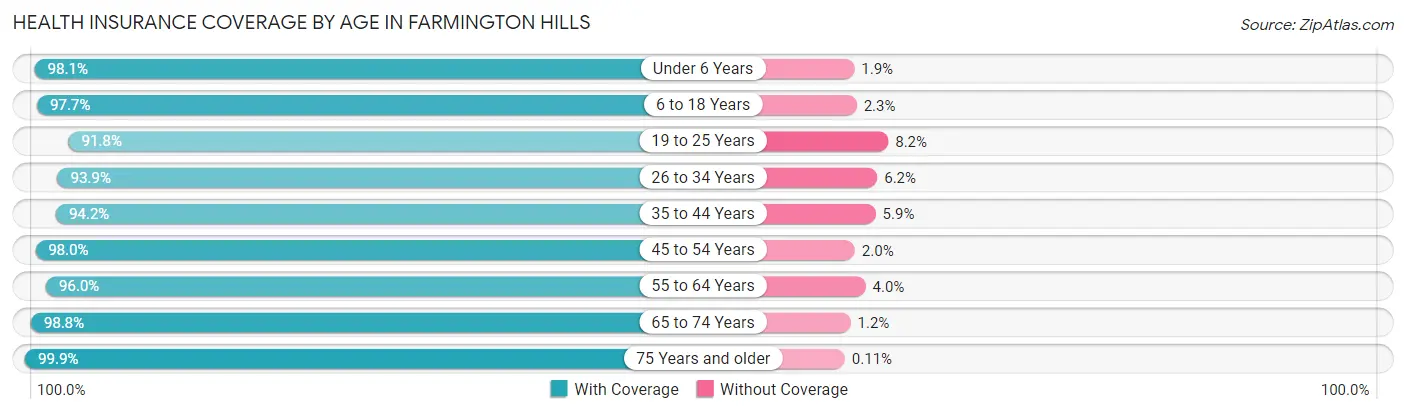
| Age Bracket | With Coverage | Without Coverage |
| Under 6 Years | 4,747 (98.1%) | 91 (1.9%) |
| 6 to 18 Years | 10,423 (97.7%) | 248 (2.3%) |
| 19 to 25 Years | 7,207 (91.8%) | 644 (8.2%) |
| 26 to 34 Years | 10,721 (93.9%) | 702 (6.1%) |
| 35 to 44 Years | 9,438 (94.2%) | 586 (5.9%) |
| 45 to 54 Years | 10,788 (98.0%) | 218 (2.0%) |
| 55 to 64 Years | 10,468 (96.0%) | 434 (4.0%) |
| 65 to 74 Years | 9,155 (98.8%) | 108 (1.2%) |
| 75 Years and older | 7,154 (99.9%) | 8 (0.1%) |
| Total | 80,101 (96.3%) | 3,039 (3.7%) |
Health Insurance Coverage by Citizenship Status in Farmington Hills
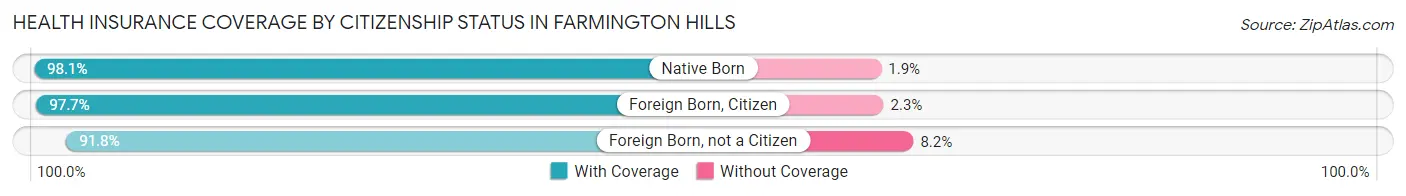
| Citizenship Status | With Coverage | Without Coverage |
| Native Born | 4,747 (98.1%) | 91 (1.9%) |
| Foreign Born, Citizen | 10,423 (97.7%) | 248 (2.3%) |
| Foreign Born, not a Citizen | 7,207 (91.8%) | 644 (8.2%) |
Health Insurance Coverage by Household Income in Farmington Hills
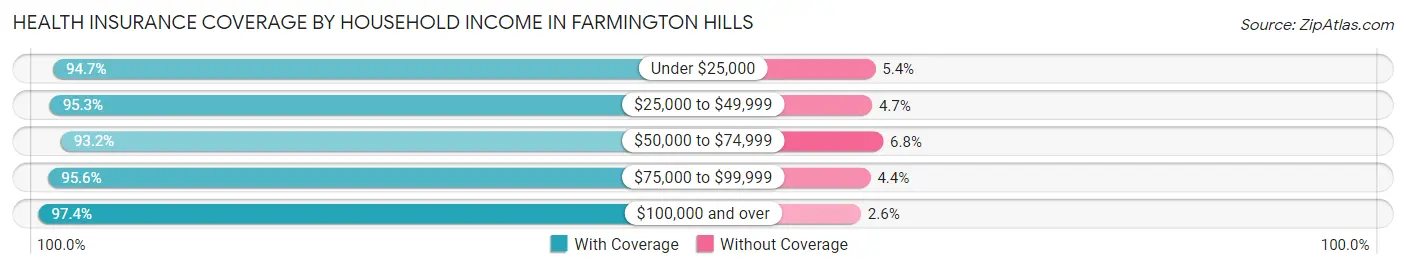
| Household Income | With Coverage | Without Coverage |
| Under $25,000 | 4,887 (94.7%) | 276 (5.3%) |
| $25,000 to $49,999 | 7,338 (95.3%) | 363 (4.7%) |
| $50,000 to $74,999 | 8,299 (93.2%) | 606 (6.8%) |
| $75,000 to $99,999 | 9,533 (95.6%) | 443 (4.4%) |
| $100,000 and over | 49,679 (97.4%) | 1,349 (2.6%) |
Public vs Private Health Insurance Coverage by Age in Farmington Hills
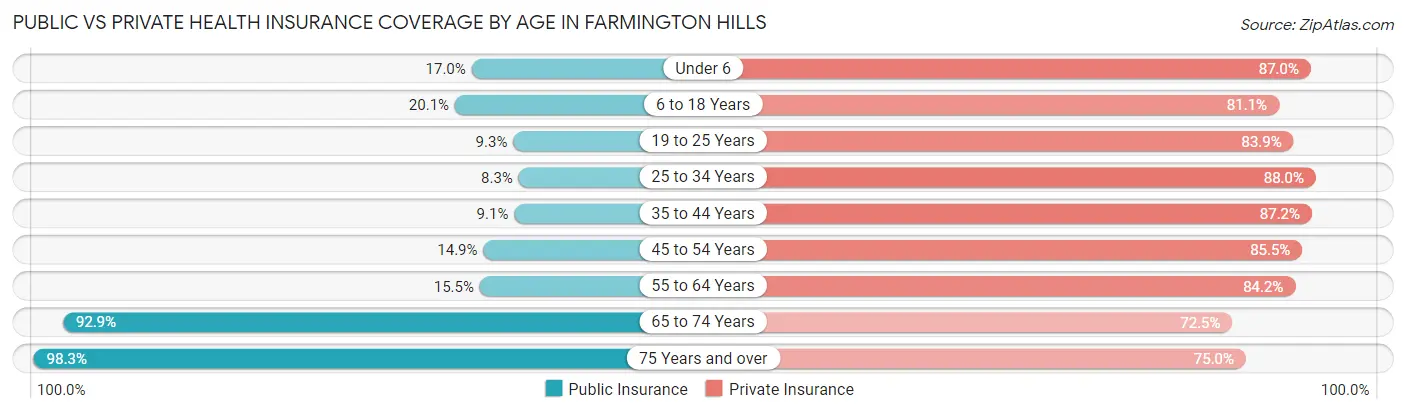
| Age Bracket | Public Insurance | Private Insurance |
| Under 6 | 824 (17.0%) | 4,211 (87.0%) |
| 6 to 18 Years | 2,148 (20.1%) | 8,657 (81.1%) |
| 19 to 25 Years | 730 (9.3%) | 6,583 (83.9%) |
| 25 to 34 Years | 947 (8.3%) | 10,049 (88.0%) |
| 35 to 44 Years | 914 (9.1%) | 8,745 (87.2%) |
| 45 to 54 Years | 1,634 (14.8%) | 9,405 (85.5%) |
| 55 to 64 Years | 1,691 (15.5%) | 9,174 (84.2%) |
| 65 to 74 Years | 8,604 (92.9%) | 6,715 (72.5%) |
| 75 Years and over | 7,042 (98.3%) | 5,371 (75.0%) |
| Total | 24,534 (29.5%) | 68,910 (82.9%) |
Disability Status by Sex by Age in Farmington Hills
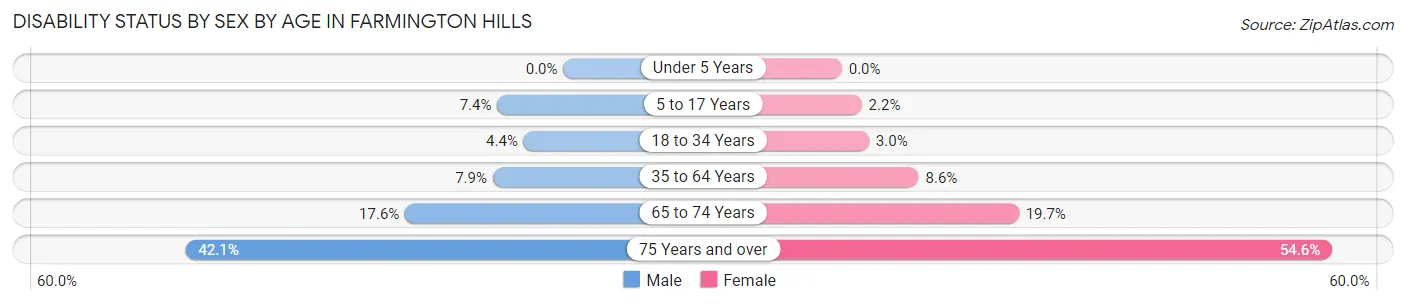
| Age Bracket | Male | Female |
| Under 5 Years | 0 (0.0%) | 0 (0.0%) |
| 5 to 17 Years | 412 (7.4%) | 112 (2.2%) |
| 18 to 34 Years | 476 (4.4%) | 276 (3.0%) |
| 35 to 64 Years | 1,216 (7.9%) | 1,408 (8.6%) |
| 65 to 74 Years | 801 (17.6%) | 929 (19.7%) |
| 75 Years and over | 1,278 (42.1%) | 2,252 (54.6%) |
Disability Class by Sex by Age in Farmington Hills
Disability Class: Hearing Difficulty
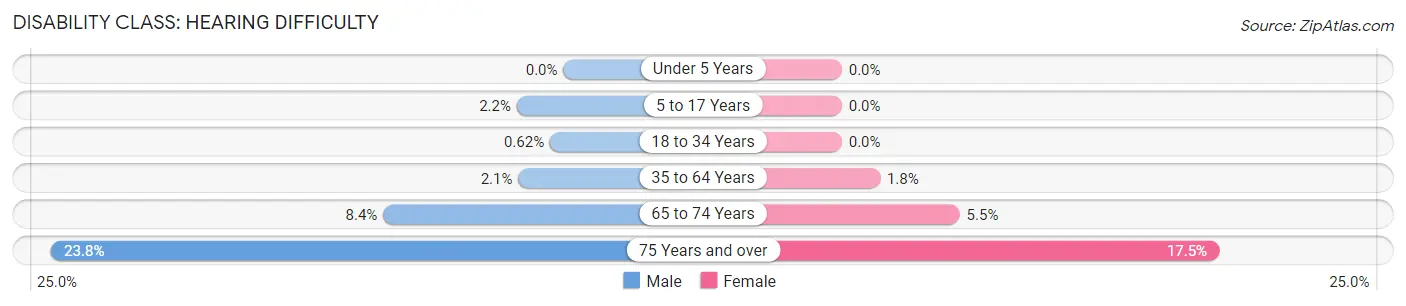
| Age Bracket | Male | Female |
| Under 5 Years | 0 (0.0%) | 0 (0.0%) |
| 5 to 17 Years | 121 (2.2%) | 0 (0.0%) |
| 18 to 34 Years | 67 (0.6%) | 0 (0.0%) |
| 35 to 64 Years | 323 (2.1%) | 291 (1.8%) |
| 65 to 74 Years | 380 (8.4%) | 258 (5.5%) |
| 75 Years and over | 722 (23.8%) | 722 (17.5%) |
Disability Class: Vision Difficulty
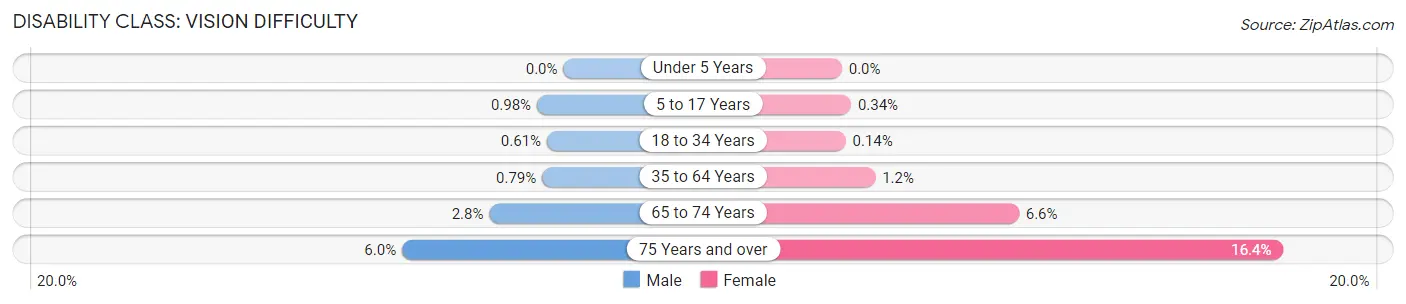
| Age Bracket | Male | Female |
| Under 5 Years | 0 (0.0%) | 0 (0.0%) |
| 5 to 17 Years | 55 (1.0%) | 17 (0.3%) |
| 18 to 34 Years | 66 (0.6%) | 13 (0.1%) |
| 35 to 64 Years | 122 (0.8%) | 204 (1.2%) |
| 65 to 74 Years | 125 (2.8%) | 310 (6.6%) |
| 75 Years and over | 182 (6.0%) | 676 (16.4%) |
Disability Class: Cognitive Difficulty
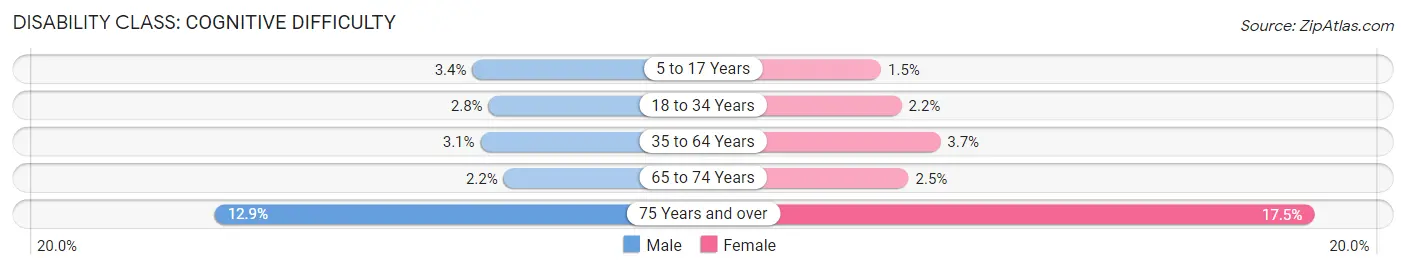
| Age Bracket | Male | Female |
| 5 to 17 Years | 189 (3.4%) | 74 (1.5%) |
| 18 to 34 Years | 300 (2.8%) | 203 (2.2%) |
| 35 to 64 Years | 476 (3.1%) | 603 (3.7%) |
| 65 to 74 Years | 101 (2.2%) | 117 (2.5%) |
| 75 Years and over | 393 (12.9%) | 723 (17.5%) |
Disability Class: Ambulatory Difficulty
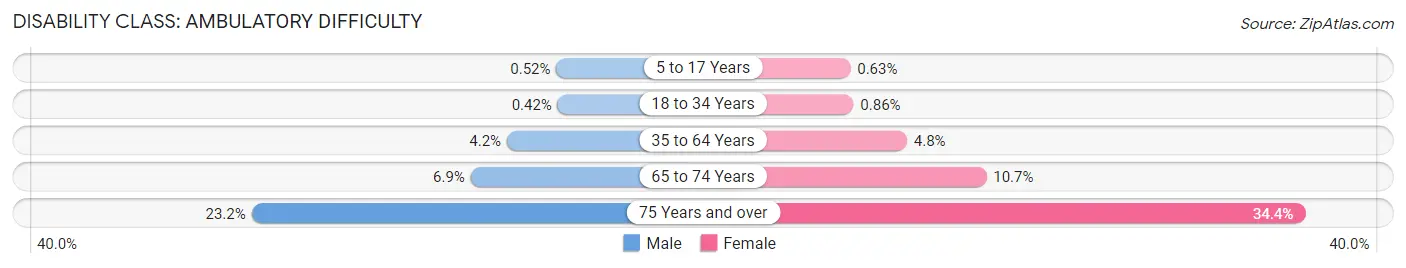
| Age Bracket | Male | Female |
| 5 to 17 Years | 29 (0.5%) | 32 (0.6%) |
| 18 to 34 Years | 45 (0.4%) | 79 (0.9%) |
| 35 to 64 Years | 648 (4.2%) | 795 (4.8%) |
| 65 to 74 Years | 313 (6.9%) | 506 (10.7%) |
| 75 Years and over | 703 (23.2%) | 1,419 (34.4%) |
Disability Class: Self-Care Difficulty
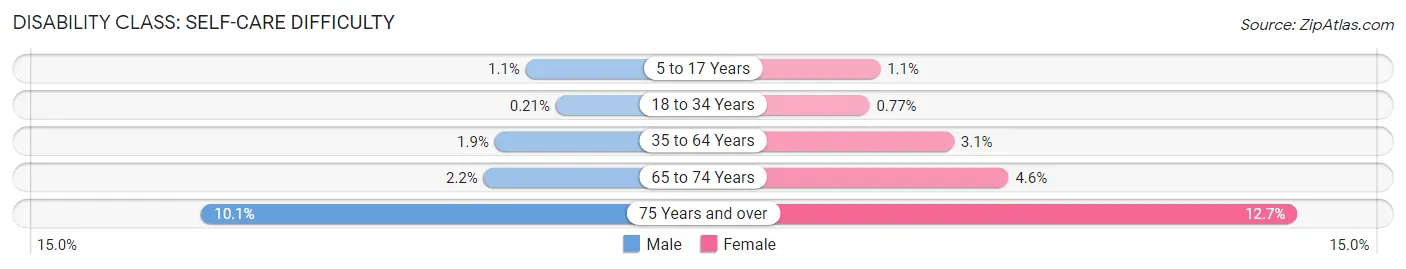
| Age Bracket | Male | Female |
| 5 to 17 Years | 59 (1.1%) | 54 (1.1%) |
| 18 to 34 Years | 23 (0.2%) | 70 (0.8%) |
| 35 to 64 Years | 295 (1.9%) | 513 (3.1%) |
| 65 to 74 Years | 101 (2.2%) | 219 (4.6%) |
| 75 Years and over | 306 (10.1%) | 523 (12.7%) |
Technology Access in Farmington Hills
Computing Device Access in Farmington Hills
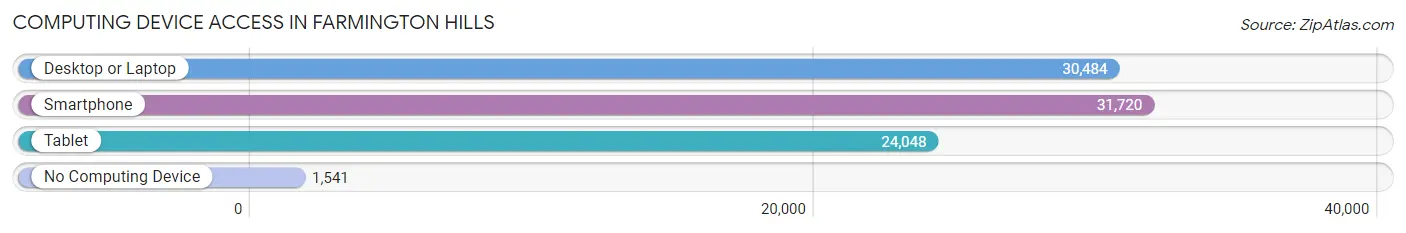
| Device Type | # Households | % Households |
| Desktop or Laptop | 30,484 | 86.2% |
| Smartphone | 31,720 | 89.7% |
| Tablet | 24,048 | 68.0% |
| No Computing Device | 1,541 | 4.4% |
| Total | 35,366 | 100.0% |
Internet Access in Farmington Hills
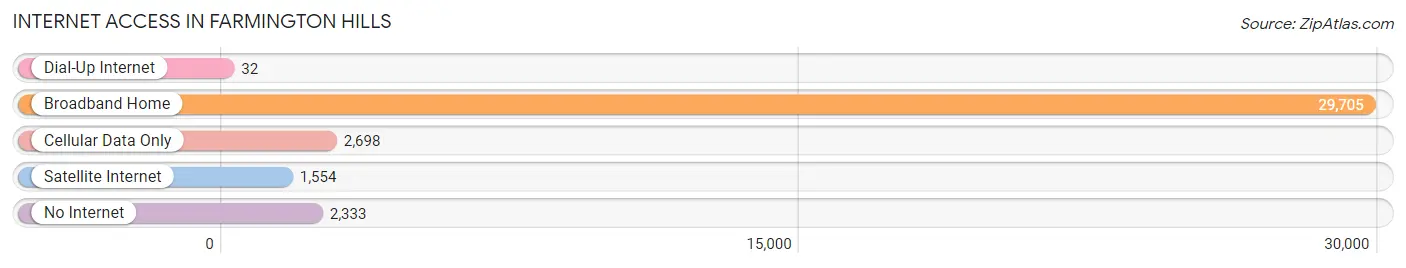
| Internet Type | # Households | % Households |
| Dial-Up Internet | 32 | 0.1% |
| Broadband Home | 29,705 | 84.0% |
| Cellular Data Only | 2,698 | 7.6% |
| Satellite Internet | 1,554 | 4.4% |
| No Internet | 2,333 | 6.6% |
| Total | 35,366 | 100.0% |
Farmington Hills Summary
History
The city of Farmington Hills, Michigan is located in Oakland County, approximately 20 miles northwest of Detroit. The area was first settled in 1824 by a group of settlers from New York. The settlers named the area Farmington after their hometown of Farmington, New York. The area was primarily used for farming and the settlers built a grist mill and saw mill to help support the local economy.
In the late 1800s, the area began to grow and develop as a suburb of Detroit. The city was officially incorporated in 1973 and has since grown to become one of the largest cities in Oakland County.
Geography
Farmington Hills is located in southeastern Michigan, approximately 20 miles northwest of Detroit. The city is situated on the Huron River and is bordered by the cities of Novi, Southfield, and Livonia. The city covers an area of 35.2 square miles and has a population of 79,740 as of the 2010 census.
The city is located in a hilly region and is home to several parks and nature preserves. The city is also home to the Heritage Park, which is a large outdoor recreation area with a variety of activities and amenities.
Economy
Farmington Hills is home to a variety of businesses and industries. The city is home to several corporate headquarters, including the headquarters of the automotive supplier Lear Corporation and the software company Compuware. The city is also home to several medical centers, including the Beaumont Hospital and the Botsford Hospital.
The city is also home to several shopping centers, including the Twelve Oaks Mall and the West Oaks Mall. The city is also home to several restaurants and entertainment venues, including the Farmington Hills Ice Arena and the Farmington Hills Golf Course.
Demographics
As of the 2010 census, the population of Farmington Hills was 79,740. The racial makeup of the city was 79.2% White, 11.3% African American, 0.3% Native American, 4.2% Asian, 0.1% Pacific Islander, and 4.9% from other races. The median household income was $71,945 and the median family income was $86,945.
The city is home to a variety of religious denominations, including Catholic, Protestant, Jewish, and Muslim. The city is also home to a variety of educational institutions, including the University of Michigan-Dearborn, Oakland Community College, and the Farmington Hills School District.
Common Questions
What is Per Capita Income in Farmington Hills?
Per Capita income in Farmington Hills is $53,661.
What is the Median Family Income in Farmington Hills?
Median Family Income in Farmington Hills is $129,403.
What is the Median Household income in Farmington Hills?
Median Household Income in Farmington Hills is $101,728.
What is Income or Wage Gap in Farmington Hills?
Income or Wage Gap in Farmington Hills is 39.3%.
Women in Farmington Hills earn 60.7 cents for every dollar earned by a man.
What is Inequality or Gini Index in Farmington Hills?
Inequality or Gini Index in Farmington Hills is 0.42.
What is the Total Population of Farmington Hills?
Total Population of Farmington Hills is 83,562.
What is the Total Male Population of Farmington Hills?
Total Male Population of Farmington Hills is 41,677.
What is the Total Female Population of Farmington Hills?
Total Female Population of Farmington Hills is 41,885.
What is the Ratio of Males per 100 Females in Farmington Hills?
There are 99.50 Males per 100 Females in Farmington Hills.
What is the Ratio of Females per 100 Males in Farmington Hills?
There are 100.50 Females per 100 Males in Farmington Hills.
What is the Median Population Age in Farmington Hills?
Median Population Age in Farmington Hills is 41.6 Years.
What is the Average Family Size in Farmington Hills
Average Family Size in Farmington Hills is 3.0 People.
What is the Average Household Size in Farmington Hills
Average Household Size in Farmington Hills is 2.3 People.
How Large is the Labor Force in Farmington Hills?
There are 47,506 People in the Labor Forcein in Farmington Hills.
What is the Percentage of People in the Labor Force in Farmington Hills?
67.2% of People are in the Labor Force in Farmington Hills.
What is the Unemployment Rate in Farmington Hills?
Unemployment Rate in Farmington Hills is 4.8%.