Zip Codes with the Highest Percentage of Population Employed in Architecture & Engineering in Waterford, MI
RELATED REPORTS & OPTIONS
Architecture & Engineering
Waterford
Compare Zip Codes
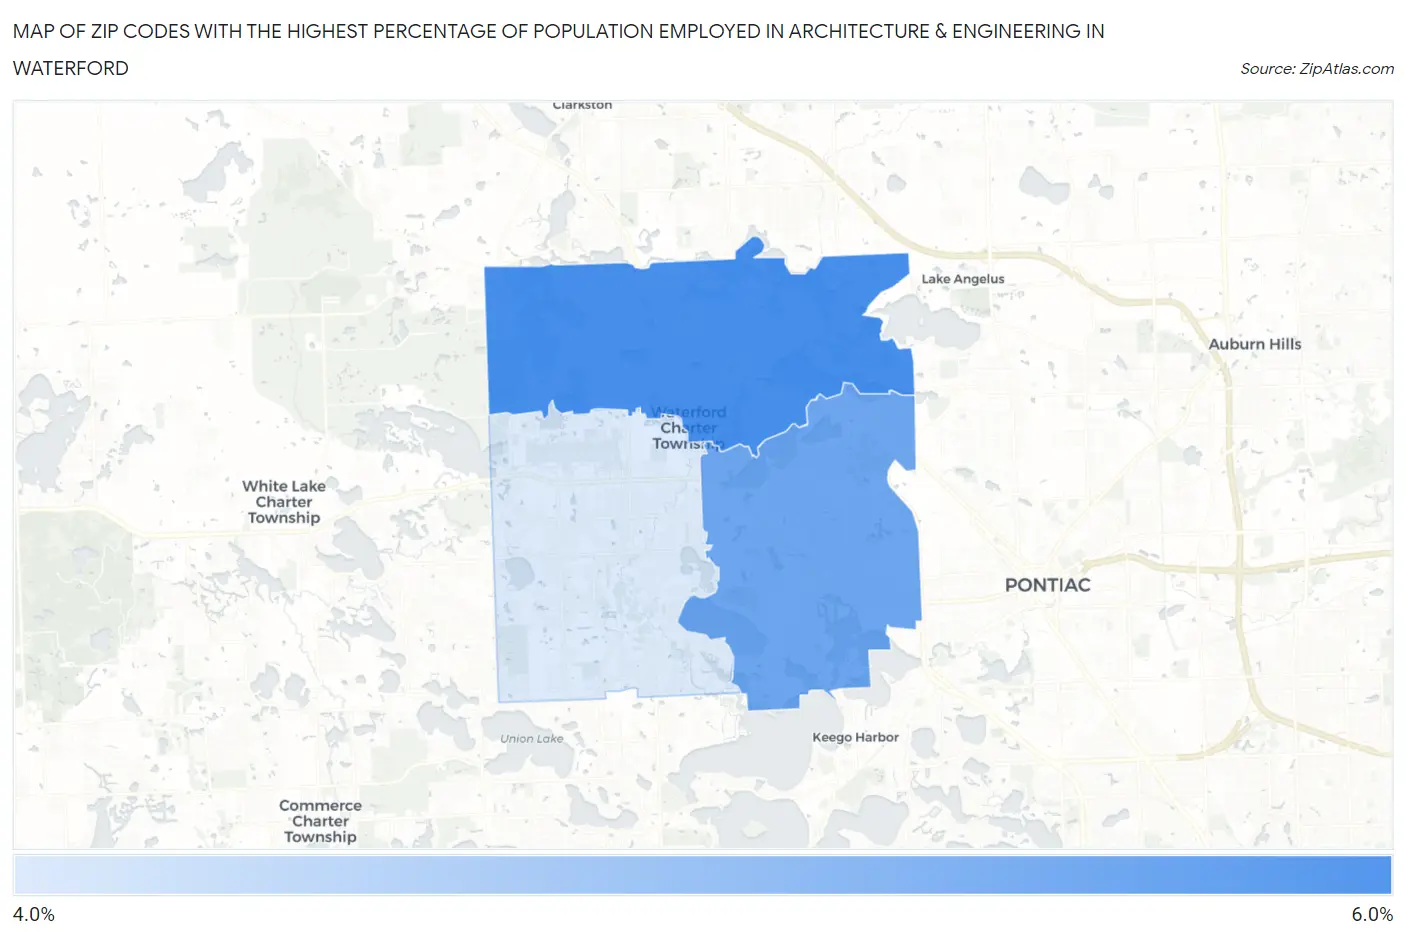
Map of Zip Codes with the Highest Percentage of Population Employed in Architecture & Engineering in Waterford
4.4%
5.5%
Zip Codes with the Highest Percentage of Population Employed in Architecture & Engineering in Waterford, MI
| Zip Code | % Employed | vs State | vs National | |
| 1. | 48329 | 5.5% | 3.4%(+2.11)#97 | 2.1%(+3.33)#1,337 |
| 2. | 48328 | 5.2% | 3.4%(+1.82)#108 | 2.1%(+3.04)#1,520 |
| 3. | 48327 | 4.4% | 3.4%(+1.03)#149 | 2.1%(+2.25)#2,255 |
1
Common Questions
What are the Top Zip Codes with the Highest Percentage of Population Employed in Architecture & Engineering in Waterford, MI?
Top Zip Codes with the Highest Percentage of Population Employed in Architecture & Engineering in Waterford, MI are:
What zip code has the Highest Percentage of Population Employed in Architecture & Engineering in Waterford, MI?
48329 has the Highest Percentage of Population Employed in Architecture & Engineering in Waterford, MI with 5.5%.
What is the Percentage of Population Employed in Architecture & Engineering in Michigan?
Percentage of Population Employed in Architecture & Engineering in Michigan is 3.4%.
What is the Percentage of Population Employed in Architecture & Engineering in the United States?
Percentage of Population Employed in Architecture & Engineering in the United States is 2.1%.