Lake Victoria, MI Map & Demographics
Lake Victoria Map
Lake Victoria Overview
$55,051
PER CAPITA INCOME
$105,865
AVG FAMILY INCOME
$115,714
AVG HOUSEHOLD INCOME
12.1%
WAGE / INCOME GAP [ % ]
87.9¢/ $1
WAGE / INCOME GAP [ $ ]
0.29
INEQUALITY / GINI INDEX
950
TOTAL POPULATION
526
MALE POPULATION
424
FEMALE POPULATION
124.06
MALES / 100 FEMALES
80.61
FEMALES / 100 MALES
49.4
MEDIAN AGE
2.8
AVG FAMILY SIZE
2.3
AVG HOUSEHOLD SIZE
607
LABOR FORCE [ PEOPLE ]
72.0%
PERCENT IN LABOR FORCE
4.3%
UNEMPLOYMENT RATE
Income in Lake Victoria
Income Overview in Lake Victoria
Per Capita Income in Lake Victoria is $55,051, while median incomes of families and households are $105,865 and $115,714 respectively.
| Characteristic | Number | Measure |
| Per Capita Income | 950 | $55,051 |
| Median Family Income | 295 | $105,865 |
| Mean Family Income | 295 | $134,323 |
| Median Household Income | 416 | $115,714 |
| Mean Household Income | 416 | $124,350 |
| Income Deficit | 295 | $0 |
| Wage / Income Gap (%) | 950 | 12.06% |
| Wage / Income Gap ($) | 950 | 87.94¢ per $1 |
| Gini / Inequality Index | 950 | 0.29 |
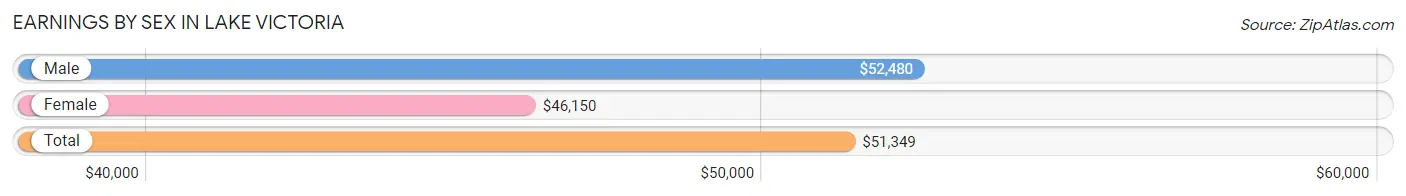
Earnings by Sex in Lake Victoria
Average Earnings in Lake Victoria are $51,349, $52,480 for men and $46,150 for women, a difference of 12.1%.
| Sex | Number | Average Earnings |
| Male | 363 (59.5%) | $52,480 |
| Female | 247 (40.5%) | $46,150 |
| Total | 610 (100.0%) | $51,349 |
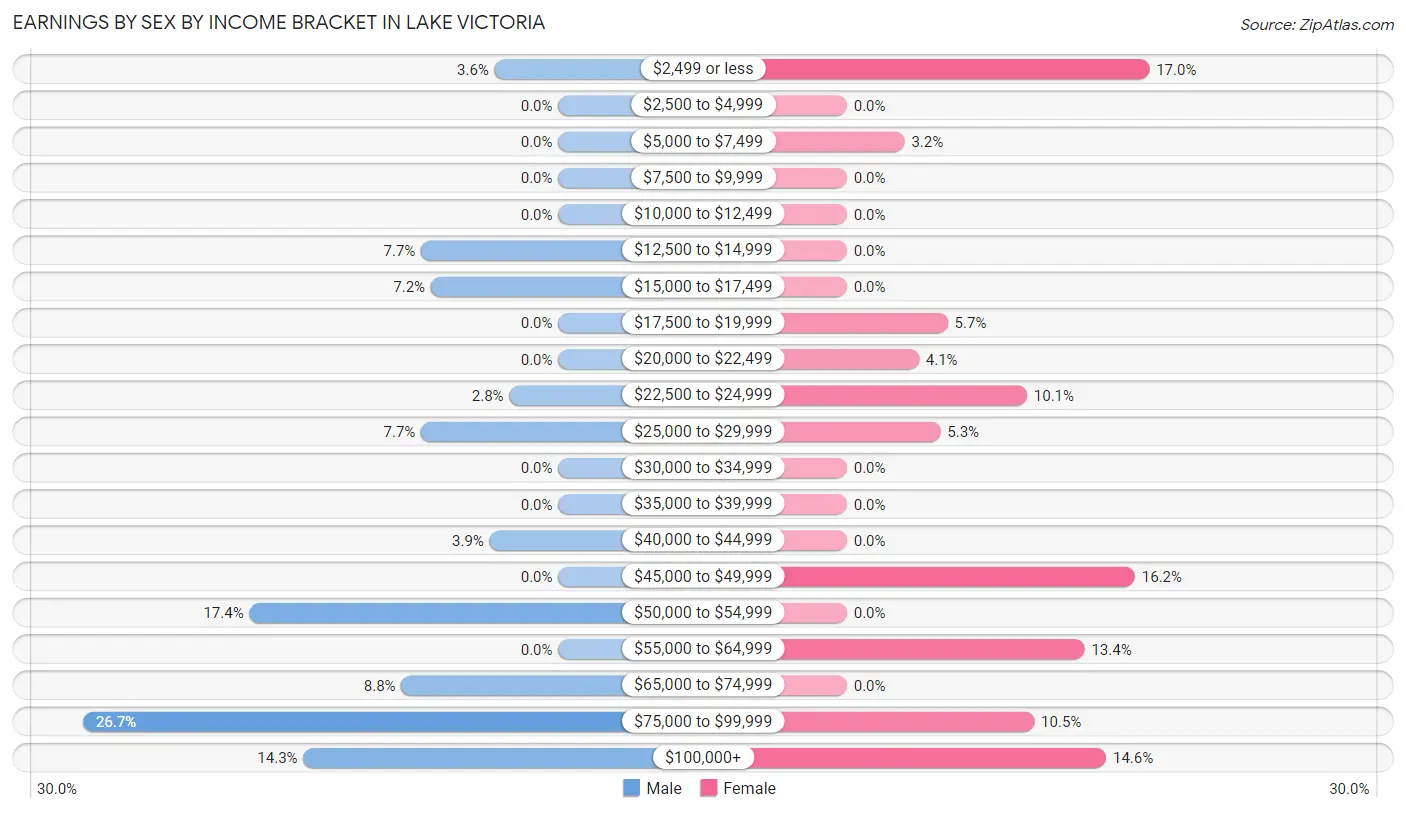
Earnings by Sex by Income Bracket in Lake Victoria
The most common earnings brackets in Lake Victoria are $75,000 to $99,999 for men (97 | 26.7%) and $2,499 or less for women (42 | 17.0%).
| Income | Male | Female |
| $2,499 or less | 13 (3.6%) | 42 (17.0%) |
| $2,500 to $4,999 | 0 (0.0%) | 0 (0.0%) |
| $5,000 to $7,499 | 0 (0.0%) | 8 (3.2%) |
| $7,500 to $9,999 | 0 (0.0%) | 0 (0.0%) |
| $10,000 to $12,499 | 0 (0.0%) | 0 (0.0%) |
| $12,500 to $14,999 | 28 (7.7%) | 0 (0.0%) |
| $15,000 to $17,499 | 26 (7.2%) | 0 (0.0%) |
| $17,500 to $19,999 | 0 (0.0%) | 14 (5.7%) |
| $20,000 to $22,499 | 0 (0.0%) | 10 (4.1%) |
| $22,500 to $24,999 | 10 (2.8%) | 25 (10.1%) |
| $25,000 to $29,999 | 28 (7.7%) | 13 (5.3%) |
| $30,000 to $34,999 | 0 (0.0%) | 0 (0.0%) |
| $35,000 to $39,999 | 0 (0.0%) | 0 (0.0%) |
| $40,000 to $44,999 | 14 (3.9%) | 0 (0.0%) |
| $45,000 to $49,999 | 0 (0.0%) | 40 (16.2%) |
| $50,000 to $54,999 | 63 (17.4%) | 0 (0.0%) |
| $55,000 to $64,999 | 0 (0.0%) | 33 (13.4%) |
| $65,000 to $74,999 | 32 (8.8%) | 0 (0.0%) |
| $75,000 to $99,999 | 97 (26.7%) | 26 (10.5%) |
| $100,000+ | 52 (14.3%) | 36 (14.6%) |
| Total | 363 (100.0%) | 247 (100.0%) |
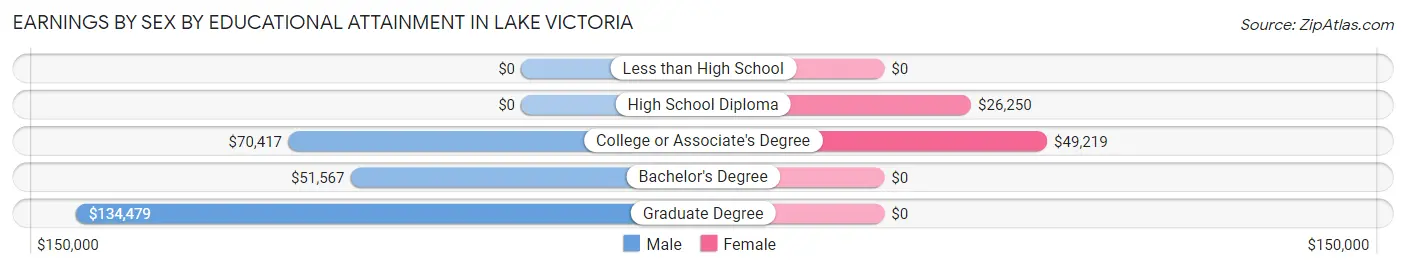
Earnings by Sex by Educational Attainment in Lake Victoria
Average earnings in Lake Victoria are $52,480 for men and $47,000 for women, a difference of 10.4%. Men with an educational attainment of graduate degree enjoy the highest average annual earnings of $134,479, while those with bachelor's degree education earn the least with $51,567. Women with an educational attainment of college or associate's degree earn the most with the average annual earnings of $49,219, while those with high school diploma education have the smallest earnings of $26,250.
| Educational Attainment | Male Income | Female Income |
| Less than High School | - | - |
| High School Diploma | - | - |
| College or Associate's Degree | $70,417 | $49,219 |
| Bachelor's Degree | $51,567 | $0 |
| Graduate Degree | $134,479 | $0 |
| Total | $52,480 | $47,000 |
Family Income in Lake Victoria
Family Income Brackets in Lake Victoria
According to the Lake Victoria family income data, there are 84 families falling into the $75,000 to $99,999 income range, which is the most common income bracket and makes up 28.5% of all families.
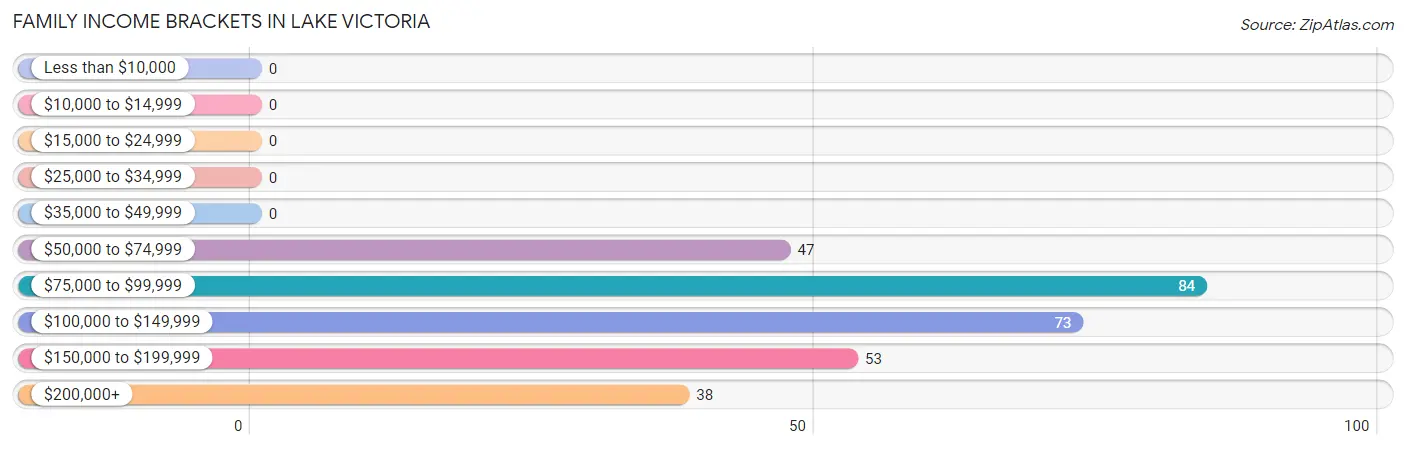
| Income Bracket | # Families | % Families |
| Less than $10,000 | 0 | 0.0% |
| $10,000 to $14,999 | 0 | 0.0% |
| $15,000 to $24,999 | 0 | 0.0% |
| $25,000 to $34,999 | 0 | 0.0% |
| $35,000 to $49,999 | 0 | 0.0% |
| $50,000 to $74,999 | 47 | 15.9% |
| $75,000 to $99,999 | 84 | 28.5% |
| $100,000 to $149,999 | 73 | 24.7% |
| $150,000 to $199,999 | 53 | 18.0% |
| $200,000+ | 38 | 12.9% |
Family Income by Famaliy Size in Lake Victoria
4-person families (32 | 10.8%) account for the highest median family income in Lake Victoria with $190,893 per family, while 2-person families (180 | 61.0%) have the highest median income of $48,150 per family member.
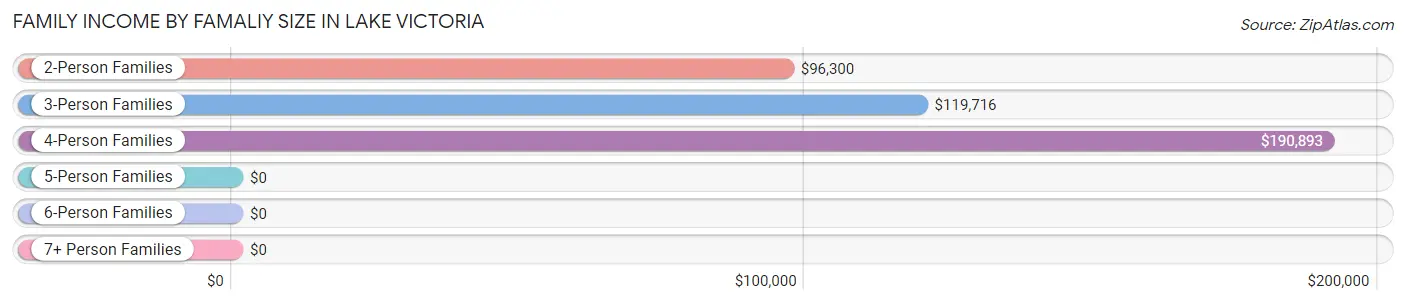
| Income Bracket | # Families | Median Income |
| 2-Person Families | 180 (61.0%) | $96,300 |
| 3-Person Families | 55 (18.6%) | $119,716 |
| 4-Person Families | 32 (10.8%) | $190,893 |
| 5-Person Families | 20 (6.8%) | $0 |
| 6-Person Families | 8 (2.7%) | $0 |
| 7+ Person Families | 0 (0.0%) | $0 |
| Total | 295 (100.0%) | $105,865 |
Family Income by Number of Earners in Lake Victoria
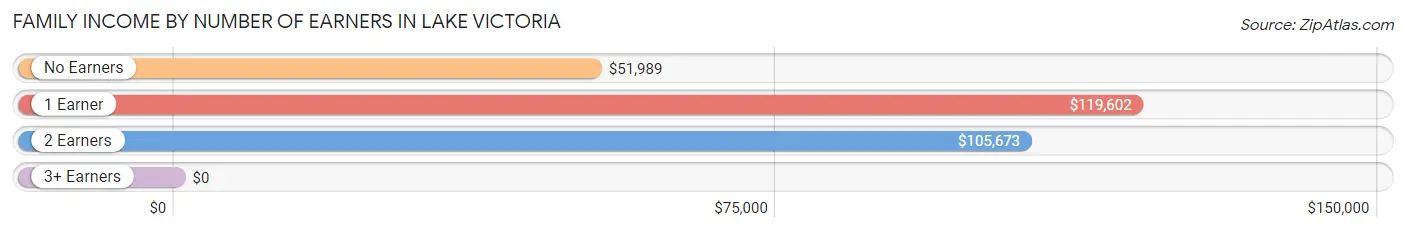
| Number of Earners | # Families | Median Income |
| No Earners | 35 (11.9%) | $51,989 |
| 1 Earner | 69 (23.4%) | $119,602 |
| 2 Earners | 171 (58.0%) | $105,673 |
| 3+ Earners | 20 (6.8%) | $0 |
| Total | 295 (100.0%) | $105,865 |
Household Income in Lake Victoria
Household Income Brackets in Lake Victoria
With 146 households falling in the category, the $100,000 to $149,999 income range is the most frequent in Lake Victoria, accounting for 35.1% of all households.
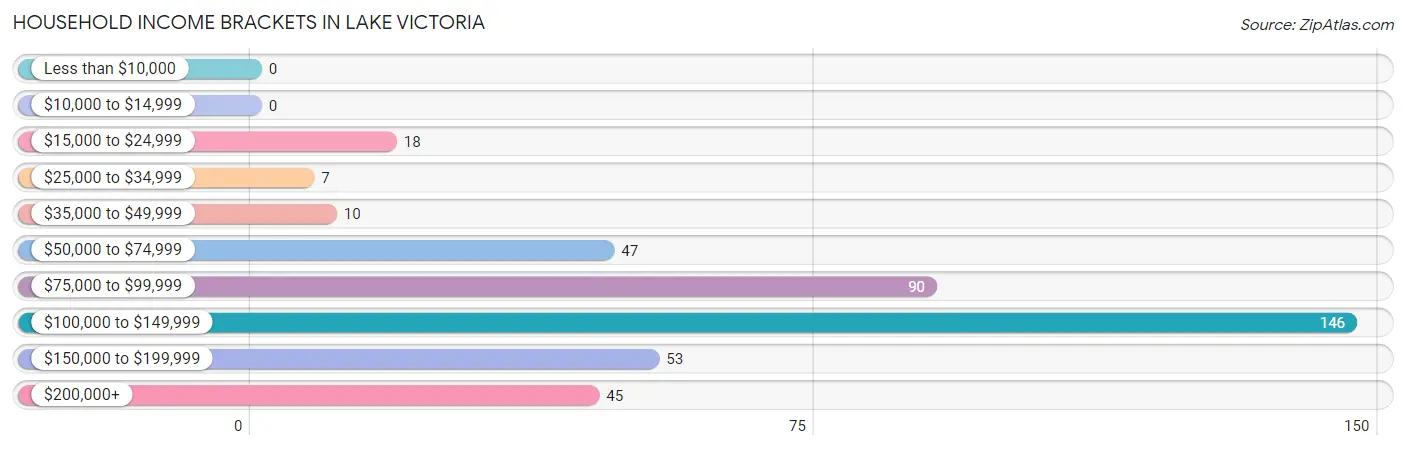
| Income Bracket | # Households | % Households |
| Less than $10,000 | 0 | 0.0% |
| $10,000 to $14,999 | 0 | 0.0% |
| $15,000 to $24,999 | 18 | 4.3% |
| $25,000 to $34,999 | 7 | 1.7% |
| $35,000 to $49,999 | 10 | 2.4% |
| $50,000 to $74,999 | 47 | 11.3% |
| $75,000 to $99,999 | 90 | 21.6% |
| $100,000 to $149,999 | 146 | 35.1% |
| $150,000 to $199,999 | 53 | 12.7% |
| $200,000+ | 45 | 10.8% |
Household Income by Householder Age in Lake Victoria
The median household income in Lake Victoria is $115,714, with the highest median household income of $127,659 found in the 65+ years age bracket for the primary householder. A total of 132 households (31.7%) fall into this category.
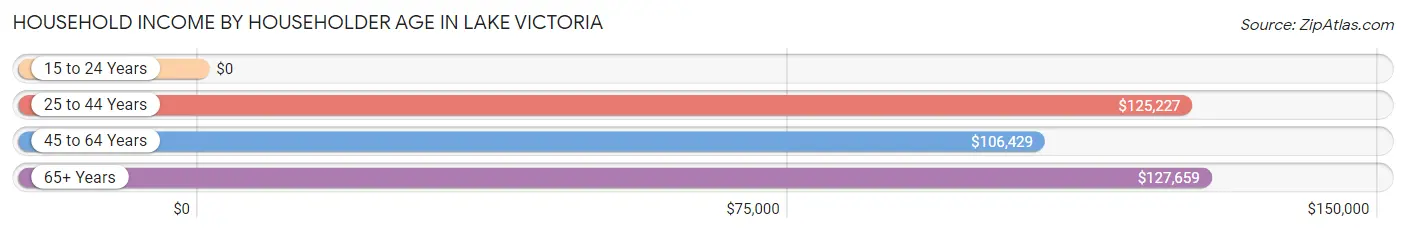
| Income Bracket | # Households | Median Income |
| 15 to 24 Years | 0 (0.0%) | $0 |
| 25 to 44 Years | 84 (20.2%) | $125,227 |
| 45 to 64 Years | 200 (48.1%) | $106,429 |
| 65+ Years | 132 (31.7%) | $127,659 |
| Total | 416 (100.0%) | $115,714 |
Poverty in Lake Victoria
Income Below Poverty by Sex and Age in Lake Victoria
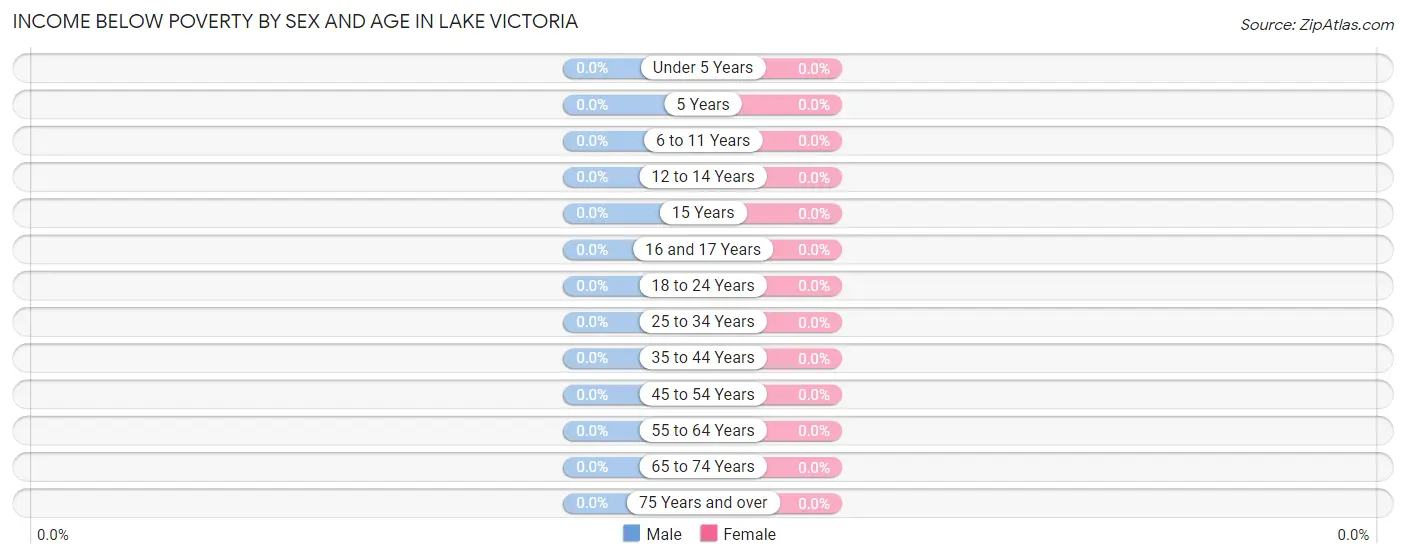
| Age Bracket | Male | Female |
| Under 5 Years | 0 (0.0%) | 0 (0.0%) |
| 5 Years | 0 (0.0%) | 0 (0.0%) |
| 6 to 11 Years | 0 (0.0%) | 0 (0.0%) |
| 12 to 14 Years | 0 (0.0%) | 0 (0.0%) |
| 15 Years | 0 (0.0%) | 0 (0.0%) |
| 16 and 17 Years | 0 (0.0%) | 0 (0.0%) |
| 18 to 24 Years | 0 (0.0%) | 0 (0.0%) |
| 25 to 34 Years | 0 (0.0%) | 0 (0.0%) |
| 35 to 44 Years | 0 (0.0%) | 0 (0.0%) |
| 45 to 54 Years | 0 (0.0%) | 0 (0.0%) |
| 55 to 64 Years | 0 (0.0%) | 0 (0.0%) |
| 65 to 74 Years | 0 (0.0%) | 0 (0.0%) |
| 75 Years and over | 0 (0.0%) | 0 (0.0%) |
| Total | 0 (0.0%) | 0 (0.0%) |
Income Above Poverty by Sex and Age in Lake Victoria
According to the poverty statistics in Lake Victoria, males aged 6 to 11 years and females aged 6 to 11 years are the age groups that are most secure financially, with 100.0% of males and 100.0% of females in these age groups living above the poverty line.
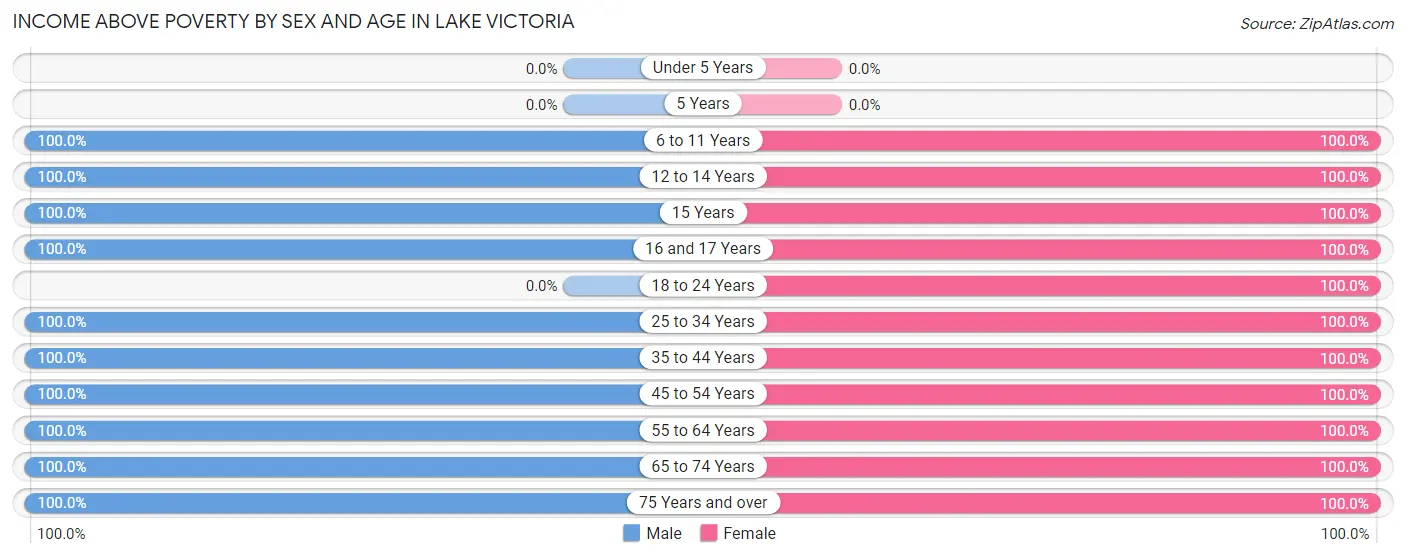
| Age Bracket | Male | Female |
| Under 5 Years | 0 (0.0%) | 0 (0.0%) |
| 5 Years | 0 (0.0%) | 0 (0.0%) |
| 6 to 11 Years | 20 (100.0%) | 37 (100.0%) |
| 12 to 14 Years | 18 (100.0%) | 15 (100.0%) |
| 15 Years | 10 (100.0%) | 7 (100.0%) |
| 16 and 17 Years | 12 (100.0%) | 32 (100.0%) |
| 18 to 24 Years | 0 (0.0%) | 7 (100.0%) |
| 25 to 34 Years | 68 (100.0%) | 50 (100.0%) |
| 35 to 44 Years | 66 (100.0%) | 44 (100.0%) |
| 45 to 54 Years | 132 (100.0%) | 96 (100.0%) |
| 55 to 64 Years | 71 (100.0%) | 72 (100.0%) |
| 65 to 74 Years | 109 (100.0%) | 29 (100.0%) |
| 75 Years and over | 20 (100.0%) | 35 (100.0%) |
| Total | 526 (100.0%) | 424 (100.0%) |
Income Below Poverty Among Married-Couple Families in Lake Victoria
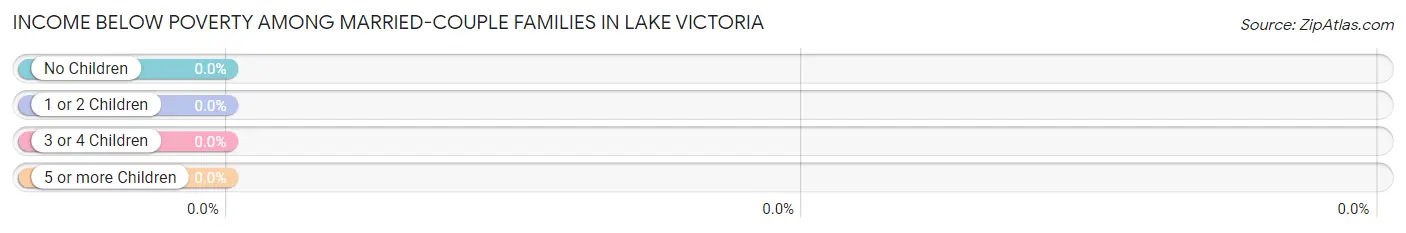
| Children | Above Poverty | Below Poverty |
| No Children | 216 (100.0%) | 0 (0.0%) |
| 1 or 2 Children | 47 (100.0%) | 0 (0.0%) |
| 3 or 4 Children | 18 (100.0%) | 0 (0.0%) |
| 5 or more Children | 0 (0.0%) | 0 (0.0%) |
| Total | 281 (100.0%) | 0 (0.0%) |
Income Below Poverty Among Single-Parent Households in Lake Victoria
| Children | Single Father | Single Mother |
| No Children | 0 (0.0%) | 0 (0.0%) |
| 1 or 2 Children | 0 (0.0%) | 0 (0.0%) |
| 3 or 4 Children | 0 (0.0%) | 0 (0.0%) |
| 5 or more Children | 0 (0.0%) | 0 (0.0%) |
| Total | 0 (0.0%) | 0 (0.0%) |
Income Below Poverty Among Married-Couple vs Single-Parent Households in Lake Victoria
| Children | Married-Couple Families | Single-Parent Households |
| No Children | 0 (0.0%) | 0 (0.0%) |
| 1 or 2 Children | 0 (0.0%) | 0 (0.0%) |
| 3 or 4 Children | 0 (0.0%) | 0 (0.0%) |
| 5 or more Children | 0 (0.0%) | 0 (0.0%) |
| Total | 0 (0.0%) | 0 (0.0%) |
Race in Lake Victoria
The most populous races in Lake Victoria are White / Caucasian (914 | 96.2%), Two or more Races (36 | 3.8%), and Hispanic or Latino (10 | 1.1%).
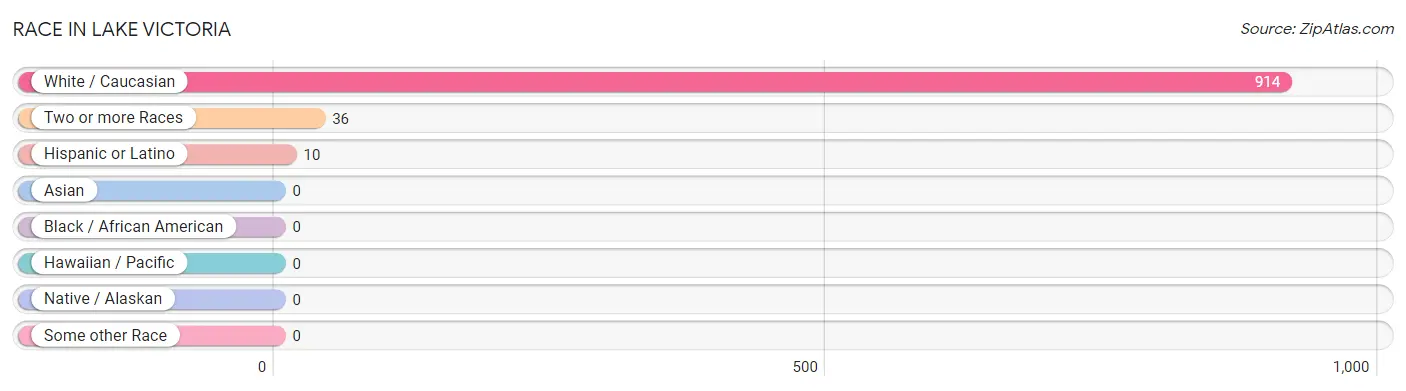
| Race | # Population | % Population |
| Asian | 0 | 0.0% |
| Black / African American | 0 | 0.0% |
| Hawaiian / Pacific | 0 | 0.0% |
| Hispanic or Latino | 10 | 1.1% |
| Native / Alaskan | 0 | 0.0% |
| White / Caucasian | 914 | 96.2% |
| Two or more Races | 36 | 3.8% |
| Some other Race | 0 | 0.0% |
| Total | 950 | 100.0% |
Ancestry in Lake Victoria
The most populous ancestries reported in Lake Victoria are German (431 | 45.4%), Irish (162 | 17.1%), Polish (121 | 12.7%), English (104 | 11.0%), and Italian (47 | 5.0%), together accounting for 91.1% of all Lake Victoria residents.
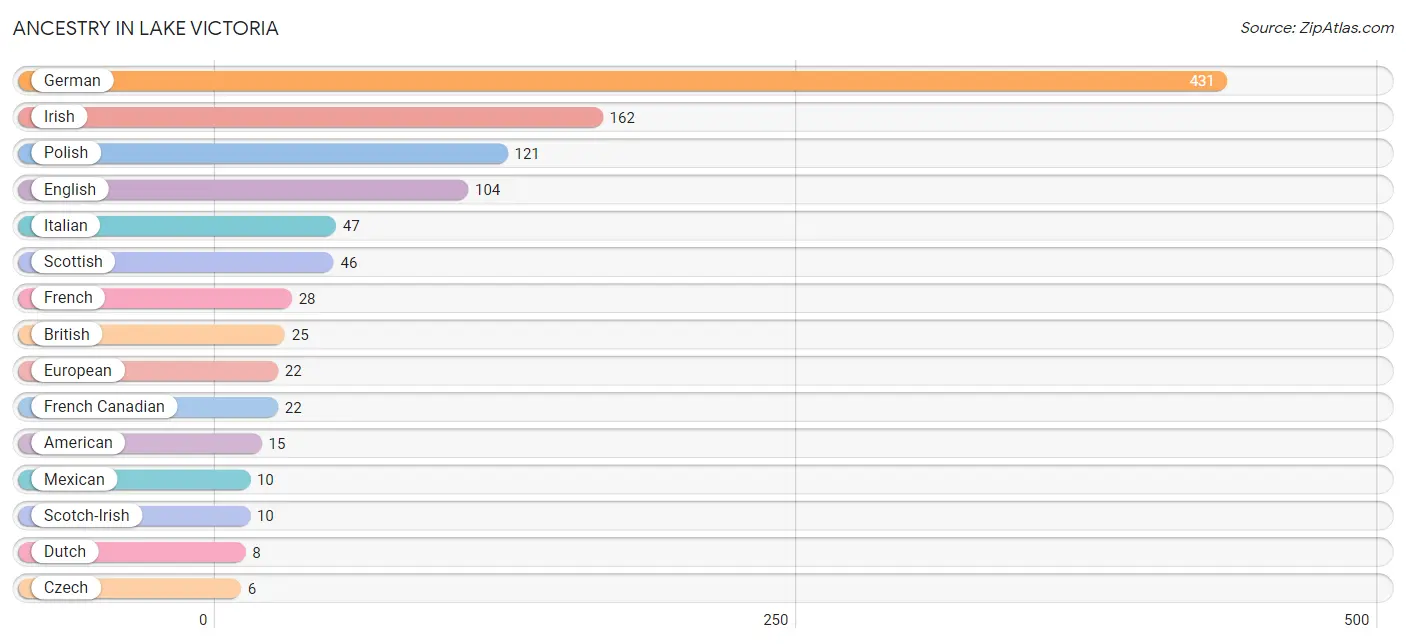
| Ancestry | # Population | % Population |
| American | 15 | 1.6% |
| British | 25 | 2.6% |
| Czech | 6 | 0.6% |
| Dutch | 8 | 0.8% |
| English | 104 | 11.0% |
| European | 22 | 2.3% |
| French | 28 | 2.9% |
| French Canadian | 22 | 2.3% |
| German | 431 | 45.4% |
| Irish | 162 | 17.1% |
| Italian | 47 | 5.0% |
| Mexican | 10 | 1.1% |
| Polish | 121 | 12.7% |
| Scotch-Irish | 10 | 1.1% |
| Scottish | 46 | 4.8% | View All 15 Rows |
Immigrants in Lake Victoria

| Immigration Origin | # Population | % Population | View All 0 Rows |
Sex and Age in Lake Victoria
Sex and Age in Lake Victoria
The most populous age groups in Lake Victoria are 65 to 69 Years (94 | 17.9%) for men and 50 to 54 Years (67 | 15.8%) for women.
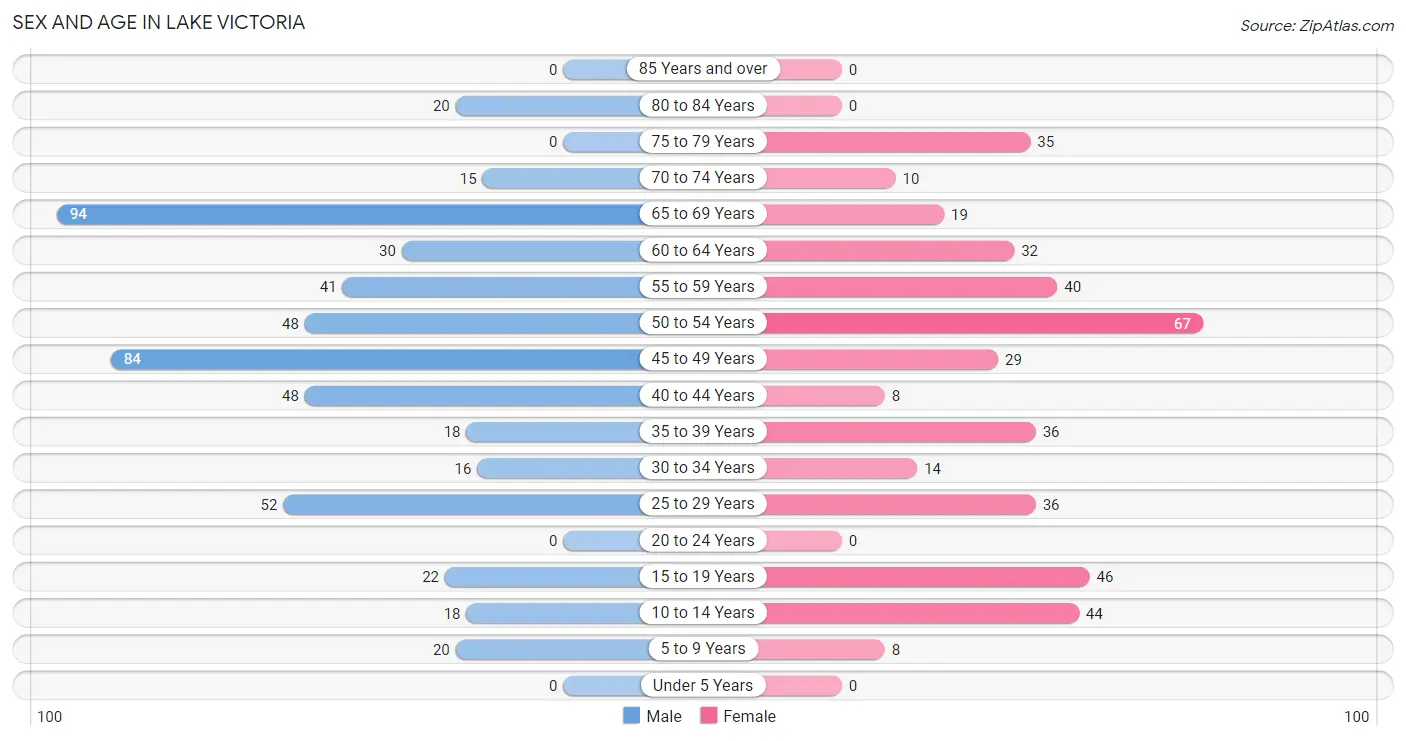
| Age Bracket | Male | Female |
| Under 5 Years | 0 (0.0%) | 0 (0.0%) |
| 5 to 9 Years | 20 (3.8%) | 8 (1.9%) |
| 10 to 14 Years | 18 (3.4%) | 44 (10.4%) |
| 15 to 19 Years | 22 (4.2%) | 46 (10.8%) |
| 20 to 24 Years | 0 (0.0%) | 0 (0.0%) |
| 25 to 29 Years | 52 (9.9%) | 36 (8.5%) |
| 30 to 34 Years | 16 (3.0%) | 14 (3.3%) |
| 35 to 39 Years | 18 (3.4%) | 36 (8.5%) |
| 40 to 44 Years | 48 (9.1%) | 8 (1.9%) |
| 45 to 49 Years | 84 (16.0%) | 29 (6.8%) |
| 50 to 54 Years | 48 (9.1%) | 67 (15.8%) |
| 55 to 59 Years | 41 (7.8%) | 40 (9.4%) |
| 60 to 64 Years | 30 (5.7%) | 32 (7.5%) |
| 65 to 69 Years | 94 (17.9%) | 19 (4.5%) |
| 70 to 74 Years | 15 (2.9%) | 10 (2.4%) |
| 75 to 79 Years | 0 (0.0%) | 35 (8.3%) |
| 80 to 84 Years | 20 (3.8%) | 0 (0.0%) |
| 85 Years and over | 0 (0.0%) | 0 (0.0%) |
| Total | 526 (100.0%) | 424 (100.0%) |
Families and Households in Lake Victoria
Median Family Size in Lake Victoria
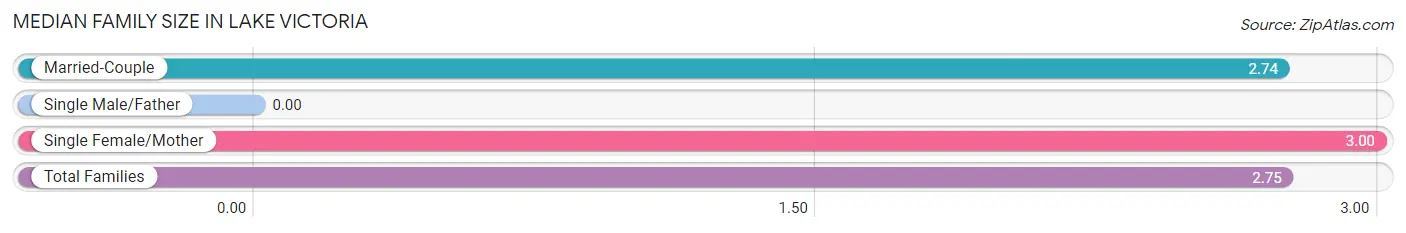
| Family Type | # Families | Family Size |
| Married-Couple | 281 (95.3%) | 2.74 |
| Single Male/Father | 0 (0.0%) | - |
| Single Female/Mother | 14 (4.8%) | 3.00 |
| Total Families | 295 (100.0%) | 2.75 |
Median Household Size in Lake Victoria
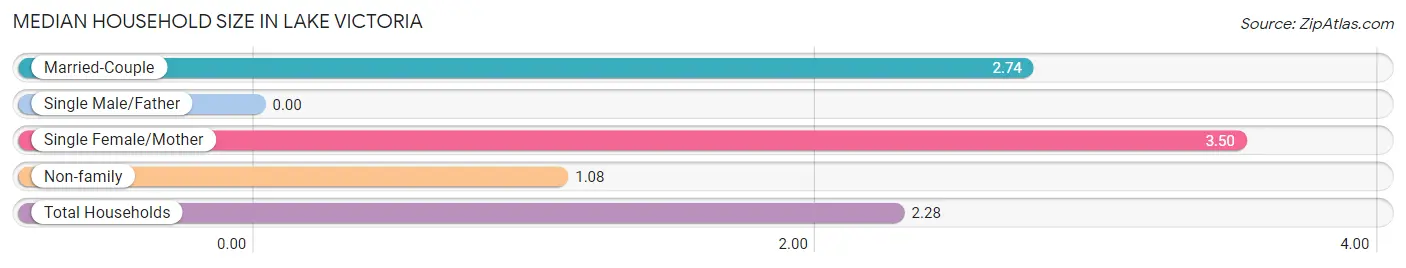
| Household Type | # Households | Household Size |
| Married-Couple | 281 (67.5%) | 2.74 |
| Single Male/Father | 0 (0.0%) | - |
| Single Female/Mother | 14 (3.4%) | 3.50 |
| Non-family | 121 (29.1%) | 1.08 |
| Total Households | 416 (100.0%) | 2.28 |
Household Size by Marriage Status in Lake Victoria
Out of a total of 416 households in Lake Victoria, 295 (70.9%) are family households, while 121 (29.1%) are nonfamily households. The most numerous type of family households are 2-person households, comprising 180, and the most common type of nonfamily households are 1-person households, comprising 113.
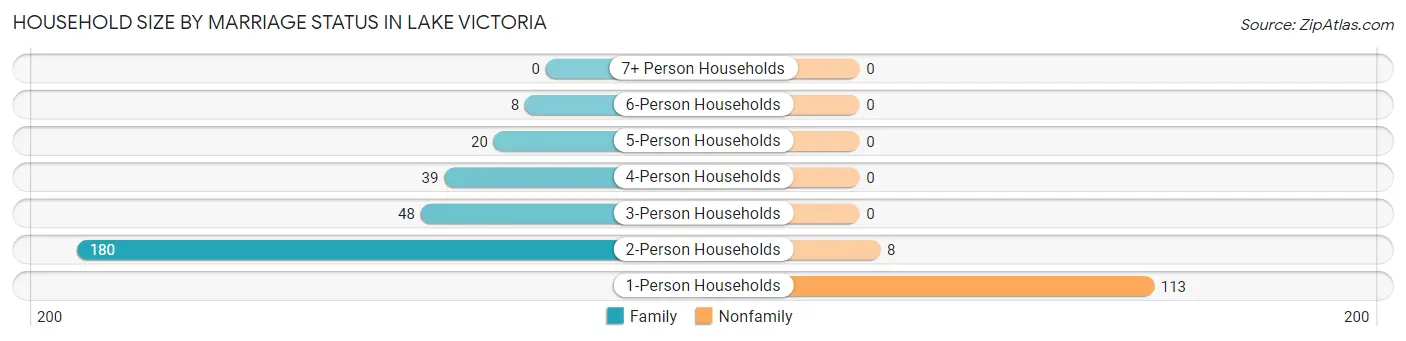
| Household Size | Family Households | Nonfamily Households |
| 1-Person Households | - | 113 (27.2%) |
| 2-Person Households | 180 (43.3%) | 8 (1.9%) |
| 3-Person Households | 48 (11.5%) | 0 (0.0%) |
| 4-Person Households | 39 (9.4%) | 0 (0.0%) |
| 5-Person Households | 20 (4.8%) | 0 (0.0%) |
| 6-Person Households | 8 (1.9%) | 0 (0.0%) |
| 7+ Person Households | 0 (0.0%) | 0 (0.0%) |
| Total | 295 (70.9%) | 121 (29.1%) |
Female Fertility in Lake Victoria
Fertility by Age in Lake Victoria
| Age Bracket | Women with Births | Births / 1,000 Women |
| 15 to 19 years | 0 (0.0%) | 0.0 |
| 20 to 34 years | 0 (0.0%) | 0.0 |
| 35 to 50 years | 0 (0.0%) | 0.0 |
| Total | 0 (0.0%) | 0.0 |
Fertility by Age by Marriage Status in Lake Victoria
| Age Bracket | Married | Unmarried |
| 15 to 19 years | 0 (0.0%) | 0 (0.0%) |
| 20 to 34 years | 0 (0.0%) | 0 (0.0%) |
| 35 to 50 years | 0 (0.0%) | 0 (0.0%) |
| Total | 0 (0.0%) | 0 (0.0%) |
Fertility by Education in Lake Victoria
| Educational Attainment | Women with Births | Births / 1,000 Women |
| Less than High School | 0 (0.0%) | 0.0 |
| High School Diploma | 0 (0.0%) | 0.0 |
| College or Associate's Degree | 0 (0.0%) | 0.0 |
| Bachelor's Degree | 0 (0.0%) | 0.0 |
| Graduate Degree | 0 (0.0%) | 0.0 |
| Total | 0 (0.0%) | 0.0 |
Fertility by Education by Marriage Status in Lake Victoria
| Educational Attainment | Married | Unmarried |
| Less than High School | 0 (0.0%) | 0 (0.0%) |
| High School Diploma | 0 (0.0%) | 0 (0.0%) |
| College or Associate's Degree | 0 (0.0%) | 0 (0.0%) |
| Bachelor's Degree | 0 (0.0%) | 0 (0.0%) |
| Graduate Degree | 0 (0.0%) | 0 (0.0%) |
| Total | 0 (0.0%) | 0 (0.0%) |
Employment Characteristics in Lake Victoria
Employment by Class of Employer in Lake Victoria
Among the 581 employed individuals in Lake Victoria, private company employees (284 | 48.9%), state government employees (119 | 20.5%), and local government employees (77 | 13.3%) make up the most common classes of employment.
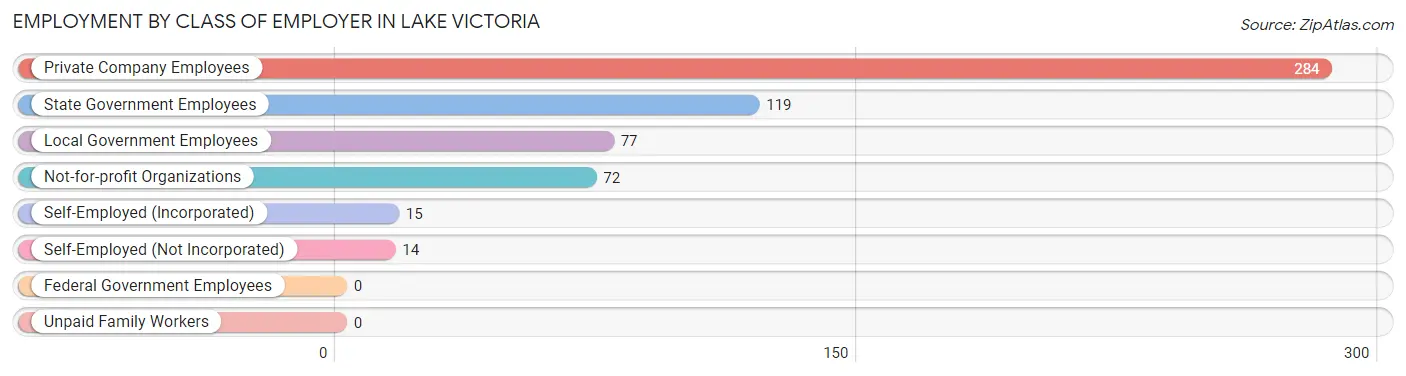
| Employer Class | # Employees | % Employees |
| Private Company Employees | 284 | 48.9% |
| Self-Employed (Incorporated) | 15 | 2.6% |
| Self-Employed (Not Incorporated) | 14 | 2.4% |
| Not-for-profit Organizations | 72 | 12.4% |
| Local Government Employees | 77 | 13.3% |
| State Government Employees | 119 | 20.5% |
| Federal Government Employees | 0 | 0.0% |
| Unpaid Family Workers | 0 | 0.0% |
| Total | 581 | 100.0% |
Employment Status by Age in Lake Victoria
According to the labor force statistics for Lake Victoria, out of the total population over 16 years of age (843), 72.0% or 607 individuals are in the labor force, with 4.3% or 26 of them unemployed. The age group with the highest labor force participation rate is 25 to 29 years, with 100.0% or 88 individuals in the labor force. Within the labor force, the 45 to 54 years age range has the highest percentage of unemployed individuals, with 8.7% or 18 of them being unemployed.
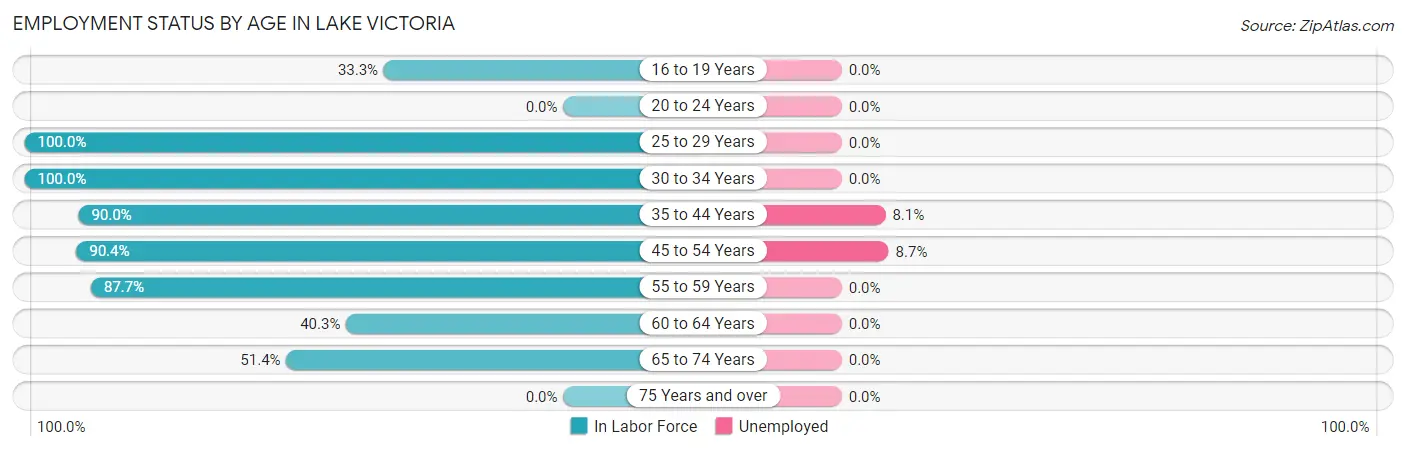
| Age Bracket | In Labor Force | Unemployed |
| 16 to 19 Years | 17 (33.3%) | 0 (0.0%) |
| 20 to 24 Years | 0 (0.0%) | 0 (0.0%) |
| 25 to 29 Years | 88 (100.0%) | 0 (0.0%) |
| 30 to 34 Years | 30 (100.0%) | 0 (0.0%) |
| 35 to 44 Years | 99 (90.0%) | 8 (8.1%) |
| 45 to 54 Years | 206 (90.4%) | 18 (8.7%) |
| 55 to 59 Years | 71 (87.7%) | 0 (0.0%) |
| 60 to 64 Years | 25 (40.3%) | 0 (0.0%) |
| 65 to 74 Years | 71 (51.4%) | 0 (0.0%) |
| 75 Years and over | 0 (0.0%) | 0 (0.0%) |
| Total | 607 (72.0%) | 26 (4.3%) |
Employment Status by Educational Attainment in Lake Victoria
According to labor force statistics for Lake Victoria, 86.6% of individuals (519) out of the total population between 25 and 64 years of age (599) are in the labor force, with 5.0% or 26 of them being unemployed. The group with the highest labor force participation rate are those with the educational attainment of high school diploma, with 100.0% or 41 individuals in the labor force. Within the labor force, individuals with bachelor's degree or higher education have the highest percentage of unemployment, with 12.0% or 26 of them being unemployed.
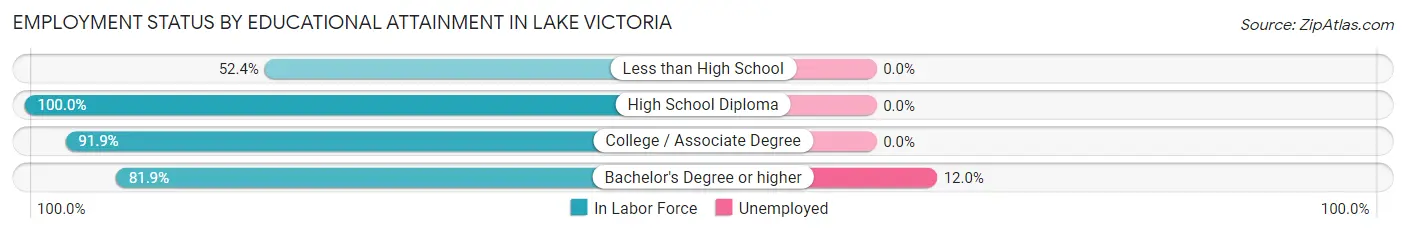
| Educational Attainment | In Labor Force | Unemployed |
| Less than High School | 11 (52.4%) | 0 (0.0%) |
| High School Diploma | 41 (100.0%) | 0 (0.0%) |
| College / Associate Degree | 250 (91.9%) | 0 (0.0%) |
| Bachelor's Degree or higher | 217 (81.9%) | 32 (12.0%) |
| Total | 519 (86.6%) | 30 (5.0%) |
Employment Occupations by Sex in Lake Victoria
Management, Business, Science and Arts Occupations
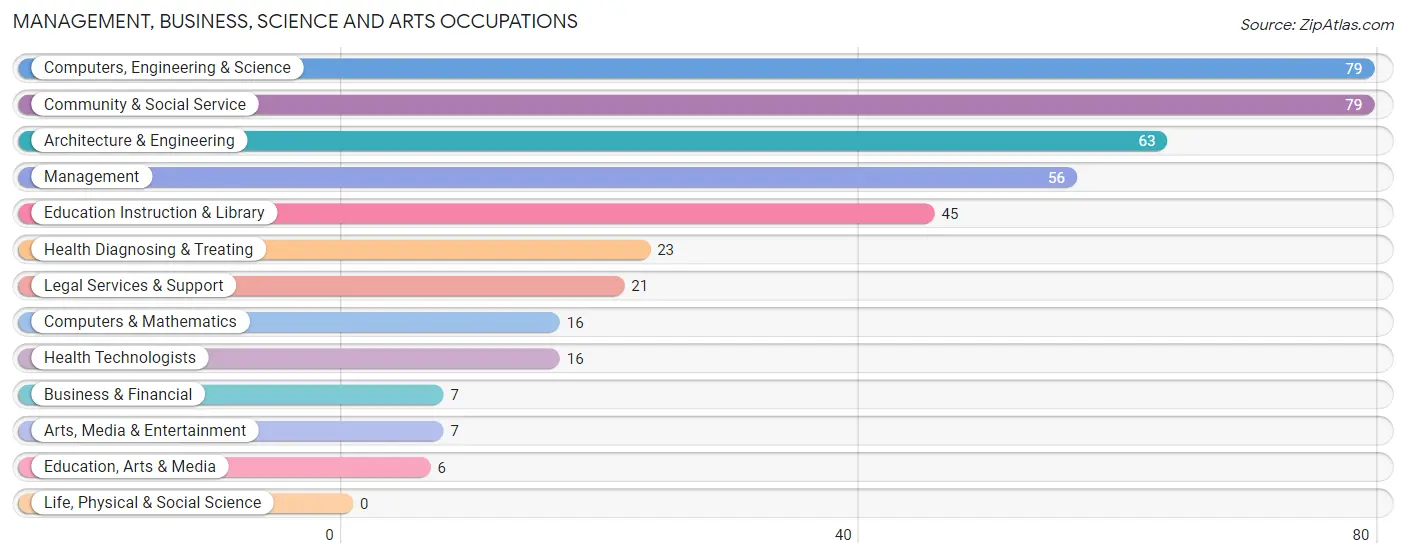
The most common Management, Business, Science and Arts occupations in Lake Victoria are Computers, Engineering & Science (79 | 13.6%), Community & Social Service (79 | 13.6%), Architecture & Engineering (63 | 10.8%), Management (56 | 9.6%), and Education Instruction & Library (45 | 7.7%).
Management, Business, Science and Arts Occupations by Sex
Within the Management, Business, Science and Arts occupations in Lake Victoria, the most male-oriented occupations are Architecture & Engineering (100.0%), Legal Services & Support (100.0%), and Computers, Engineering & Science (88.6%), while the most female-oriented occupations are Business & Financial (100.0%), Education, Arts & Media (100.0%), and Education Instruction & Library (100.0%).
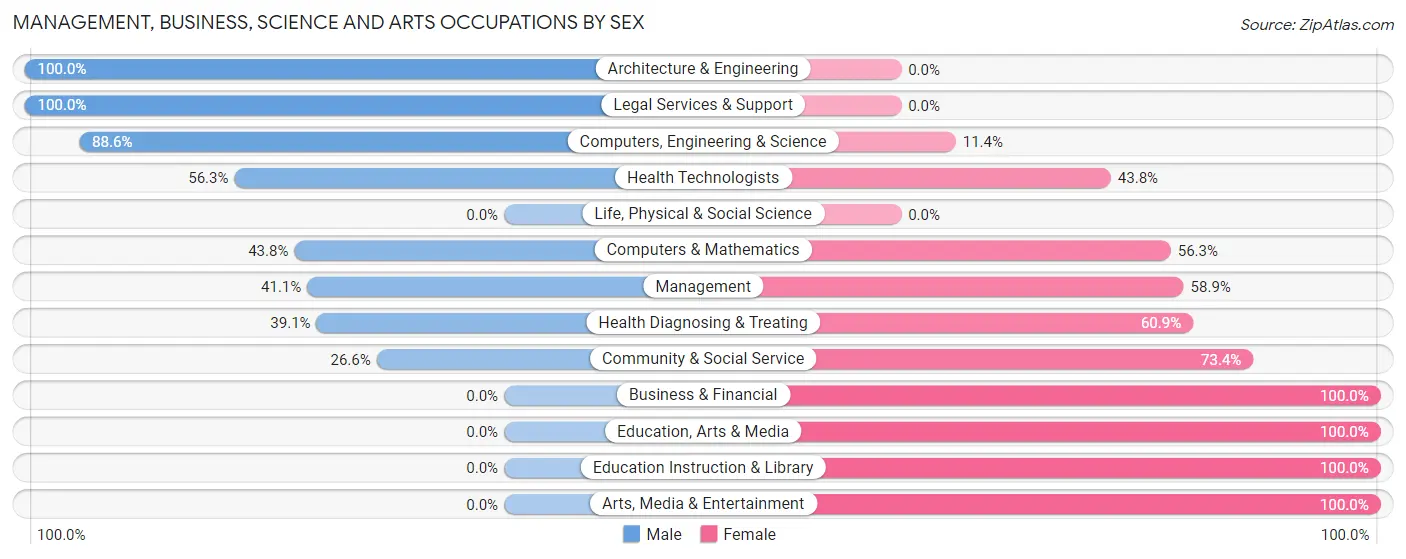
| Occupation | Male | Female |
| Management | 23 (41.1%) | 33 (58.9%) |
| Business & Financial | 0 (0.0%) | 7 (100.0%) |
| Computers, Engineering & Science | 70 (88.6%) | 9 (11.4%) |
| Computers & Mathematics | 7 (43.8%) | 9 (56.2%) |
| Architecture & Engineering | 63 (100.0%) | 0 (0.0%) |
| Life, Physical & Social Science | 0 (0.0%) | 0 (0.0%) |
| Community & Social Service | 21 (26.6%) | 58 (73.4%) |
| Education, Arts & Media | 0 (0.0%) | 6 (100.0%) |
| Legal Services & Support | 21 (100.0%) | 0 (0.0%) |
| Education Instruction & Library | 0 (0.0%) | 45 (100.0%) |
| Arts, Media & Entertainment | 0 (0.0%) | 7 (100.0%) |
| Health Diagnosing & Treating | 9 (39.1%) | 14 (60.9%) |
| Health Technologists | 9 (56.2%) | 7 (43.8%) |
| Total (Category) | 123 (50.4%) | 121 (49.6%) |
| Total (Overall) | 348 (59.9%) | 233 (40.1%) |
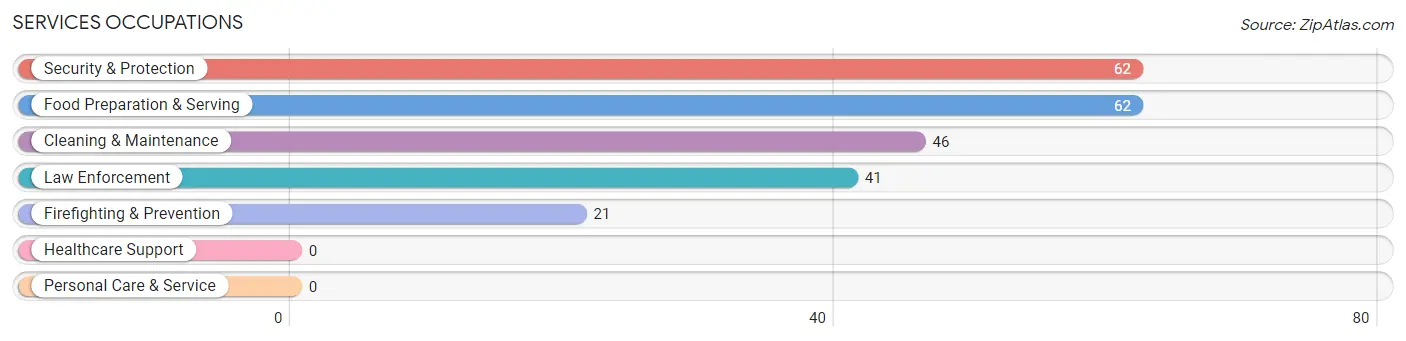
Services Occupations
The most common Services occupations in Lake Victoria are Security & Protection (62 | 10.7%), Food Preparation & Serving (62 | 10.7%), Cleaning & Maintenance (46 | 7.9%), Law Enforcement (41 | 7.1%), and Firefighting & Prevention (21 | 3.6%).
Services Occupations by Sex
Within the Services occupations in Lake Victoria, the most male-oriented occupations are Firefighting & Prevention (100.0%), Food Preparation & Serving (82.3%), and Security & Protection (67.7%), while the most female-oriented occupations are Cleaning & Maintenance (58.7%), Law Enforcement (48.8%), and Security & Protection (32.3%).
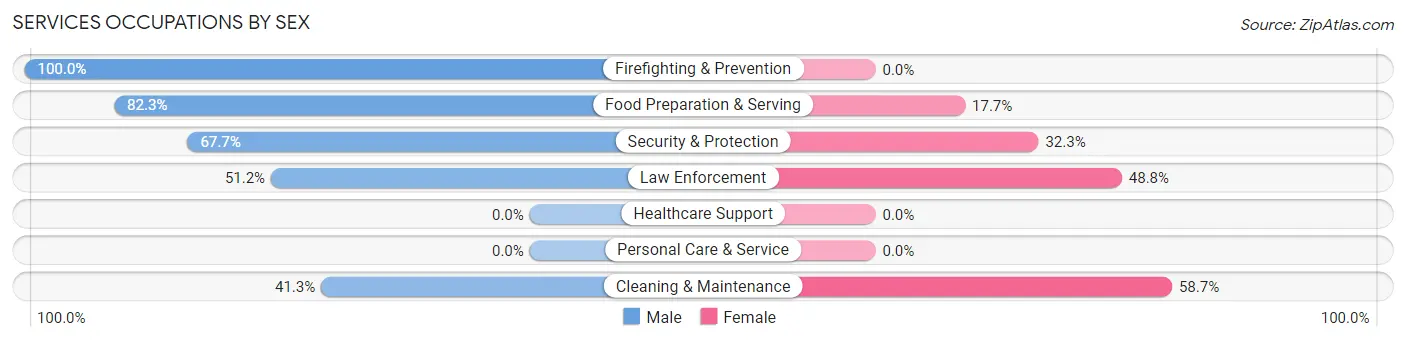
| Occupation | Male | Female |
| Healthcare Support | 0 (0.0%) | 0 (0.0%) |
| Security & Protection | 42 (67.7%) | 20 (32.3%) |
| Firefighting & Prevention | 21 (100.0%) | 0 (0.0%) |
| Law Enforcement | 21 (51.2%) | 20 (48.8%) |
| Food Preparation & Serving | 51 (82.3%) | 11 (17.7%) |
| Cleaning & Maintenance | 19 (41.3%) | 27 (58.7%) |
| Personal Care & Service | 0 (0.0%) | 0 (0.0%) |
| Total (Category) | 112 (65.9%) | 58 (34.1%) |
| Total (Overall) | 348 (59.9%) | 233 (40.1%) |
Sales and Office Occupations
The most common Sales and Office occupations in Lake Victoria are Office & Administration (69 | 11.9%), and Sales & Related (14 | 2.4%).
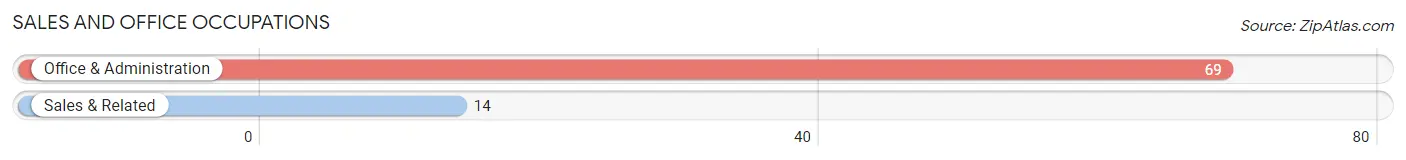
Sales and Office Occupations by Sex
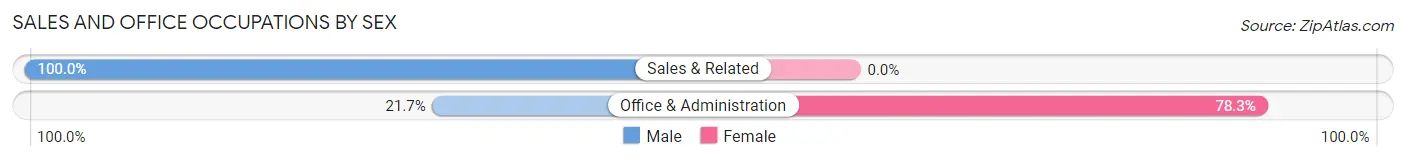
| Occupation | Male | Female |
| Sales & Related | 14 (100.0%) | 0 (0.0%) |
| Office & Administration | 15 (21.7%) | 54 (78.3%) |
| Total (Category) | 29 (34.9%) | 54 (65.1%) |
| Total (Overall) | 348 (59.9%) | 233 (40.1%) |
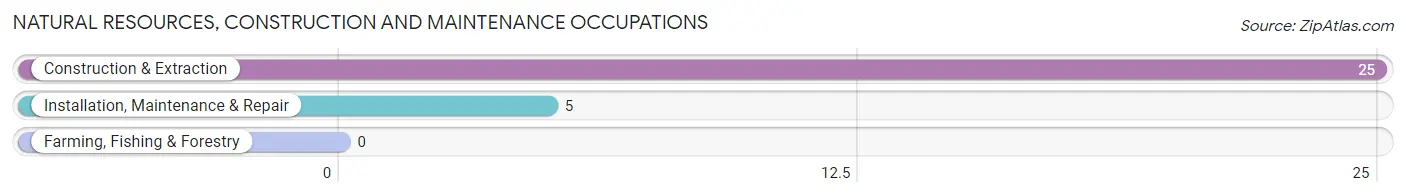
Natural Resources, Construction and Maintenance Occupations
The most common Natural Resources, Construction and Maintenance occupations in Lake Victoria are Construction & Extraction (25 | 4.3%), and Installation, Maintenance & Repair (5 | 0.9%).
Natural Resources, Construction and Maintenance Occupations by Sex
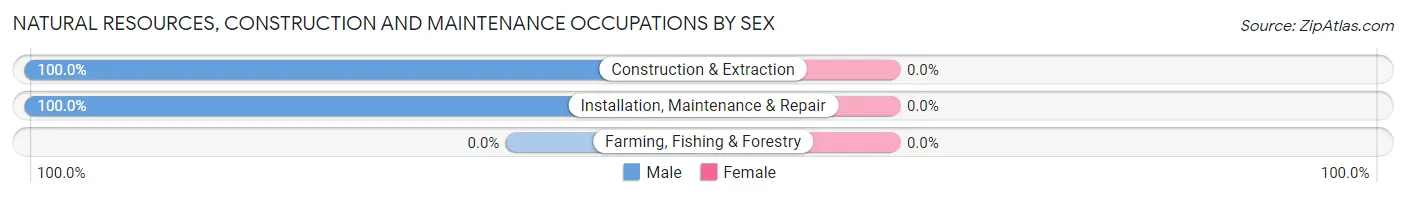
| Occupation | Male | Female |
| Farming, Fishing & Forestry | 0 (0.0%) | 0 (0.0%) |
| Construction & Extraction | 25 (100.0%) | 0 (0.0%) |
| Installation, Maintenance & Repair | 5 (100.0%) | 0 (0.0%) |
| Total (Category) | 30 (100.0%) | 0 (0.0%) |
| Total (Overall) | 348 (59.9%) | 233 (40.1%) |
Production, Transportation and Moving Occupations
The most common Production, Transportation and Moving occupations in Lake Victoria are Transportation (28 | 4.8%), Production (15 | 2.6%), and Material Moving (11 | 1.9%).
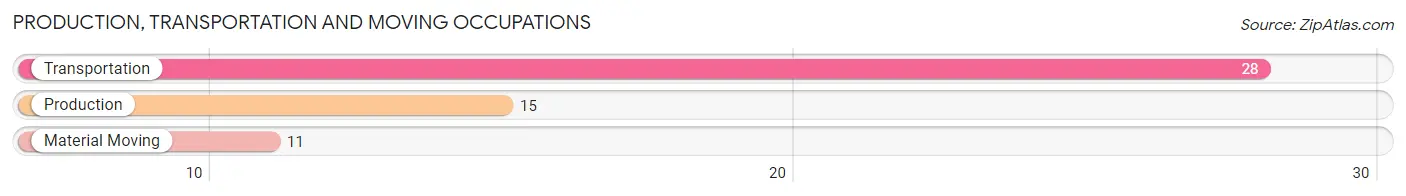
Production, Transportation and Moving Occupations by Sex
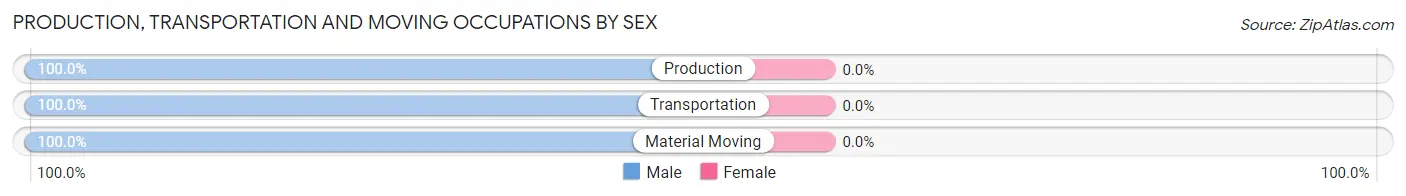
| Occupation | Male | Female |
| Production | 15 (100.0%) | 0 (0.0%) |
| Transportation | 28 (100.0%) | 0 (0.0%) |
| Material Moving | 11 (100.0%) | 0 (0.0%) |
| Total (Category) | 54 (100.0%) | 0 (0.0%) |
| Total (Overall) | 348 (59.9%) | 233 (40.1%) |
Employment Industries by Sex in Lake Victoria
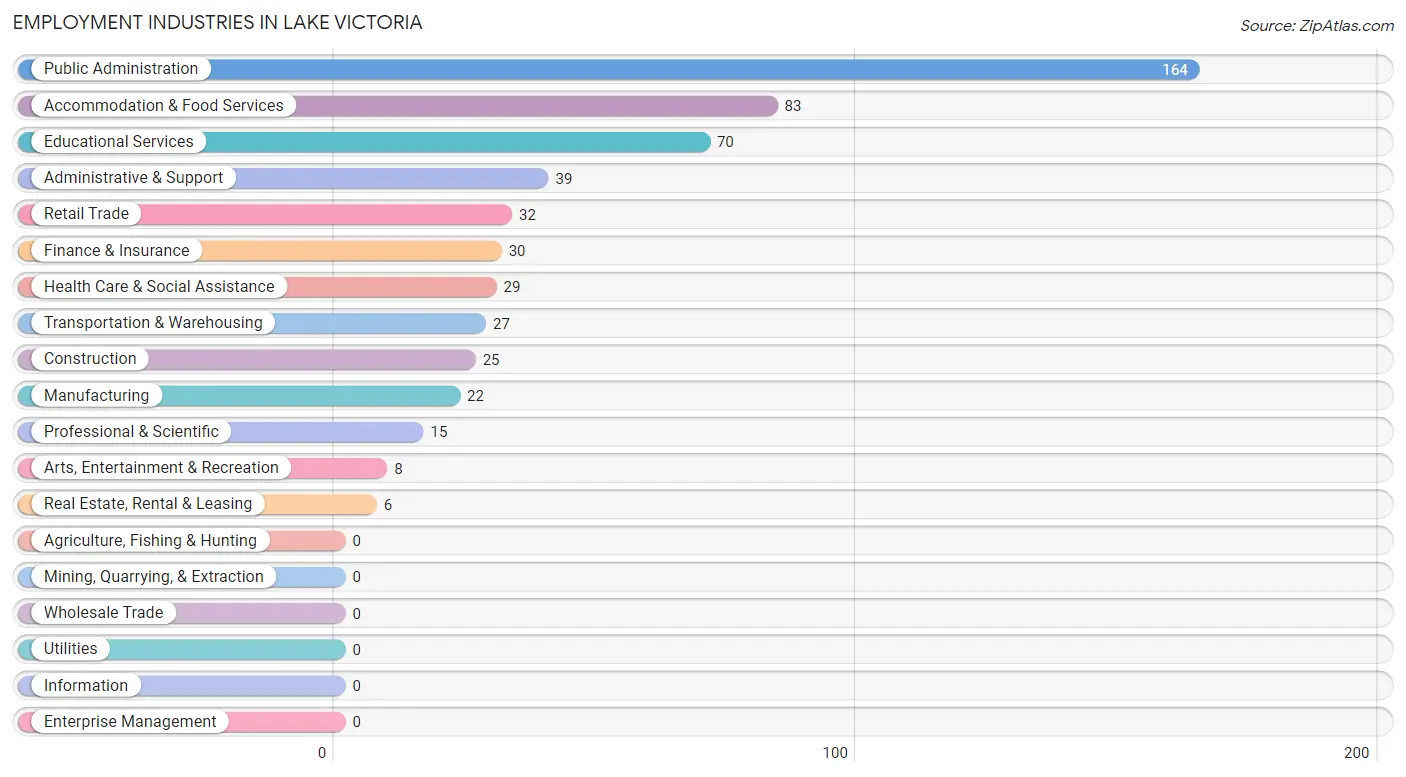
Employment Industries in Lake Victoria
The major employment industries in Lake Victoria include Public Administration (164 | 28.2%), Accommodation & Food Services (83 | 14.3%), Educational Services (70 | 12.0%), Administrative & Support (39 | 6.7%), and Retail Trade (32 | 5.5%).
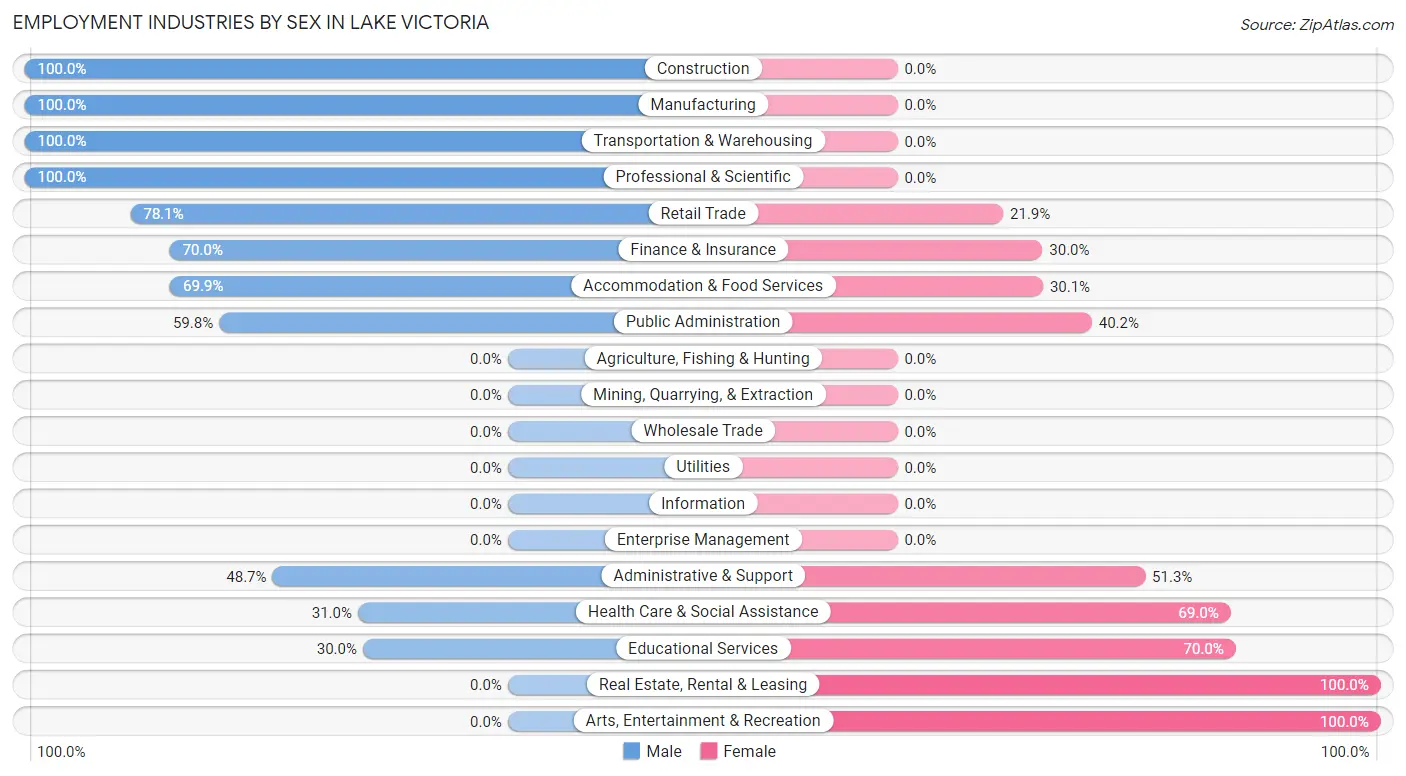
Employment Industries by Sex in Lake Victoria
The Lake Victoria industries that see more men than women are Construction (100.0%), Manufacturing (100.0%), and Transportation & Warehousing (100.0%), whereas the industries that tend to have a higher number of women are Real Estate, Rental & Leasing (100.0%), Arts, Entertainment & Recreation (100.0%), and Educational Services (70.0%).
| Industry | Male | Female |
| Agriculture, Fishing & Hunting | 0 (0.0%) | 0 (0.0%) |
| Mining, Quarrying, & Extraction | 0 (0.0%) | 0 (0.0%) |
| Construction | 25 (100.0%) | 0 (0.0%) |
| Manufacturing | 22 (100.0%) | 0 (0.0%) |
| Wholesale Trade | 0 (0.0%) | 0 (0.0%) |
| Retail Trade | 25 (78.1%) | 7 (21.9%) |
| Transportation & Warehousing | 27 (100.0%) | 0 (0.0%) |
| Utilities | 0 (0.0%) | 0 (0.0%) |
| Information | 0 (0.0%) | 0 (0.0%) |
| Finance & Insurance | 21 (70.0%) | 9 (30.0%) |
| Real Estate, Rental & Leasing | 0 (0.0%) | 6 (100.0%) |
| Professional & Scientific | 15 (100.0%) | 0 (0.0%) |
| Enterprise Management | 0 (0.0%) | 0 (0.0%) |
| Administrative & Support | 19 (48.7%) | 20 (51.3%) |
| Educational Services | 21 (30.0%) | 49 (70.0%) |
| Health Care & Social Assistance | 9 (31.0%) | 20 (69.0%) |
| Arts, Entertainment & Recreation | 0 (0.0%) | 8 (100.0%) |
| Accommodation & Food Services | 58 (69.9%) | 25 (30.1%) |
| Public Administration | 98 (59.8%) | 66 (40.2%) |
| Total | 348 (59.9%) | 233 (40.1%) |
Education in Lake Victoria
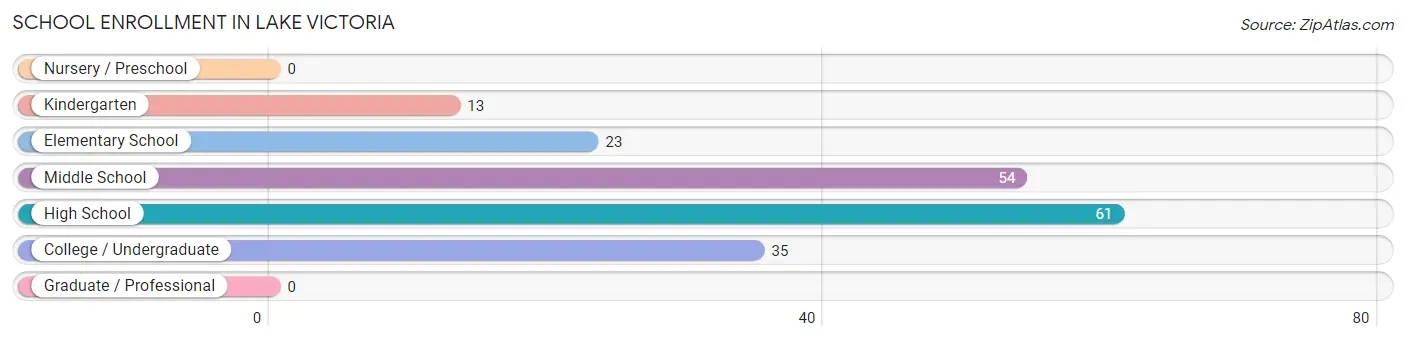
School Enrollment in Lake Victoria
The most common levels of schooling among the 186 students in Lake Victoria are high school (61 | 32.8%), middle school (54 | 29.0%), and college / undergraduate (35 | 18.8%).
| School Level | # Students | % Students |
| Nursery / Preschool | 0 | 0.0% |
| Kindergarten | 13 | 7.0% |
| Elementary School | 23 | 12.4% |
| Middle School | 54 | 29.0% |
| High School | 61 | 32.8% |
| College / Undergraduate | 35 | 18.8% |
| Graduate / Professional | 0 | 0.0% |
| Total | 186 | 100.0% |
School Enrollment by Age by Funding Source in Lake Victoria
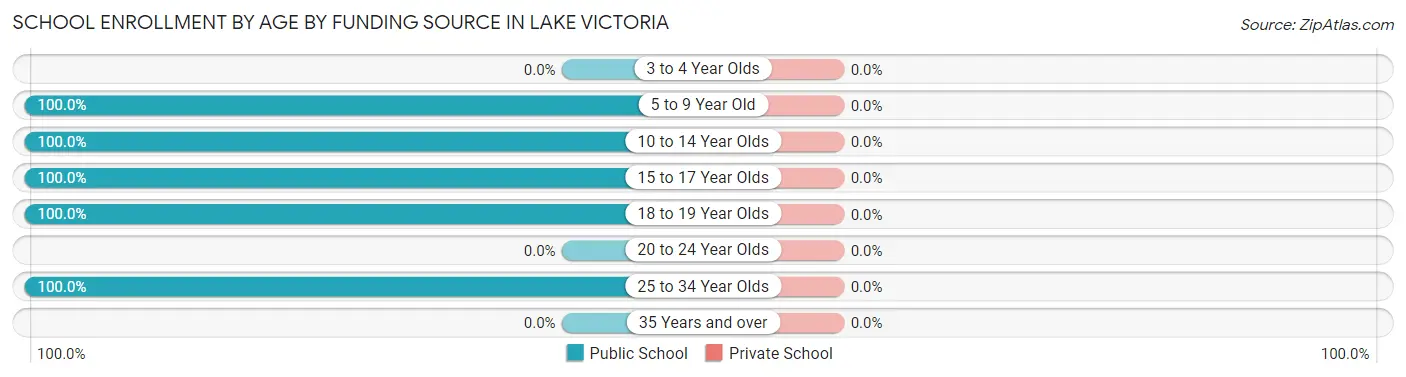
| Age Bracket | Public School | Private School |
| 3 to 4 Year Olds | 0 (0.0%) | 0 (0.0%) |
| 5 to 9 Year Old | 28 (100.0%) | 0 (0.0%) |
| 10 to 14 Year Olds | 62 (100.0%) | 0 (0.0%) |
| 15 to 17 Year Olds | 61 (100.0%) | 0 (0.0%) |
| 18 to 19 Year Olds | 7 (100.0%) | 0 (0.0%) |
| 20 to 24 Year Olds | 0 (0.0%) | 0 (0.0%) |
| 25 to 34 Year Olds | 28 (100.0%) | 0 (0.0%) |
| 35 Years and over | 0 (0.0%) | 0 (0.0%) |
| Total | 186 (100.0%) | 0 (0.0%) |
Educational Attainment by Field of Study in Lake Victoria
Engineering (63 | 16.0%), business (62 | 15.7%), social sciences (60 | 15.2%), arts & humanities (52 | 13.2%), and bio, nature & agricultural (44 | 11.2%) are the most common fields of study among 394 individuals in Lake Victoria who have obtained a bachelor's degree or higher.
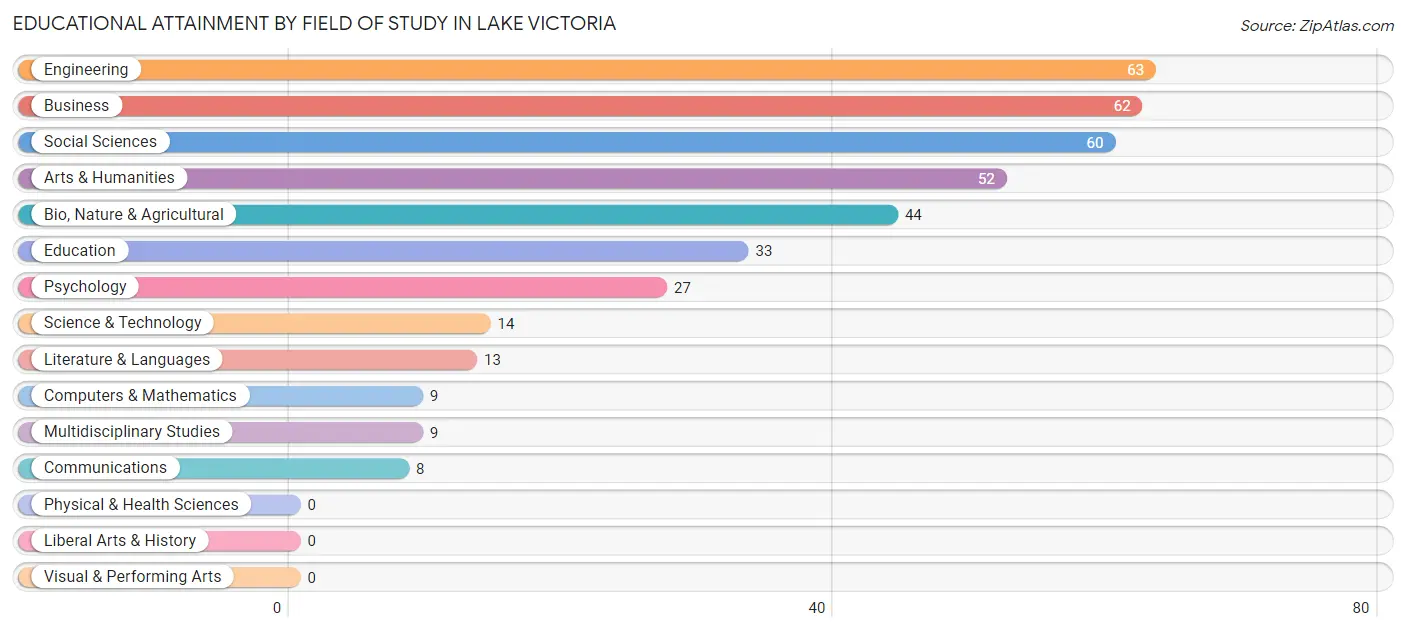
| Field of Study | # Graduates | % Graduates |
| Computers & Mathematics | 9 | 2.3% |
| Bio, Nature & Agricultural | 44 | 11.2% |
| Physical & Health Sciences | 0 | 0.0% |
| Psychology | 27 | 6.9% |
| Social Sciences | 60 | 15.2% |
| Engineering | 63 | 16.0% |
| Multidisciplinary Studies | 9 | 2.3% |
| Science & Technology | 14 | 3.5% |
| Business | 62 | 15.7% |
| Education | 33 | 8.4% |
| Literature & Languages | 13 | 3.3% |
| Liberal Arts & History | 0 | 0.0% |
| Visual & Performing Arts | 0 | 0.0% |
| Communications | 8 | 2.0% |
| Arts & Humanities | 52 | 13.2% |
| Total | 394 | 100.0% |
Transportation & Commute in Lake Victoria
Vehicle Availability by Sex in Lake Victoria
The most prevalent vehicle ownership categories in Lake Victoria are males with 2 vehicles (134, accounting for 38.5%) and females with 2 vehicles (119, making up 57.5%).
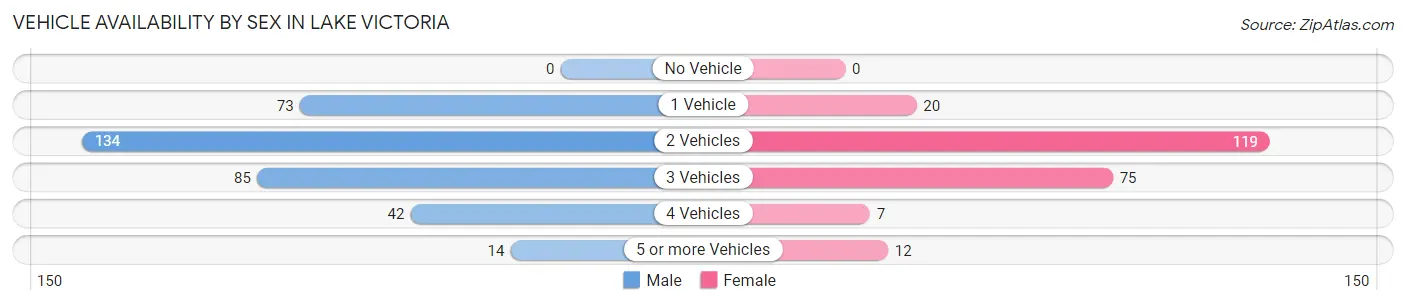
| Vehicles Available | Male | Female |
| No Vehicle | 0 (0.0%) | 0 (0.0%) |
| 1 Vehicle | 73 (21.0%) | 20 (8.6%) |
| 2 Vehicles | 134 (38.5%) | 119 (51.1%) |
| 3 Vehicles | 85 (24.4%) | 75 (32.2%) |
| 4 Vehicles | 42 (12.1%) | 7 (3.0%) |
| 5 or more Vehicles | 14 (4.0%) | 12 (5.1%) |
| Total | 348 (100.0%) | 233 (100.0%) |
Commute Time in Lake Victoria
The most frequently occuring commute durations in Lake Victoria are 30 to 34 minutes (241 commuters, 43.7%), 25 to 29 minutes (94 commuters, 17.0%), and 20 to 24 minutes (70 commuters, 12.7%).
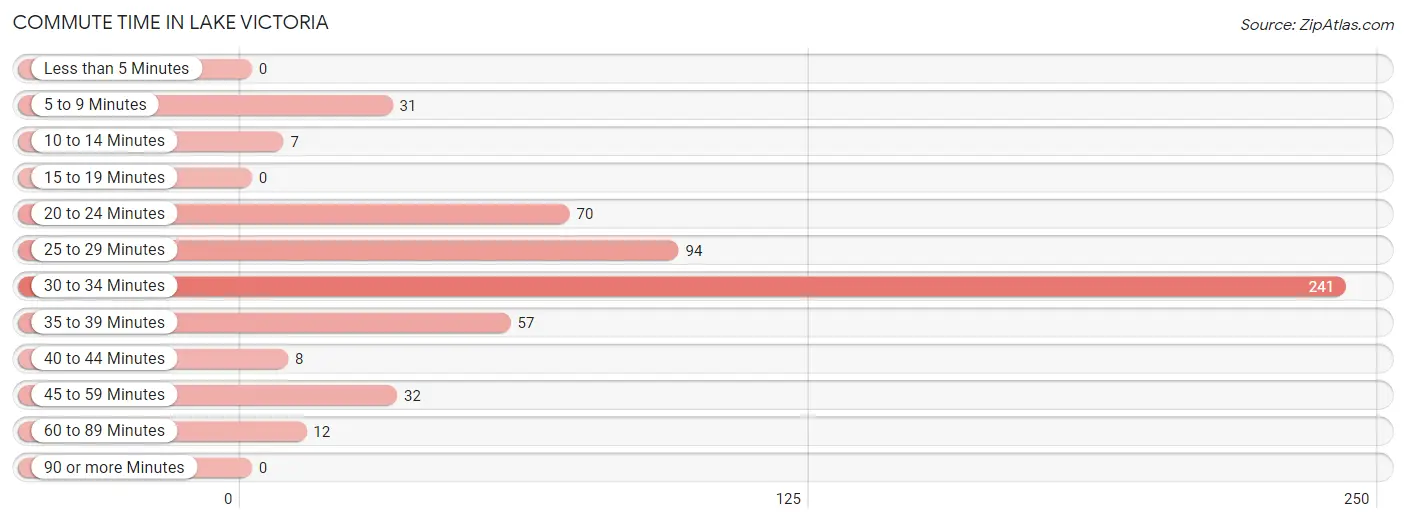
| Commute Time | # Commuters | % Commuters |
| Less than 5 Minutes | 0 | 0.0% |
| 5 to 9 Minutes | 31 | 5.6% |
| 10 to 14 Minutes | 7 | 1.3% |
| 15 to 19 Minutes | 0 | 0.0% |
| 20 to 24 Minutes | 70 | 12.7% |
| 25 to 29 Minutes | 94 | 17.0% |
| 30 to 34 Minutes | 241 | 43.7% |
| 35 to 39 Minutes | 57 | 10.3% |
| 40 to 44 Minutes | 8 | 1.5% |
| 45 to 59 Minutes | 32 | 5.8% |
| 60 to 89 Minutes | 12 | 2.2% |
| 90 or more Minutes | 0 | 0.0% |
Commute Time by Sex in Lake Victoria
The most common commute times in Lake Victoria are 30 to 34 minutes (125 commuters, 37.5%) for males and 30 to 34 minutes (116 commuters, 53.0%) for females.
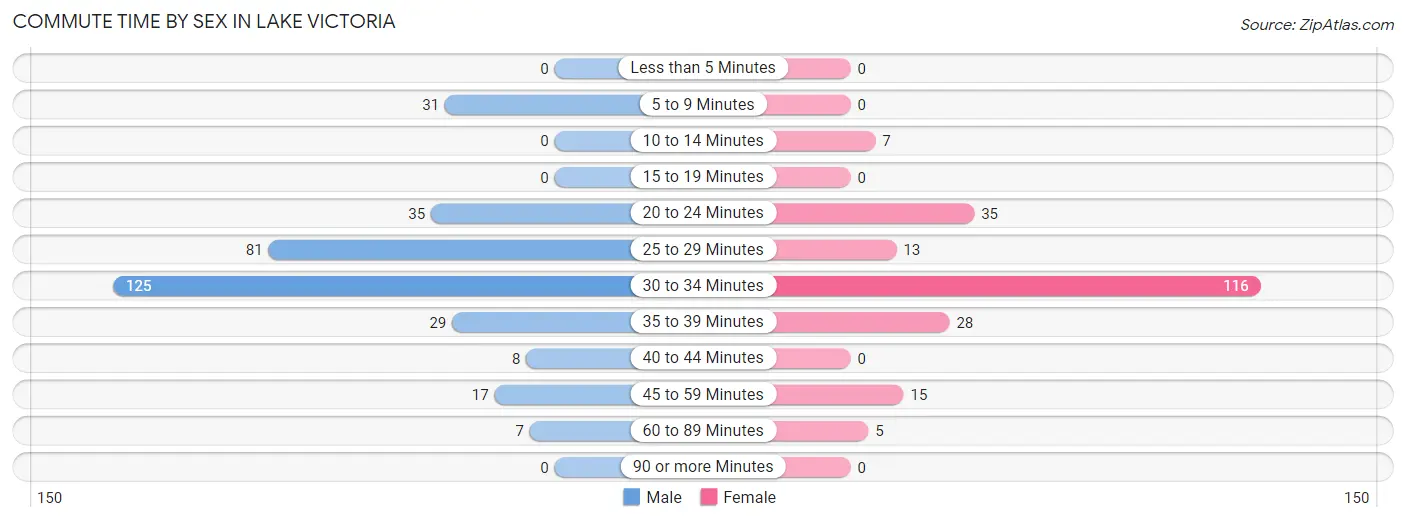
| Commute Time | Male | Female |
| Less than 5 Minutes | 0 (0.0%) | 0 (0.0%) |
| 5 to 9 Minutes | 31 (9.3%) | 0 (0.0%) |
| 10 to 14 Minutes | 0 (0.0%) | 7 (3.2%) |
| 15 to 19 Minutes | 0 (0.0%) | 0 (0.0%) |
| 20 to 24 Minutes | 35 (10.5%) | 35 (16.0%) |
| 25 to 29 Minutes | 81 (24.3%) | 13 (5.9%) |
| 30 to 34 Minutes | 125 (37.5%) | 116 (53.0%) |
| 35 to 39 Minutes | 29 (8.7%) | 28 (12.8%) |
| 40 to 44 Minutes | 8 (2.4%) | 0 (0.0%) |
| 45 to 59 Minutes | 17 (5.1%) | 15 (6.9%) |
| 60 to 89 Minutes | 7 (2.1%) | 5 (2.3%) |
| 90 or more Minutes | 0 (0.0%) | 0 (0.0%) |
Time of Departure to Work by Sex in Lake Victoria
The most frequent times of departure to work in Lake Victoria are 7:30 AM to 7:59 AM (75, 22.5%) for males and 7:00 AM to 7:29 AM (53, 24.2%) for females.
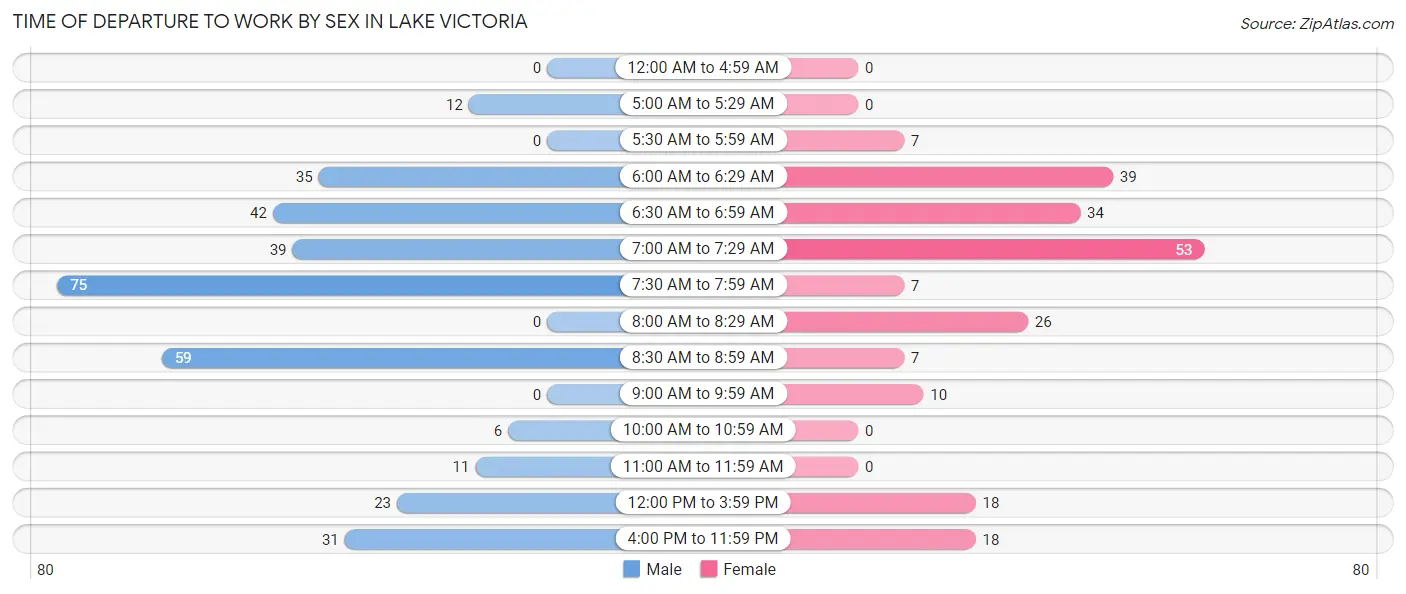
| Time of Departure | Male | Female |
| 12:00 AM to 4:59 AM | 0 (0.0%) | 0 (0.0%) |
| 5:00 AM to 5:29 AM | 12 (3.6%) | 0 (0.0%) |
| 5:30 AM to 5:59 AM | 0 (0.0%) | 7 (3.2%) |
| 6:00 AM to 6:29 AM | 35 (10.5%) | 39 (17.8%) |
| 6:30 AM to 6:59 AM | 42 (12.6%) | 34 (15.5%) |
| 7:00 AM to 7:29 AM | 39 (11.7%) | 53 (24.2%) |
| 7:30 AM to 7:59 AM | 75 (22.5%) | 7 (3.2%) |
| 8:00 AM to 8:29 AM | 0 (0.0%) | 26 (11.9%) |
| 8:30 AM to 8:59 AM | 59 (17.7%) | 7 (3.2%) |
| 9:00 AM to 9:59 AM | 0 (0.0%) | 10 (4.6%) |
| 10:00 AM to 10:59 AM | 6 (1.8%) | 0 (0.0%) |
| 11:00 AM to 11:59 AM | 11 (3.3%) | 0 (0.0%) |
| 12:00 PM to 3:59 PM | 23 (6.9%) | 18 (8.2%) |
| 4:00 PM to 11:59 PM | 31 (9.3%) | 18 (8.2%) |
| Total | 333 (100.0%) | 219 (100.0%) |
Housing Occupancy in Lake Victoria
Occupancy by Ownership in Lake Victoria
Of the total 416 dwellings in Lake Victoria, owner-occupied units account for 416 (100.0%), while renter-occupied units make up 0 (0.0%).
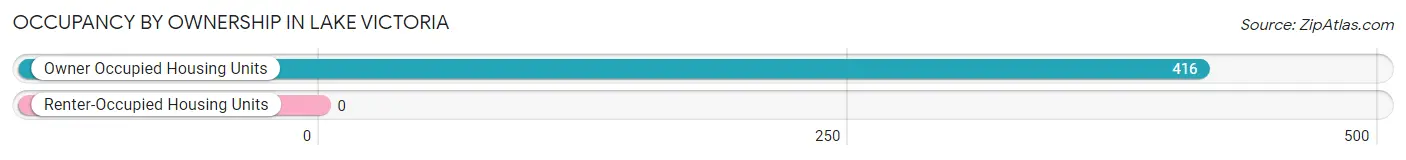
| Occupancy | # Housing Units | % Housing Units |
| Owner Occupied Housing Units | 416 | 100.0% |
| Renter-Occupied Housing Units | 0 | 0.0% |
| Total Occupied Housing Units | 416 | 100.0% |
Occupancy by Household Size in Lake Victoria
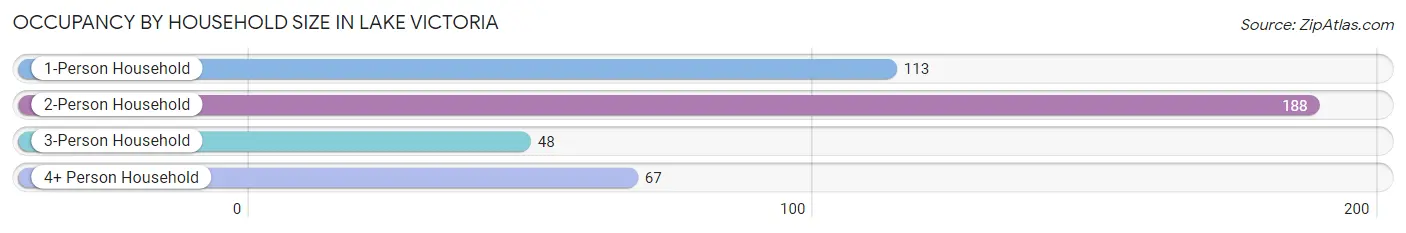
| Household Size | # Housing Units | % Housing Units |
| 1-Person Household | 113 | 27.2% |
| 2-Person Household | 188 | 45.2% |
| 3-Person Household | 48 | 11.5% |
| 4+ Person Household | 67 | 16.1% |
| Total Housing Units | 416 | 100.0% |
Occupancy by Ownership by Household Size in Lake Victoria
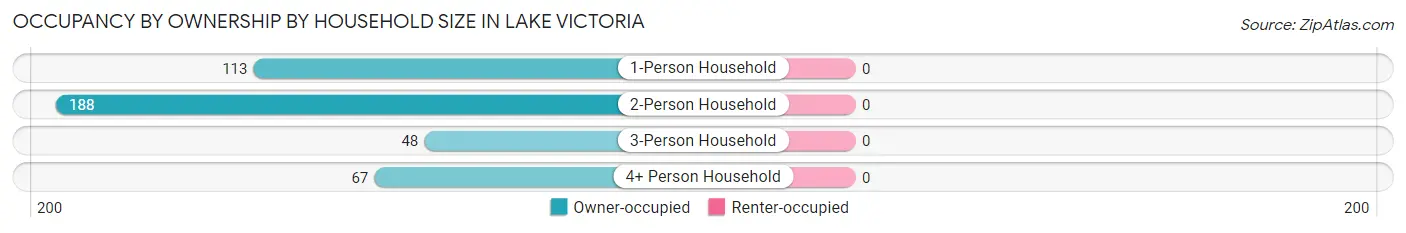
| Household Size | Owner-occupied | Renter-occupied |
| 1-Person Household | 113 (100.0%) | 0 (0.0%) |
| 2-Person Household | 188 (100.0%) | 0 (0.0%) |
| 3-Person Household | 48 (100.0%) | 0 (0.0%) |
| 4+ Person Household | 67 (100.0%) | 0 (0.0%) |
| Total Housing Units | 416 (100.0%) | 0 (0.0%) |
Occupancy by Educational Attainment in Lake Victoria
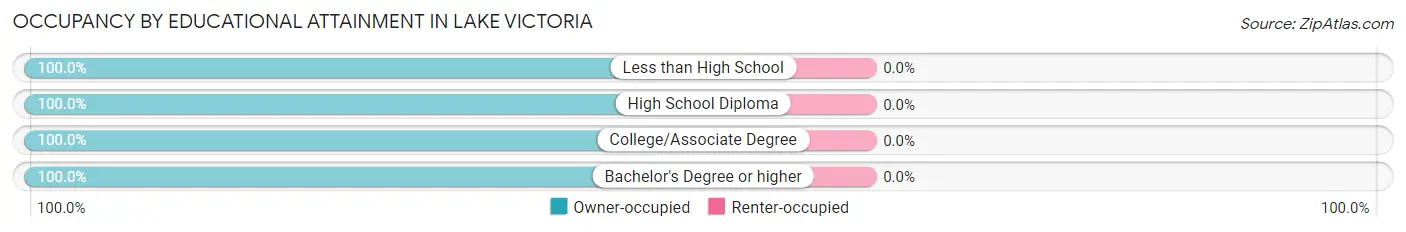
| Household Size | Owner-occupied | Renter-occupied |
| Less than High School | 10 (100.0%) | 0 (0.0%) |
| High School Diploma | 45 (100.0%) | 0 (0.0%) |
| College/Associate Degree | 98 (100.0%) | 0 (0.0%) |
| Bachelor's Degree or higher | 263 (100.0%) | 0 (0.0%) |
Occupancy by Age of Householder in Lake Victoria
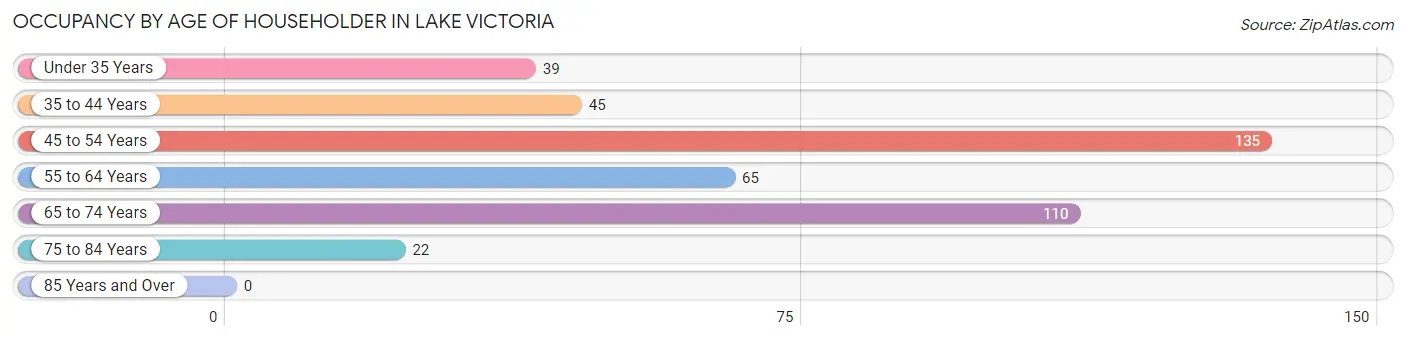
| Age Bracket | # Households | % Households |
| Under 35 Years | 39 | 9.4% |
| 35 to 44 Years | 45 | 10.8% |
| 45 to 54 Years | 135 | 32.5% |
| 55 to 64 Years | 65 | 15.6% |
| 65 to 74 Years | 110 | 26.4% |
| 75 to 84 Years | 22 | 5.3% |
| 85 Years and Over | 0 | 0.0% |
| Total | 416 | 100.0% |
Housing Finances in Lake Victoria
Median Income by Occupancy in Lake Victoria
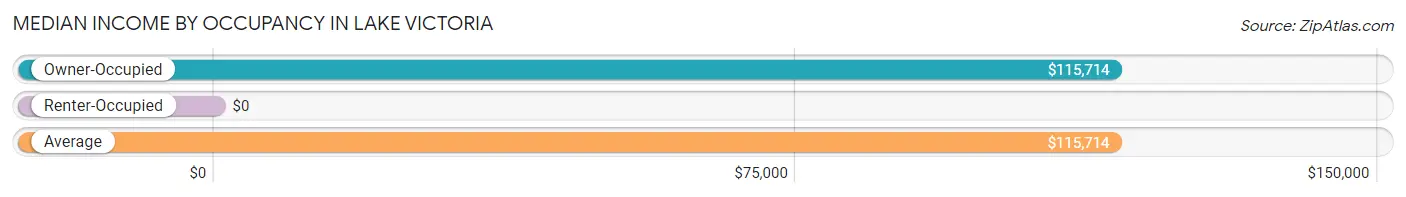
| Occupancy Type | # Households | Median Income |
| Owner-Occupied | 416 (100.0%) | $115,714 |
| Renter-Occupied | 0 (0.0%) | $0 |
| Average | 416 (100.0%) | $115,714 |
Occupancy by Householder Income Bracket in Lake Victoria
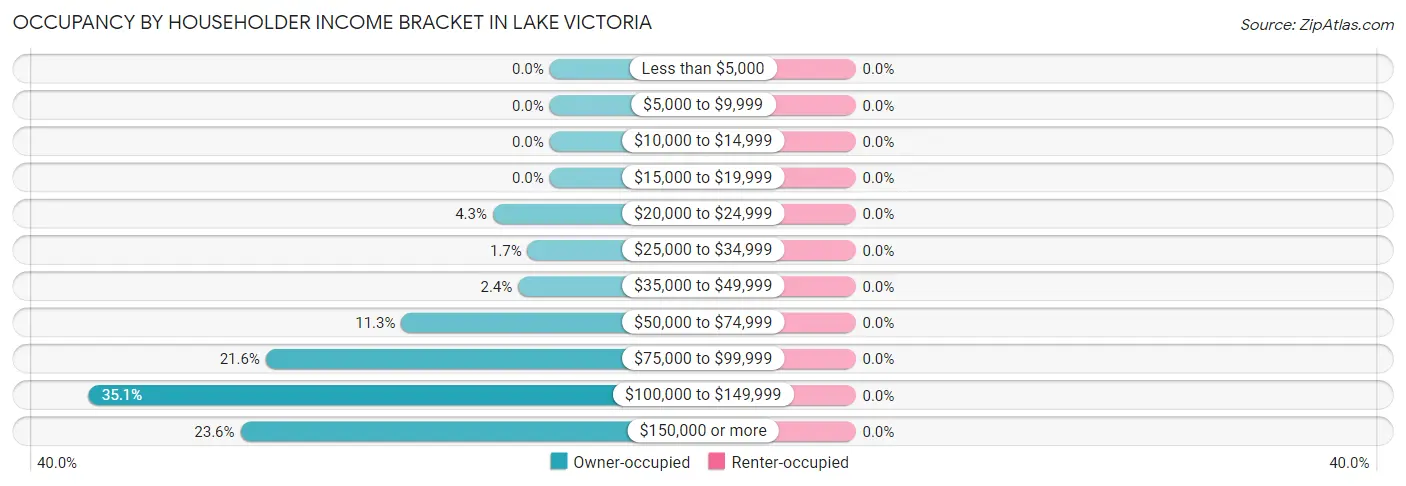
| Income Bracket | Owner-occupied | Renter-occupied |
| Less than $5,000 | 0 (0.0%) | 0 (0.0%) |
| $5,000 to $9,999 | 0 (0.0%) | 0 (0.0%) |
| $10,000 to $14,999 | 0 (0.0%) | 0 (0.0%) |
| $15,000 to $19,999 | 0 (0.0%) | 0 (0.0%) |
| $20,000 to $24,999 | 18 (4.3%) | 0 (0.0%) |
| $25,000 to $34,999 | 7 (1.7%) | 0 (0.0%) |
| $35,000 to $49,999 | 10 (2.4%) | 0 (0.0%) |
| $50,000 to $74,999 | 47 (11.3%) | 0 (0.0%) |
| $75,000 to $99,999 | 90 (21.6%) | 0 (0.0%) |
| $100,000 to $149,999 | 146 (35.1%) | 0 (0.0%) |
| $150,000 or more | 98 (23.6%) | 0 (0.0%) |
| Total | 416 (100.0%) | 0 (0.0%) |
Monthly Housing Cost Tiers in Lake Victoria
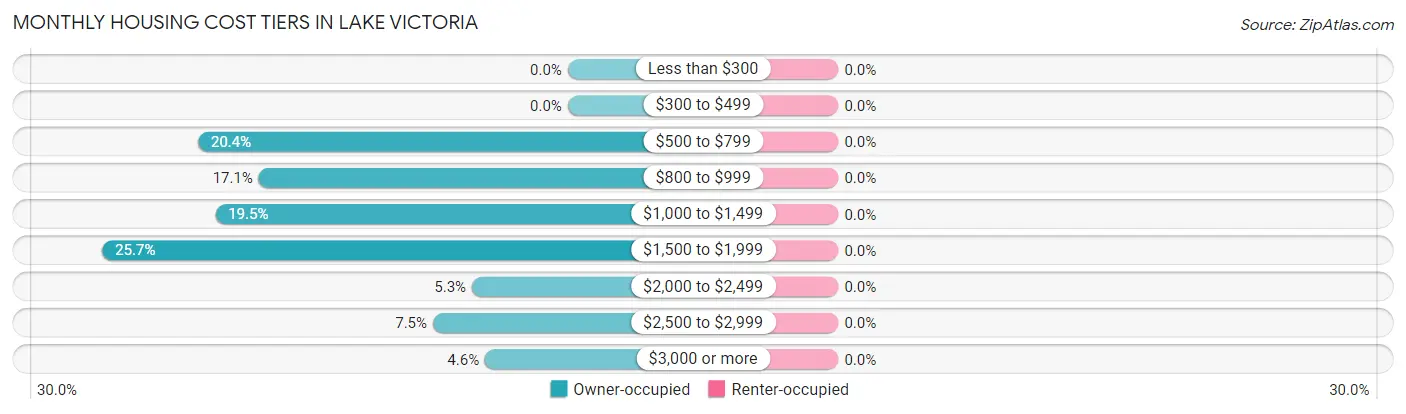
| Monthly Cost | Owner-occupied | Renter-occupied |
| Less than $300 | 0 (0.0%) | 0 (0.0%) |
| $300 to $499 | 0 (0.0%) | 0 (0.0%) |
| $500 to $799 | 85 (20.4%) | 0 (0.0%) |
| $800 to $999 | 71 (17.1%) | 0 (0.0%) |
| $1,000 to $1,499 | 81 (19.5%) | 0 (0.0%) |
| $1,500 to $1,999 | 107 (25.7%) | 0 (0.0%) |
| $2,000 to $2,499 | 22 (5.3%) | 0 (0.0%) |
| $2,500 to $2,999 | 31 (7.4%) | 0 (0.0%) |
| $3,000 or more | 19 (4.6%) | 0 (0.0%) |
| Total | 416 (100.0%) | 0 (0.0%) |
Physical Housing Characteristics in Lake Victoria
Housing Structures in Lake Victoria
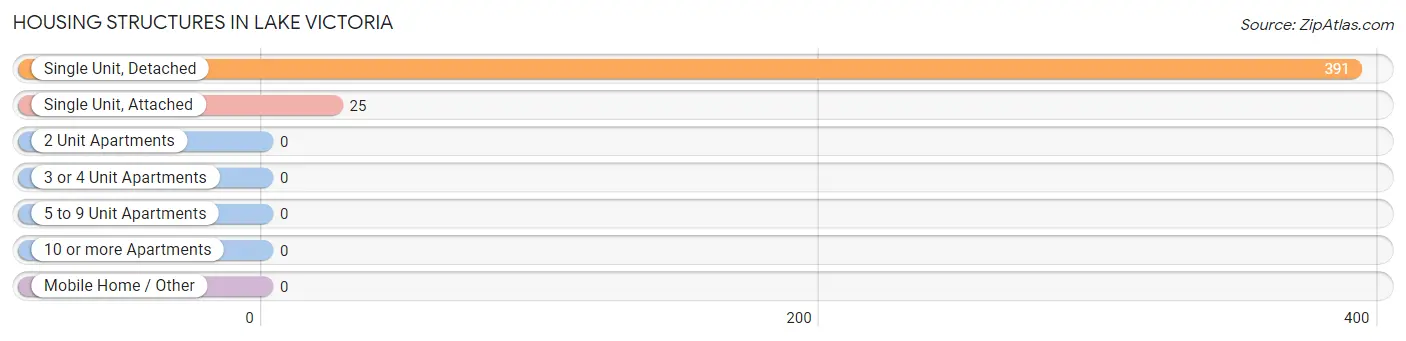
| Structure Type | # Housing Units | % Housing Units |
| Single Unit, Detached | 391 | 94.0% |
| Single Unit, Attached | 25 | 6.0% |
| 2 Unit Apartments | 0 | 0.0% |
| 3 or 4 Unit Apartments | 0 | 0.0% |
| 5 to 9 Unit Apartments | 0 | 0.0% |
| 10 or more Apartments | 0 | 0.0% |
| Mobile Home / Other | 0 | 0.0% |
| Total | 416 | 100.0% |
Housing Structures by Occupancy in Lake Victoria
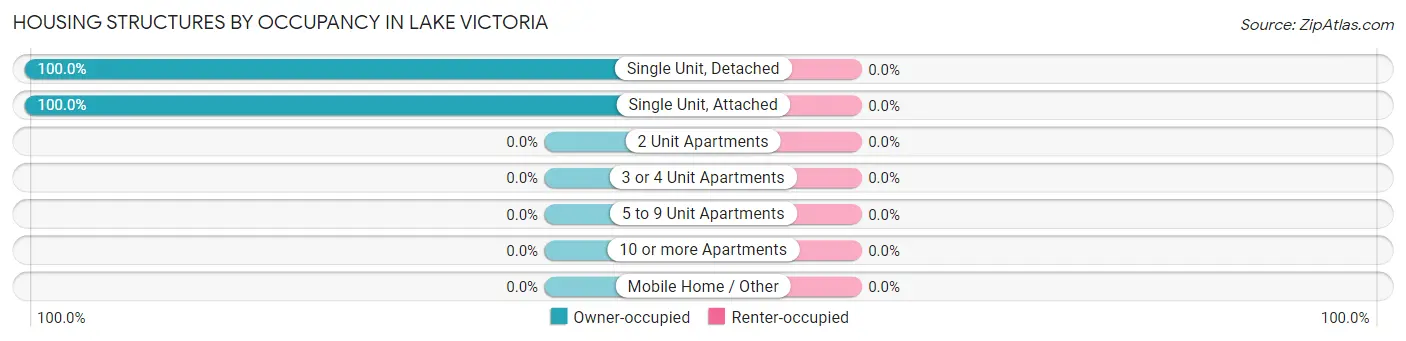
| Structure Type | Owner-occupied | Renter-occupied |
| Single Unit, Detached | 391 (100.0%) | 0 (0.0%) |
| Single Unit, Attached | 25 (100.0%) | 0 (0.0%) |
| 2 Unit Apartments | 0 (0.0%) | 0 (0.0%) |
| 3 or 4 Unit Apartments | 0 (0.0%) | 0 (0.0%) |
| 5 to 9 Unit Apartments | 0 (0.0%) | 0 (0.0%) |
| 10 or more Apartments | 0 (0.0%) | 0 (0.0%) |
| Mobile Home / Other | 0 (0.0%) | 0 (0.0%) |
| Total | 416 (100.0%) | 0 (0.0%) |
Housing Structures by Number of Rooms in Lake Victoria
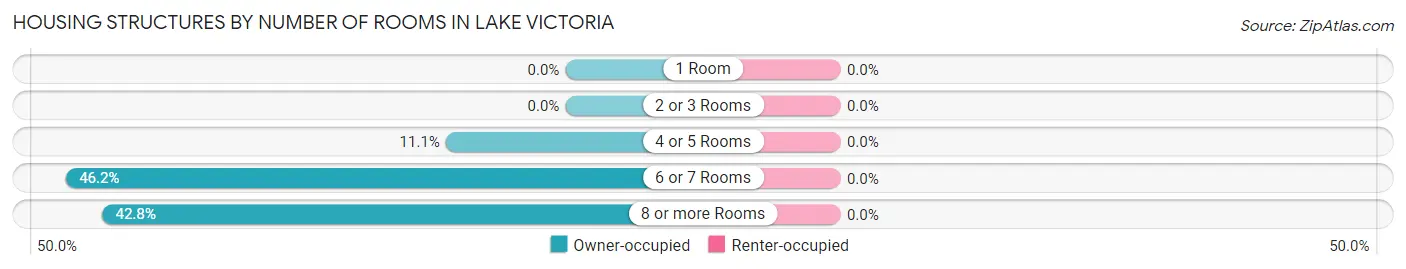
| Number of Rooms | Owner-occupied | Renter-occupied |
| 1 Room | 0 (0.0%) | 0 (0.0%) |
| 2 or 3 Rooms | 0 (0.0%) | 0 (0.0%) |
| 4 or 5 Rooms | 46 (11.1%) | 0 (0.0%) |
| 6 or 7 Rooms | 192 (46.2%) | 0 (0.0%) |
| 8 or more Rooms | 178 (42.8%) | 0 (0.0%) |
| Total | 416 (100.0%) | 0 (0.0%) |
Housing Structure by Heating Type in Lake Victoria
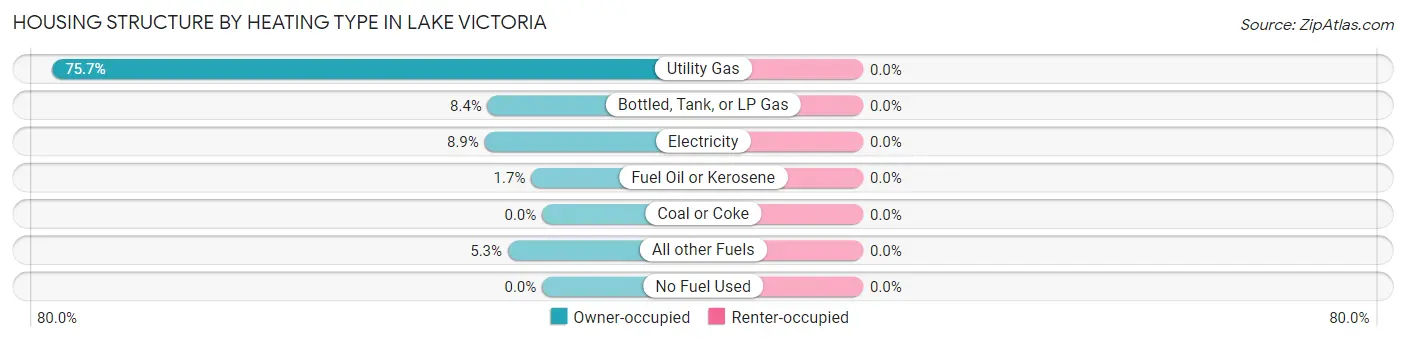
| Heating Type | Owner-occupied | Renter-occupied |
| Utility Gas | 315 (75.7%) | 0 (0.0%) |
| Bottled, Tank, or LP Gas | 35 (8.4%) | 0 (0.0%) |
| Electricity | 37 (8.9%) | 0 (0.0%) |
| Fuel Oil or Kerosene | 7 (1.7%) | 0 (0.0%) |
| Coal or Coke | 0 (0.0%) | 0 (0.0%) |
| All other Fuels | 22 (5.3%) | 0 (0.0%) |
| No Fuel Used | 0 (0.0%) | 0 (0.0%) |
| Total | 416 (100.0%) | 0 (0.0%) |
Household Vehicle Usage in Lake Victoria
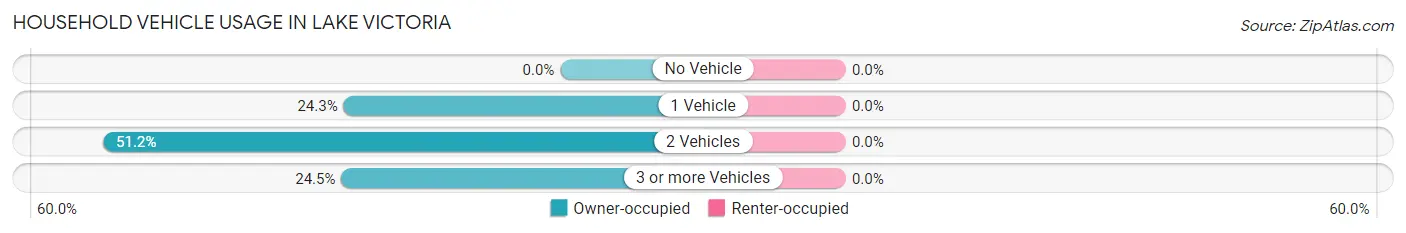
| Vehicles per Household | Owner-occupied | Renter-occupied |
| No Vehicle | 0 (0.0%) | 0 (0.0%) |
| 1 Vehicle | 101 (24.3%) | 0 (0.0%) |
| 2 Vehicles | 213 (51.2%) | 0 (0.0%) |
| 3 or more Vehicles | 102 (24.5%) | 0 (0.0%) |
| Total | 416 (100.0%) | 0 (0.0%) |
Real Estate & Mortgages in Lake Victoria
Real Estate and Mortgage Overview in Lake Victoria
| Characteristic | Without Mortgage | With Mortgage |
| Housing Units | 98 | 318 |
| Median Property Value | $373,200 | $283,300 |
| Median Household Income | $83,750 | $93 |
| Monthly Housing Costs | $591 | $19 |
| Real Estate Taxes | $3,704 | $0 |
Property Value by Mortgage Status in Lake Victoria
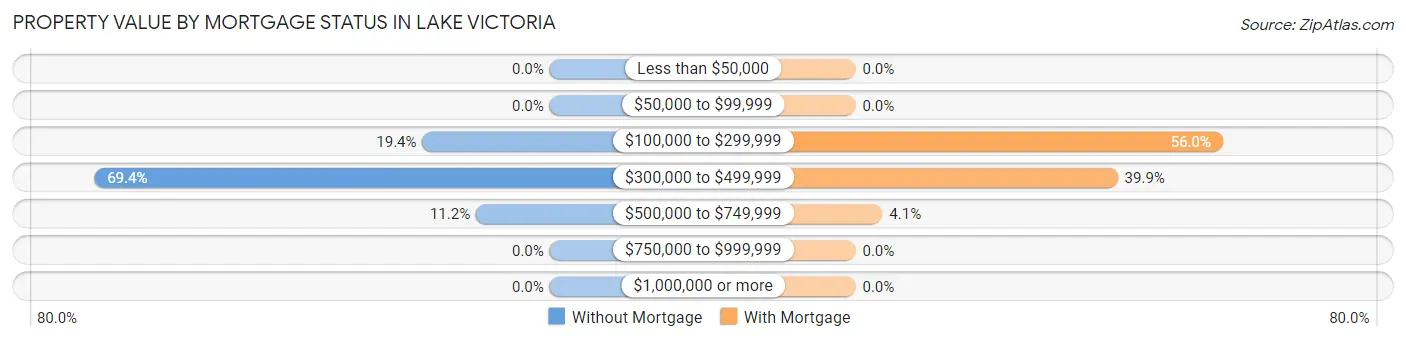
| Property Value | Without Mortgage | With Mortgage |
| Less than $50,000 | 0 (0.0%) | 0 (0.0%) |
| $50,000 to $99,999 | 0 (0.0%) | 0 (0.0%) |
| $100,000 to $299,999 | 19 (19.4%) | 178 (56.0%) |
| $300,000 to $499,999 | 68 (69.4%) | 127 (39.9%) |
| $500,000 to $749,999 | 11 (11.2%) | 13 (4.1%) |
| $750,000 to $999,999 | 0 (0.0%) | 0 (0.0%) |
| $1,000,000 or more | 0 (0.0%) | 0 (0.0%) |
| Total | 98 (100.0%) | 318 (100.0%) |
Household Income by Mortgage Status in Lake Victoria
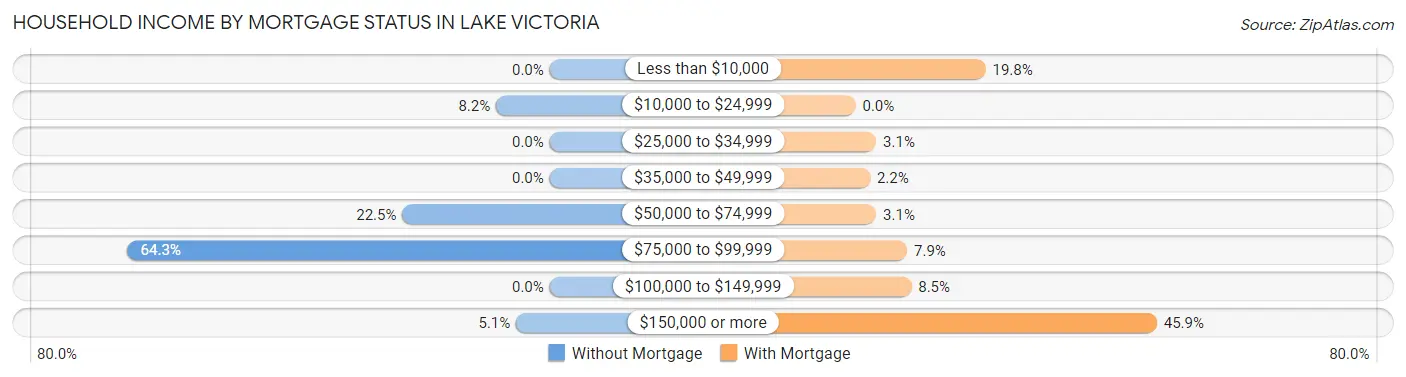
| Household Income | Without Mortgage | With Mortgage |
| Less than $10,000 | 0 (0.0%) | 63 (19.8%) |
| $10,000 to $24,999 | 8 (8.2%) | 0 (0.0%) |
| $25,000 to $34,999 | 0 (0.0%) | 10 (3.1%) |
| $35,000 to $49,999 | 0 (0.0%) | 7 (2.2%) |
| $50,000 to $74,999 | 22 (22.5%) | 10 (3.1%) |
| $75,000 to $99,999 | 63 (64.3%) | 25 (7.9%) |
| $100,000 to $149,999 | 0 (0.0%) | 27 (8.5%) |
| $150,000 or more | 5 (5.1%) | 146 (45.9%) |
| Total | 98 (100.0%) | 318 (100.0%) |
Property Value to Household Income Ratio in Lake Victoria
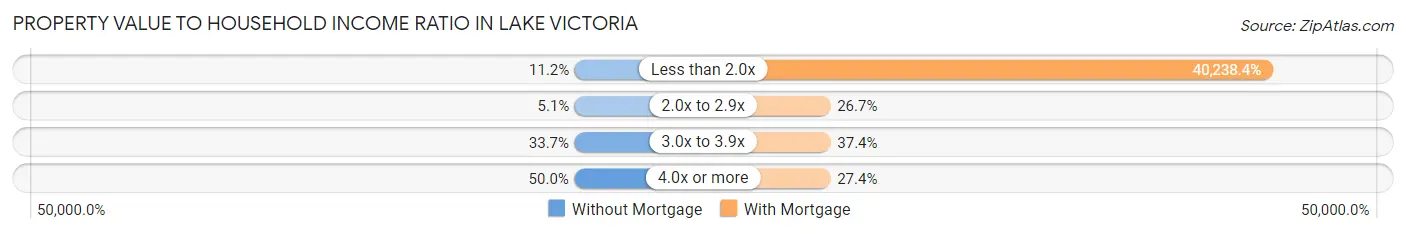
| Value-to-Income Ratio | Without Mortgage | With Mortgage |
| Less than 2.0x | 11 (11.2%) | 127,958 (40,238.4%) |
| 2.0x to 2.9x | 5 (5.1%) | 85 (26.7%) |
| 3.0x to 3.9x | 33 (33.7%) | 119 (37.4%) |
| 4.0x or more | 49 (50.0%) | 87 (27.4%) |
| Total | 98 (100.0%) | 318 (100.0%) |
Real Estate Taxes by Mortgage Status in Lake Victoria
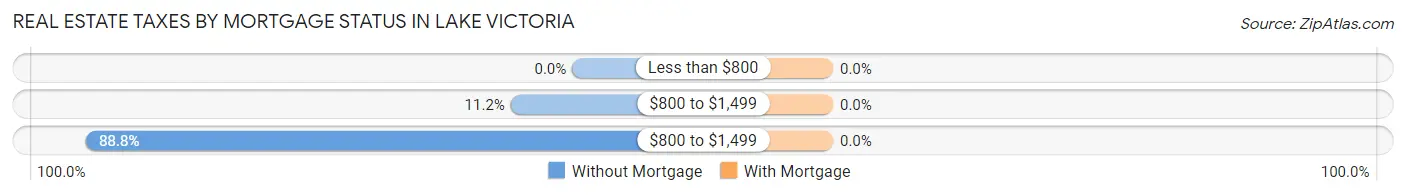
| Property Taxes | Without Mortgage | With Mortgage |
| Less than $800 | 0 (0.0%) | 0 (0.0%) |
| $800 to $1,499 | 11 (11.2%) | 0 (0.0%) |
| $800 to $1,499 | 87 (88.8%) | 0 (0.0%) |
| Total | 98 (100.0%) | 318 (100.0%) |
Health & Disability in Lake Victoria
Health Insurance Coverage by Age in Lake Victoria
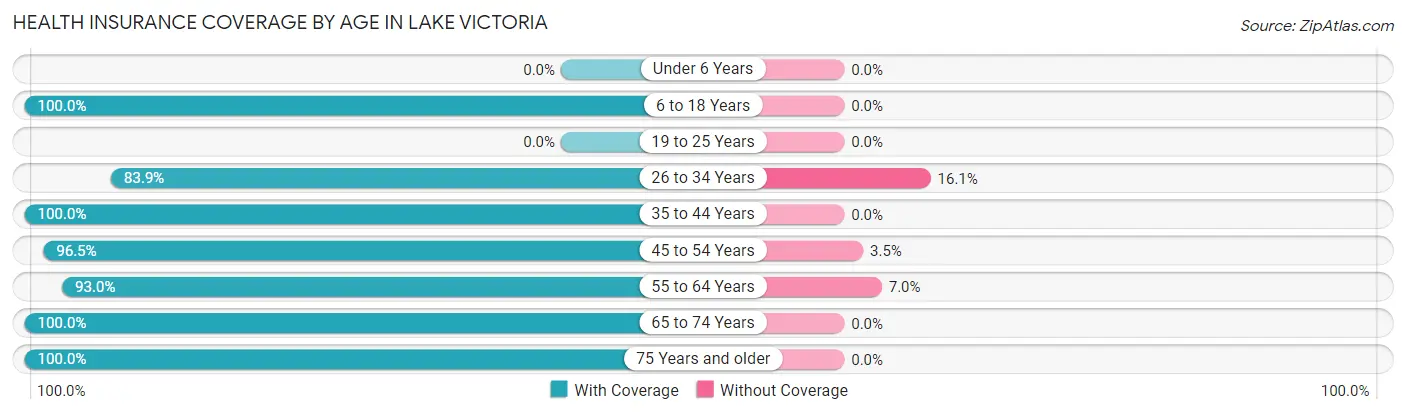
| Age Bracket | With Coverage | Without Coverage |
| Under 6 Years | 0 (0.0%) | 0 (0.0%) |
| 6 to 18 Years | 158 (100.0%) | 0 (0.0%) |
| 19 to 25 Years | 0 (0.0%) | 0 (0.0%) |
| 26 to 34 Years | 99 (83.9%) | 19 (16.1%) |
| 35 to 44 Years | 110 (100.0%) | 0 (0.0%) |
| 45 to 54 Years | 220 (96.5%) | 8 (3.5%) |
| 55 to 64 Years | 133 (93.0%) | 10 (7.0%) |
| 65 to 74 Years | 138 (100.0%) | 0 (0.0%) |
| 75 Years and older | 55 (100.0%) | 0 (0.0%) |
| Total | 913 (96.1%) | 37 (3.9%) |
Health Insurance Coverage by Citizenship Status in Lake Victoria
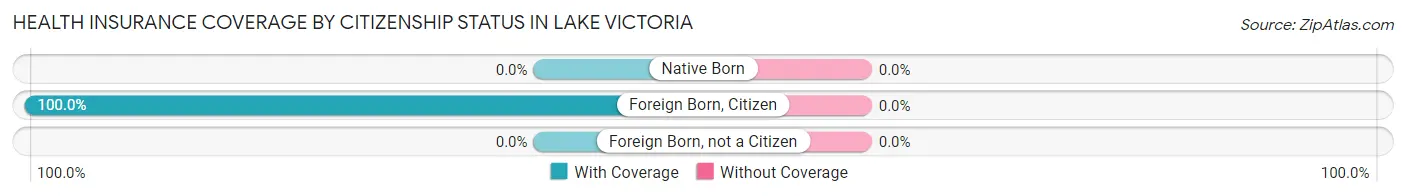
| Citizenship Status | With Coverage | Without Coverage |
| Native Born | 0 (0.0%) | 0 (0.0%) |
| Foreign Born, Citizen | 158 (100.0%) | 0 (0.0%) |
| Foreign Born, not a Citizen | 0 (0.0%) | 0 (0.0%) |
Health Insurance Coverage by Household Income in Lake Victoria
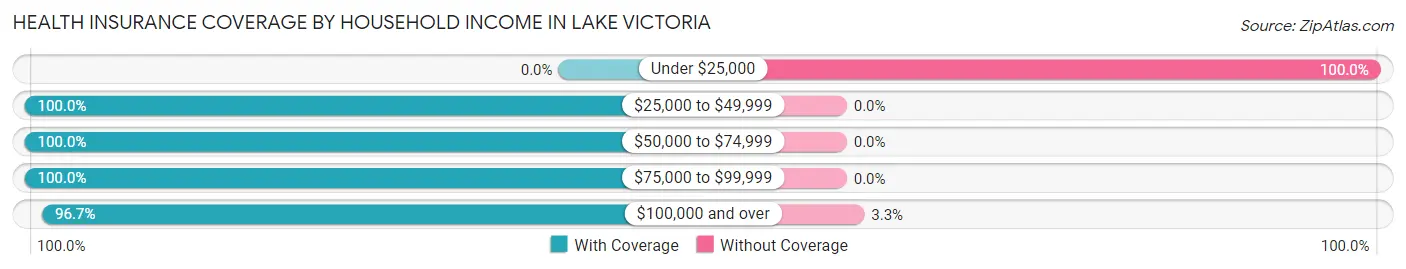
| Household Income | With Coverage | Without Coverage |
| Under $25,000 | 0 (0.0%) | 18 (100.0%) |
| $25,000 to $49,999 | 17 (100.0%) | 0 (0.0%) |
| $50,000 to $74,999 | 95 (100.0%) | 0 (0.0%) |
| $75,000 to $99,999 | 242 (100.0%) | 0 (0.0%) |
| $100,000 and over | 559 (96.7%) | 19 (3.3%) |
Public vs Private Health Insurance Coverage by Age in Lake Victoria
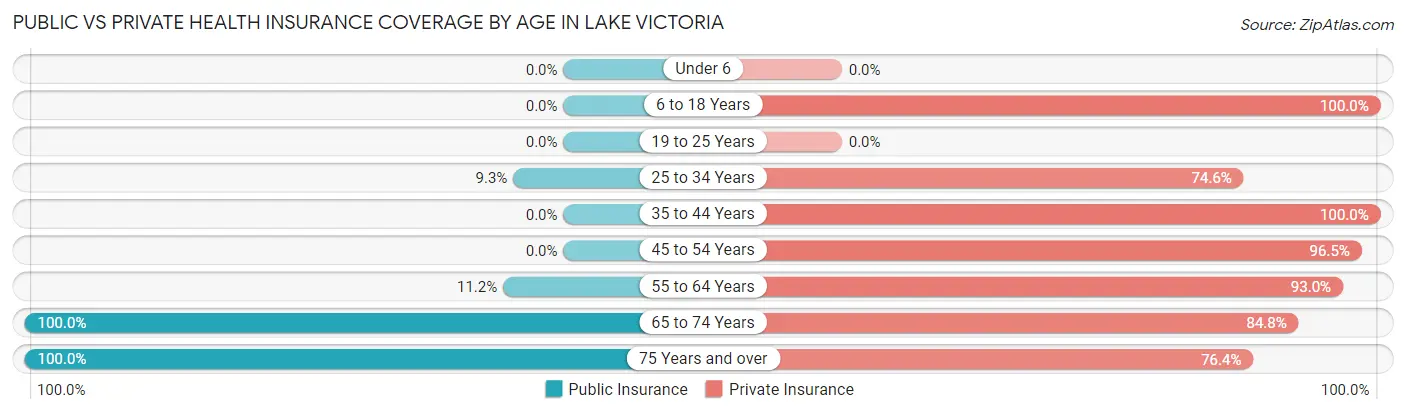
| Age Bracket | Public Insurance | Private Insurance |
| Under 6 | 0 (0.0%) | 0 (0.0%) |
| 6 to 18 Years | 0 (0.0%) | 158 (100.0%) |
| 19 to 25 Years | 0 (0.0%) | 0 (0.0%) |
| 25 to 34 Years | 11 (9.3%) | 88 (74.6%) |
| 35 to 44 Years | 0 (0.0%) | 110 (100.0%) |
| 45 to 54 Years | 0 (0.0%) | 220 (96.5%) |
| 55 to 64 Years | 16 (11.2%) | 133 (93.0%) |
| 65 to 74 Years | 138 (100.0%) | 117 (84.8%) |
| 75 Years and over | 55 (100.0%) | 42 (76.4%) |
| Total | 220 (23.2%) | 868 (91.4%) |
Disability Status by Sex by Age in Lake Victoria
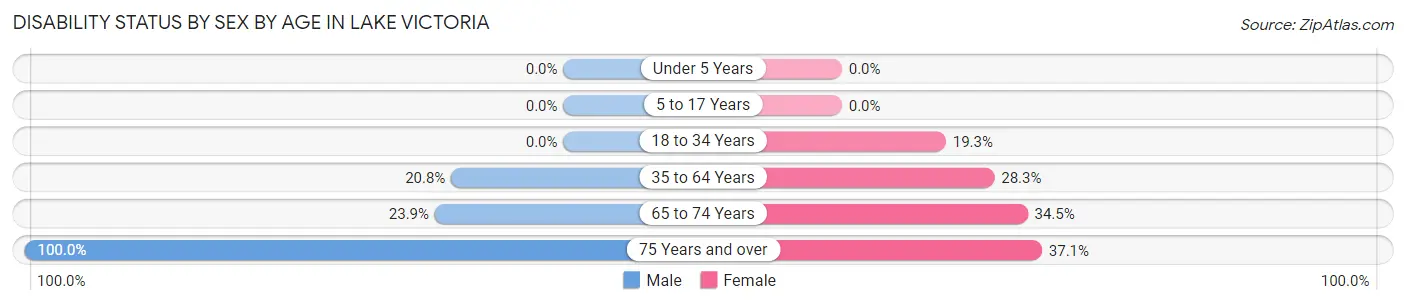
| Age Bracket | Male | Female |
| Under 5 Years | 0 (0.0%) | 0 (0.0%) |
| 5 to 17 Years | 0 (0.0%) | 0 (0.0%) |
| 18 to 34 Years | 0 (0.0%) | 11 (19.3%) |
| 35 to 64 Years | 56 (20.8%) | 60 (28.3%) |
| 65 to 74 Years | 26 (23.8%) | 10 (34.5%) |
| 75 Years and over | 20 (100.0%) | 13 (37.1%) |
Disability Class by Sex by Age in Lake Victoria
Disability Class: Hearing Difficulty
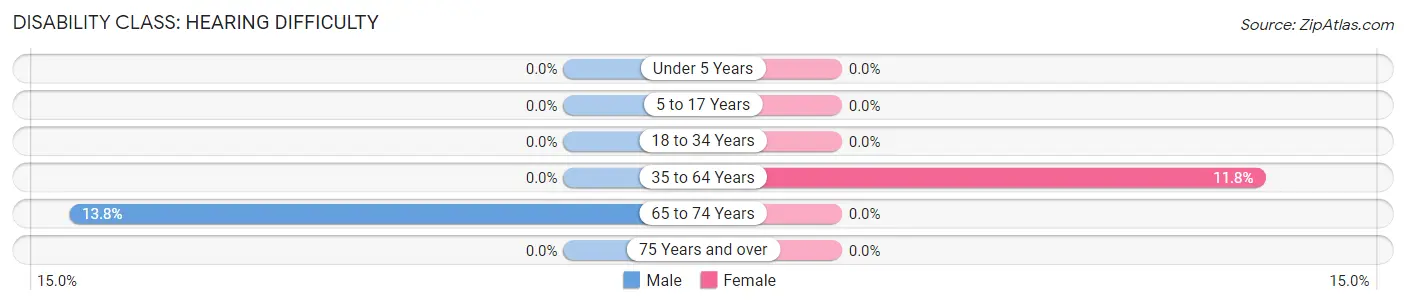
| Age Bracket | Male | Female |
| Under 5 Years | 0 (0.0%) | 0 (0.0%) |
| 5 to 17 Years | 0 (0.0%) | 0 (0.0%) |
| 18 to 34 Years | 0 (0.0%) | 0 (0.0%) |
| 35 to 64 Years | 0 (0.0%) | 25 (11.8%) |
| 65 to 74 Years | 15 (13.8%) | 0 (0.0%) |
| 75 Years and over | 0 (0.0%) | 0 (0.0%) |
Disability Class: Vision Difficulty
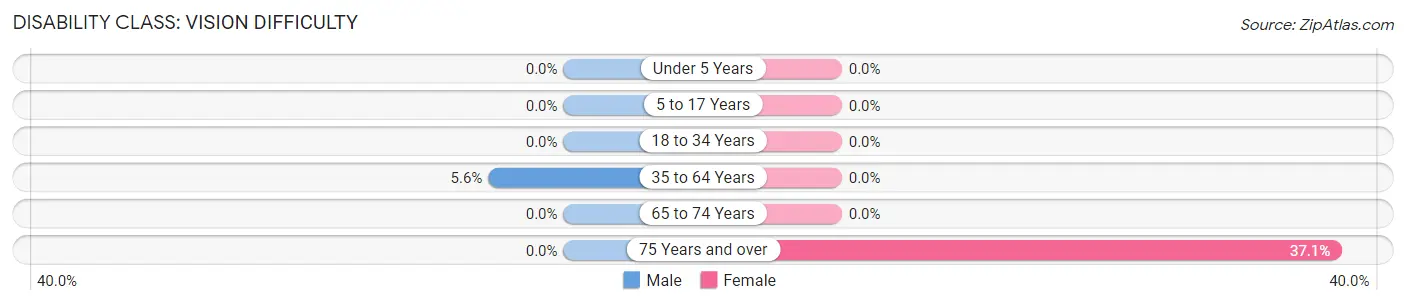
| Age Bracket | Male | Female |
| Under 5 Years | 0 (0.0%) | 0 (0.0%) |
| 5 to 17 Years | 0 (0.0%) | 0 (0.0%) |
| 18 to 34 Years | 0 (0.0%) | 0 (0.0%) |
| 35 to 64 Years | 15 (5.6%) | 0 (0.0%) |
| 65 to 74 Years | 0 (0.0%) | 0 (0.0%) |
| 75 Years and over | 0 (0.0%) | 13 (37.1%) |
Disability Class: Cognitive Difficulty
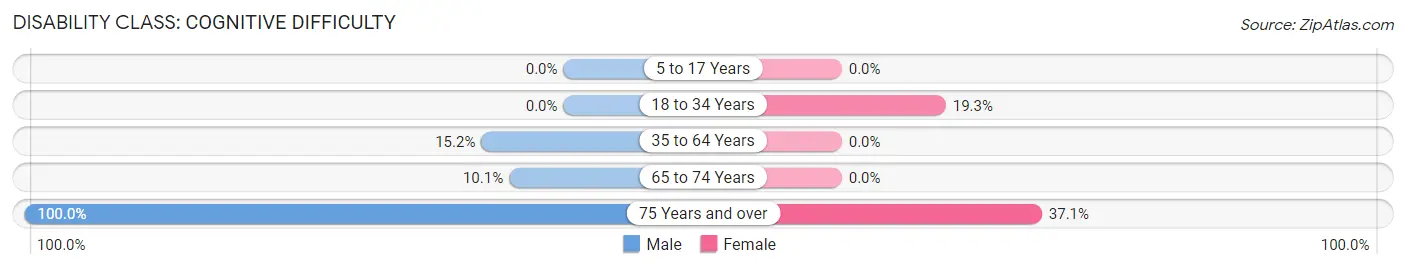
| Age Bracket | Male | Female |
| 5 to 17 Years | 0 (0.0%) | 0 (0.0%) |
| 18 to 34 Years | 0 (0.0%) | 11 (19.3%) |
| 35 to 64 Years | 41 (15.2%) | 0 (0.0%) |
| 65 to 74 Years | 11 (10.1%) | 0 (0.0%) |
| 75 Years and over | 20 (100.0%) | 13 (37.1%) |
Disability Class: Ambulatory Difficulty
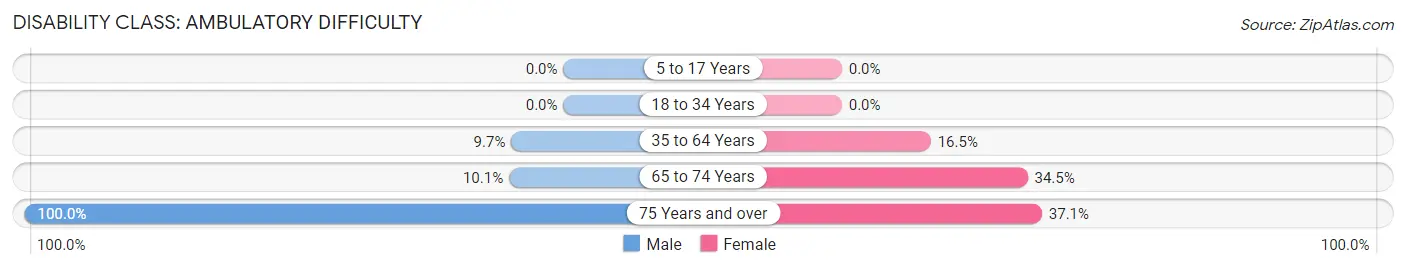
| Age Bracket | Male | Female |
| 5 to 17 Years | 0 (0.0%) | 0 (0.0%) |
| 18 to 34 Years | 0 (0.0%) | 0 (0.0%) |
| 35 to 64 Years | 26 (9.7%) | 35 (16.5%) |
| 65 to 74 Years | 11 (10.1%) | 10 (34.5%) |
| 75 Years and over | 20 (100.0%) | 13 (37.1%) |
Disability Class: Self-Care Difficulty
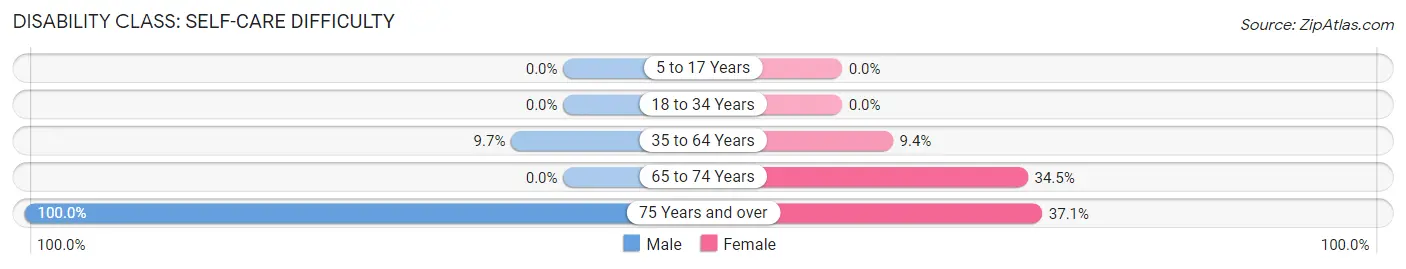
| Age Bracket | Male | Female |
| 5 to 17 Years | 0 (0.0%) | 0 (0.0%) |
| 18 to 34 Years | 0 (0.0%) | 0 (0.0%) |
| 35 to 64 Years | 26 (9.7%) | 20 (9.4%) |
| 65 to 74 Years | 0 (0.0%) | 10 (34.5%) |
| 75 Years and over | 20 (100.0%) | 13 (37.1%) |
Technology Access in Lake Victoria
Computing Device Access in Lake Victoria
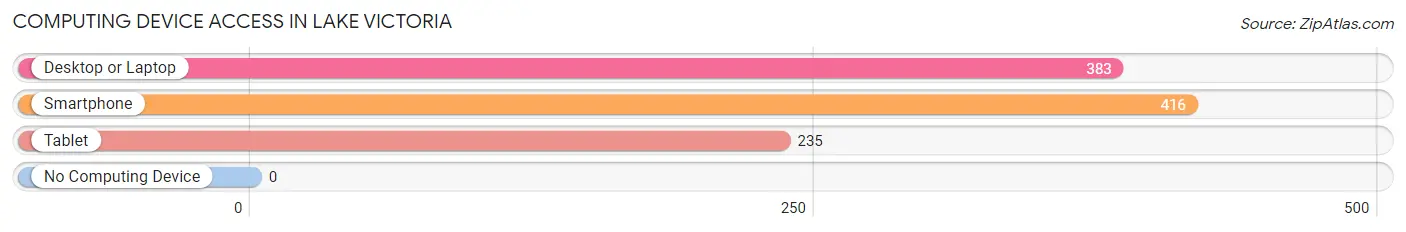
| Device Type | # Households | % Households |
| Desktop or Laptop | 383 | 92.1% |
| Smartphone | 416 | 100.0% |
| Tablet | 235 | 56.5% |
| No Computing Device | 0 | 0.0% |
| Total | 416 | 100.0% |
Internet Access in Lake Victoria
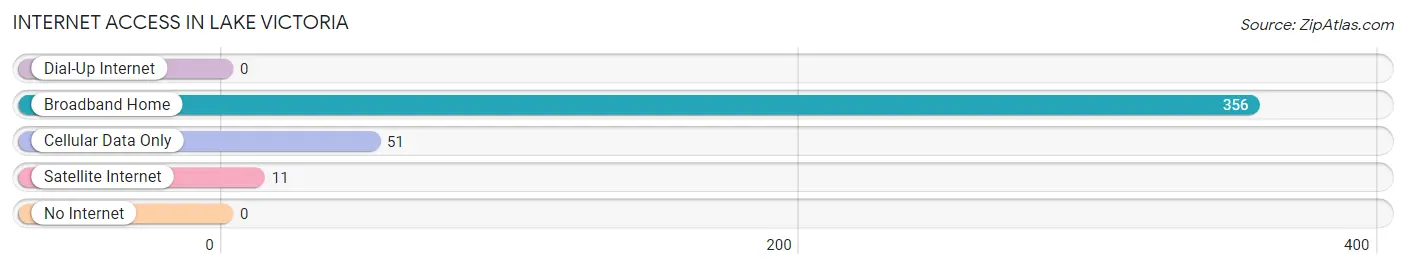
| Internet Type | # Households | % Households |
| Dial-Up Internet | 0 | 0.0% |
| Broadband Home | 356 | 85.6% |
| Cellular Data Only | 51 | 12.3% |
| Satellite Internet | 11 | 2.6% |
| No Internet | 0 | 0.0% |
| Total | 416 | 100.0% |
Lake Victoria Summary
Lake Victoria is a small lake located in the Upper Peninsula of Michigan. It is located in the western part of the state, near the border with Wisconsin. The lake is part of the Lake Superior watershed and is the largest lake in the Upper Peninsula. It is also the second largest lake in Michigan, behind Lake Michigan.
History
The lake was first discovered by French explorers in the late 1600s. The lake was named after Queen Victoria of England. The lake was used for fishing and transportation by the local Native American tribes. In the late 1800s, the lake was used for logging and commercial fishing.
In the early 1900s, the lake was used for recreational activities such as swimming, boating, and fishing. In the 1950s, the lake was developed for tourism and recreation. The lake is now a popular destination for fishing, boating, camping, and other outdoor activities.
Geography
Lake Victoria is located in the western part of the Upper Peninsula of Michigan. It is located near the border with Wisconsin. The lake is part of the Lake Superior watershed and is the largest lake in the Upper Peninsula. The lake is approximately 8 miles long and 4 miles wide. The lake has a maximum depth of about 40 feet.
The lake is surrounded by a variety of habitats, including wetlands, forests, and grasslands. The lake is home to a variety of fish species, including walleye, northern pike, smallmouth bass, and lake trout.
Economy
The economy of Lake Victoria is largely based on tourism and recreation. The lake is a popular destination for fishing, boating, camping, and other outdoor activities. The lake is also home to several resorts and lodges.
The lake is also home to several businesses that provide services to visitors, such as boat rentals, fishing guides, and restaurants. The lake is also home to several marinas, which provide boat storage and repair services.
Demographics
The population of Lake Victoria is approximately 1,000 people. The majority of the population is white (90%), followed by Native American (5%), African American (2%), and Asian (2%). The median household income is $45,000. The median age is 44 years old.
Conclusion
Lake Victoria is a small lake located in the Upper Peninsula of Michigan. It is part of the Lake Superior watershed and is the largest lake in the Upper Peninsula. The lake is a popular destination for fishing, boating, camping, and other outdoor activities. The economy of the lake is largely based on tourism and recreation. The population of the lake is approximately 1,000 people.
Common Questions
What is Per Capita Income in Lake Victoria?
Per Capita income in Lake Victoria is $55,051.
What is the Median Family Income in Lake Victoria?
Median Family Income in Lake Victoria is $105,865.
What is the Median Household income in Lake Victoria?
Median Household Income in Lake Victoria is $115,714.
What is Income or Wage Gap in Lake Victoria?
Income or Wage Gap in Lake Victoria is 12.1%.
Women in Lake Victoria earn 87.9 cents for every dollar earned by a man.
What is Inequality or Gini Index in Lake Victoria?
Inequality or Gini Index in Lake Victoria is 0.29.
What is the Total Population of Lake Victoria?
Total Population of Lake Victoria is 950.
What is the Total Male Population of Lake Victoria?
Total Male Population of Lake Victoria is 526.
What is the Total Female Population of Lake Victoria?
Total Female Population of Lake Victoria is 424.
What is the Ratio of Males per 100 Females in Lake Victoria?
There are 124.06 Males per 100 Females in Lake Victoria.
What is the Ratio of Females per 100 Males in Lake Victoria?
There are 80.61 Females per 100 Males in Lake Victoria.
What is the Median Population Age in Lake Victoria?
Median Population Age in Lake Victoria is 49.4 Years.
What is the Average Family Size in Lake Victoria
Average Family Size in Lake Victoria is 2.8 People.
What is the Average Household Size in Lake Victoria
Average Household Size in Lake Victoria is 2.3 People.
How Large is the Labor Force in Lake Victoria?
There are 607 People in the Labor Forcein in Lake Victoria.
What is the Percentage of People in the Labor Force in Lake Victoria?
72.0% of People are in the Labor Force in Lake Victoria.
What is the Unemployment Rate in Lake Victoria?
Unemployment Rate in Lake Victoria is 4.3%.