Cities with the Highest Percentage of Assyrian / Chaldean / Syriac Population in the United States
RELATED REPORTS & OPTIONS
Assyrian / Chaldean / Syriac
United States
Compare Cities
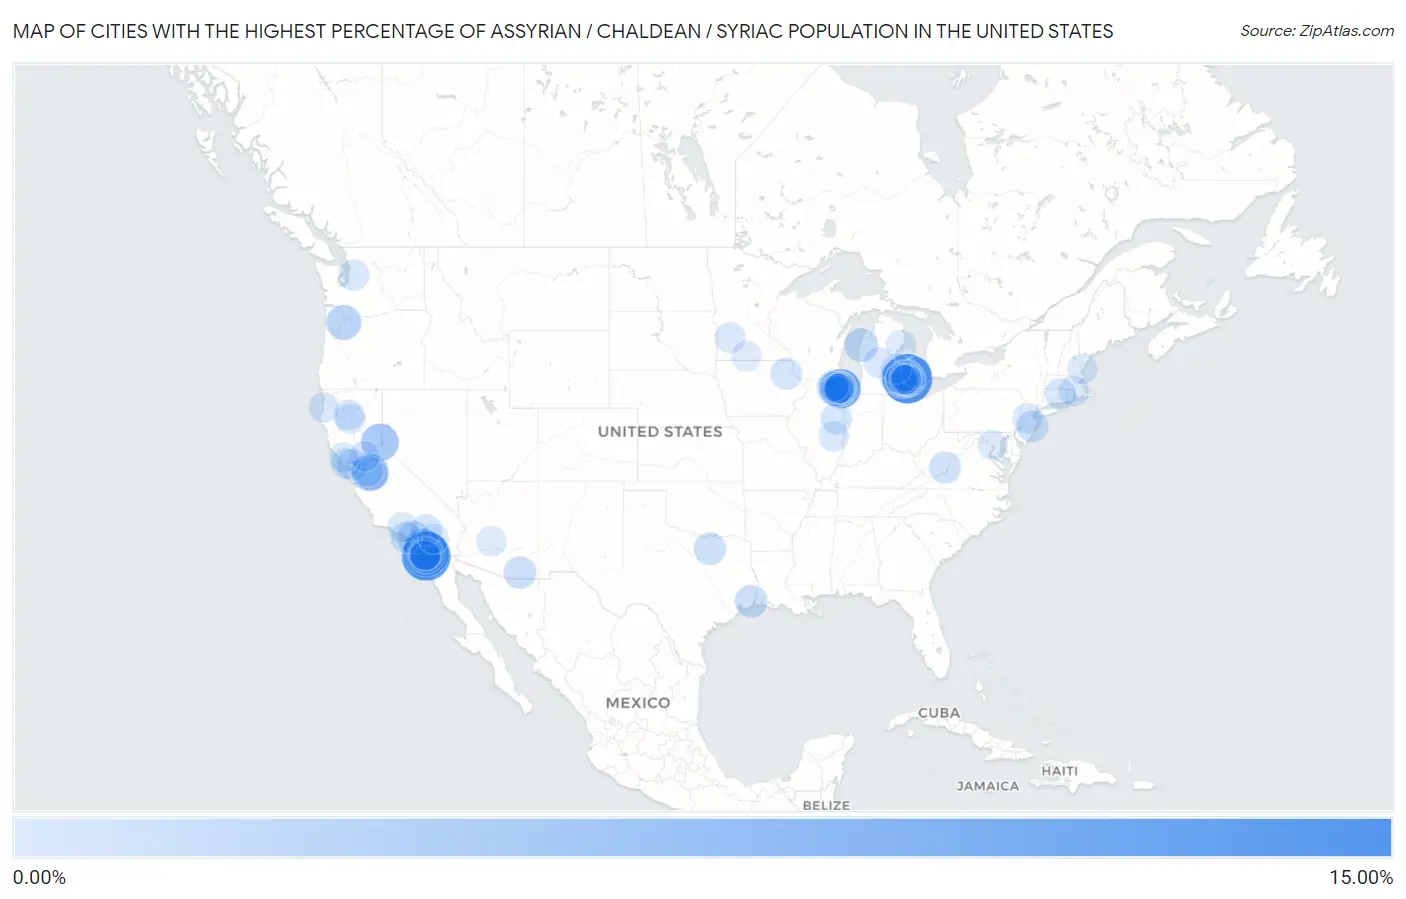
Map of Cities with the Highest Percentage of Assyrian / Chaldean / Syriac Population in the United States
0.00%
15.00%
Cities with the Highest Percentage of Assyrian / Chaldean / Syriac Population in the United States
| City | Assyrian / Chaldean / Syriac | vs State | vs National | |
| 1. | Sterling Heights | 11.50% | 0.42%(+11.1)#1 | 0.029%(+11.5)#1 |
| 2. | Jamul | 11.00% | 0.067%(+10.9)#1 | 0.029%(+11.0)#2 |
| 3. | Granite Hills | 8.86% | 0.067%(+8.79)#2 | 0.029%(+8.83)#3 |
| 4. | Orchard Lake Village | 6.32% | 0.42%(+5.90)#2 | 0.029%(+6.29)#4 |
| 5. | Skokie | 5.48% | 0.12%(+5.36)#1 | 0.029%(+5.45)#5 |
| 6. | Bloomfield Hills | 5.16% | 0.42%(+4.74)#3 | 0.029%(+5.13)#6 |
| 7. | Lincolnwood | 4.96% | 0.12%(+4.84)#2 | 0.029%(+4.93)#7 |
| 8. | Sunnyside Tahoe City | 4.49% | 0.067%(+4.42)#3 | 0.029%(+4.46)#8 |
| 9. | Turlock | 4.40% | 0.067%(+4.33)#4 | 0.029%(+4.37)#9 |
| 10. | Hidden Meadows | 4.33% | 0.067%(+4.26)#5 | 0.029%(+4.30)#10 |
| 11. | El Cajon | 4.30% | 0.067%(+4.23)#6 | 0.029%(+4.27)#11 |
| 12. | Rancho San Diego | 4.28% | 0.067%(+4.21)#7 | 0.029%(+4.25)#12 |
| 13. | Keego Harbor | 3.79% | 0.42%(+3.37)#4 | 0.029%(+3.76)#13 |
| 14. | Black Sands | 3.35% | 0.0014%(+3.35)#1 | 0.029%(+3.32)#14 |
| 15. | Stafford | 3.00% | 0.0068%(+2.99)#1 | 0.029%(+2.97)#15 |
| 16. | Rosemont | 2.85% | 0.12%(+2.73)#3 | 0.029%(+2.82)#16 |
| 17. | Morton Grove | 2.68% | 0.12%(+2.56)#4 | 0.029%(+2.65)#17 |
| 18. | Niles | 2.56% | 0.12%(+2.45)#5 | 0.029%(+2.53)#18 |
| 19. | Sylvan Lake | 2.49% | 0.42%(+2.07)#5 | 0.029%(+2.46)#19 |
| 20. | Madison Heights | 2.46% | 0.42%(+2.04)#6 | 0.029%(+2.43)#20 |
| 21. | Manistee | 2.19% | 0.42%(+1.77)#7 | 0.029%(+2.16)#21 |
| 22. | Farmington Hills | 2.18% | 0.42%(+1.76)#8 | 0.029%(+2.15)#22 |
| 23. | Walled Lake | 1.89% | 0.42%(+1.47)#9 | 0.029%(+1.86)#23 |
| 24. | Warren | 1.87% | 0.42%(+1.45)#10 | 0.029%(+1.84)#24 |
| 25. | Villa Park | 1.82% | 0.067%(+1.76)#8 | 0.029%(+1.79)#25 |
| 26. | Utica | 1.81% | 0.42%(+1.39)#11 | 0.029%(+1.78)#26 |
| 27. | Central Gardens | 1.76% | 0.0035%(+1.76)#1 | 0.029%(+1.74)#27 |
| 28. | Delhi | 1.76% | 0.067%(+1.69)#9 | 0.029%(+1.73)#28 |
| 29. | Seaview | 1.74% | 0.0014%(+1.74)#2 | 0.029%(+1.71)#29 |
| 30. | Whetstone | 1.73% | 0.068%(+1.66)#1 | 0.029%(+1.70)#30 |
| 31. | Bostonia | 1.69% | 0.067%(+1.62)#10 | 0.029%(+1.66)#31 |
| 32. | Fraser | 1.63% | 0.42%(+1.21)#12 | 0.029%(+1.60)#32 |
| 33. | Lakewood Village | 1.61% | 0.0035%(+1.60)#2 | 0.029%(+1.58)#33 |
| 34. | Novi | 1.45% | 0.42%(+1.03)#13 | 0.029%(+1.42)#34 |
| 35. | Fairlea | 1.38% | 0.0015%(+1.38)#1 | 0.029%(+1.36)#35 |
| 36. | Gilberts | 1.36% | 0.12%(+1.24)#6 | 0.029%(+1.33)#36 |
| 37. | Lakeside | 1.36% | 0.067%(+1.29)#11 | 0.029%(+1.33)#37 |
| 38. | Rochester Hills | 1.34% | 0.42%(+0.921)#14 | 0.029%(+1.31)#38 |
| 39. | Roselle | 1.31% | 0.12%(+1.19)#7 | 0.029%(+1.28)#39 |
| 40. | Chittenden | 1.28% | 0.0011%(+1.28)#1 | 0.029%(+1.25)#40 |
| 41. | Leisure Knoll | 1.26% | 0.0071%(+1.25)#1 | 0.029%(+1.23)#41 |
| 42. | Volga | 1.23% | 0.0018%(+1.23)#1 | 0.029%(+1.20)#42 |
| 43. | Ocean View | 1.22% | 0.0071%(+1.22)#2 | 0.029%(+1.20)#43 |
| 44. | Shell Ridge | 1.15% | 0.067%(+1.09)#12 | 0.029%(+1.12)#44 |
| 45. | Hazel Park | 1.15% | 0.42%(+0.730)#15 | 0.029%(+1.12)#45 |
| 46. | Big Bear Lake | 1.13% | 0.067%(+1.06)#13 | 0.029%(+1.10)#46 |
| 47. | Lomita | 1.01% | 0.067%(+0.939)#14 | 0.029%(+0.978)#47 |
| 48. | Mount Prospect | 0.92% | 0.12%(+0.806)#8 | 0.029%(+0.893)#48 |
| 49. | Modesto | 0.91% | 0.067%(+0.838)#15 | 0.029%(+0.876)#49 |
| 50. | Paxton | 0.90% | 0.12%(+0.783)#9 | 0.029%(+0.870)#50 |
| 51. | North Barrington | 0.90% | 0.12%(+0.782)#10 | 0.029%(+0.869)#51 |
| 52. | Hoffman Estates | 0.87% | 0.12%(+0.754)#11 | 0.029%(+0.841)#52 |
| 53. | Union Hill Novelty Hill | 0.86% | 0.0055%(+0.858)#1 | 0.029%(+0.834)#53 |
| 54. | Casa De Oro Mount Helix | 0.83% | 0.067%(+0.765)#16 | 0.029%(+0.804)#54 |
| 55. | Troy | 0.82% | 0.42%(+0.401)#16 | 0.029%(+0.790)#55 |
| 56. | South Coventry | 0.82% | 0.011%(+0.807)#1 | 0.029%(+0.788)#56 |
| 57. | Glenview | 0.76% | 0.12%(+0.646)#12 | 0.029%(+0.733)#57 |
| 58. | La Presa | 0.72% | 0.067%(+0.655)#17 | 0.029%(+0.693)#58 |
| 59. | Oak Park | 0.71% | 0.42%(+0.287)#17 | 0.029%(+0.676)#59 |
| 60. | Franklin Park | 0.65% | 0.12%(+0.532)#13 | 0.029%(+0.619)#60 |
| 61. | Howell | 0.64% | 0.42%(+0.218)#18 | 0.029%(+0.607)#61 |
| 62. | Spring Valley Cdp San Diego County | 0.63% | 0.067%(+0.564)#18 | 0.029%(+0.602)#62 |
| 63. | Southfield | 0.62% | 0.42%(+0.203)#19 | 0.029%(+0.592)#63 |
| 64. | Westhaven Moonstone | 0.62% | 0.067%(+0.549)#19 | 0.029%(+0.587)#64 |
| 65. | Edmore | 0.61% | 0.42%(+0.193)#20 | 0.029%(+0.581)#65 |
| 66. | Grosse Pointe Woods | 0.60% | 0.42%(+0.182)#21 | 0.029%(+0.571)#66 |
| 67. | Santa Venetia | 0.58% | 0.067%(+0.514)#20 | 0.029%(+0.552)#67 |
| 68. | Wixom | 0.58% | 0.42%(+0.158)#22 | 0.029%(+0.547)#68 |
| 69. | Shasta Lake | 0.57% | 0.067%(+0.502)#21 | 0.029%(+0.540)#69 |
| 70. | Steiner Ranch | 0.56% | 0.0035%(+0.561)#3 | 0.029%(+0.536)#70 |
| 71. | Wilton | 0.56% | 0.067%(+0.488)#22 | 0.029%(+0.526)#71 |
| 72. | Winfield | 0.55% | 0.12%(+0.437)#14 | 0.029%(+0.524)#72 |
| 73. | New Milford Borough | 0.55% | 0.0071%(+0.544)#3 | 0.029%(+0.522)#73 |
| 74. | Valley Falls | 0.54% | 0.024%(+0.514)#1 | 0.029%(+0.509)#74 |
| 75. | Wolverine Lake | 0.53% | 0.42%(+0.116)#23 | 0.029%(+0.505)#75 |
| 76. | Wood Lake | 0.53% | 0.00083%(+0.531)#1 | 0.029%(+0.503)#76 |
| 77. | Malvern Borough | 0.53% | 0.0015%(+0.530)#1 | 0.029%(+0.502)#77 |
| 78. | Park Ridge | 0.52% | 0.12%(+0.407)#15 | 0.029%(+0.494)#78 |
| 79. | Charleston | 0.52% | 0.12%(+0.407)#16 | 0.029%(+0.493)#79 |
| 80. | Marysville | 0.51% | 0.42%(+0.093)#24 | 0.029%(+0.482)#80 |
| 81. | Auburn Hills | 0.51% | 0.42%(+0.090)#25 | 0.029%(+0.479)#81 |
| 82. | Northfield | 0.51% | 0.12%(+0.392)#17 | 0.029%(+0.479)#82 |
| 83. | Anderson | 0.51% | 0.067%(+0.439)#23 | 0.029%(+0.477)#83 |
| 84. | Stevenson Ranch | 0.50% | 0.067%(+0.436)#24 | 0.029%(+0.474)#84 |
| 85. | Clawson | 0.50% | 0.42%(+0.082)#26 | 0.029%(+0.471)#85 |
| 86. | Kittery | 0.50% | 0.0036%(+0.497)#1 | 0.029%(+0.471)#86 |
| 87. | Ferndale | 0.49% | 0.42%(+0.070)#27 | 0.029%(+0.459)#87 |
| 88. | Blackwells Mills | 0.48% | 0.0071%(+0.471)#4 | 0.029%(+0.449)#88 |
| 89. | Barrington Hills | 0.46% | 0.12%(+0.347)#18 | 0.029%(+0.434)#89 |
| 90. | Tawas City | 0.46% | 0.42%(+0.039)#28 | 0.029%(+0.428)#90 |
| 91. | Flushing | 0.46% | 0.42%(+0.037)#29 | 0.029%(+0.426)#91 |
| 92. | Elk Grove Village | 0.45% | 0.12%(+0.336)#19 | 0.029%(+0.423)#92 |
| 93. | Lincoln Park Borough | 0.45% | 0.0071%(+0.443)#5 | 0.029%(+0.421)#93 |
| 94. | Granada | 0.45% | 0.00083%(+0.446)#2 | 0.029%(+0.417)#94 |
| 95. | Indian Wells | 0.43% | 0.067%(+0.367)#25 | 0.029%(+0.405)#95 |
| 96. | Bingham Farms | 0.43% | 0.42%(+0.013)#30 | 0.029%(+0.402)#96 |
| 97. | South Kensington | 0.43% | 0.0023%(+0.428)#1 | 0.029%(+0.401)#97 |
| 98. | Des Plaines | 0.43% | 0.12%(+0.310)#20 | 0.029%(+0.397)#98 |
| 99. | Rohnert Park | 0.42% | 0.067%(+0.353)#26 | 0.029%(+0.391)#99 |
| 100. | El Mirage | 0.42% | 0.068%(+0.350)#2 | 0.029%(+0.389)#100 |
Common Questions
What are the Top 10 Cities with the Highest Percentage of Assyrian / Chaldean / Syriac Population in the United States?
Top 10 Cities with the Highest Percentage of Assyrian / Chaldean / Syriac Population in the United States are:
#1
11.50%
#2
11.00%
#3
8.86%
#4
6.32%
#5
5.48%
#6
5.16%
#7
4.96%
#8
4.49%
#9
4.40%
#10
4.33%
What city has the Highest Percentage of Assyrian / Chaldean / Syriac Population in the United States?
Sterling Heights has the Highest Percentage of Assyrian / Chaldean / Syriac Population in the United States with 11.50%.
What is the Percentage of Assyrian / Chaldean / Syriac Population in the United States?
Percentage of Assyrian / Chaldean / Syriac Population in the United States is 0.029%.