Cities with the Largest Japanese Community in the United States
RELATED REPORTS & OPTIONS
Japanese
United States
Compare Cities
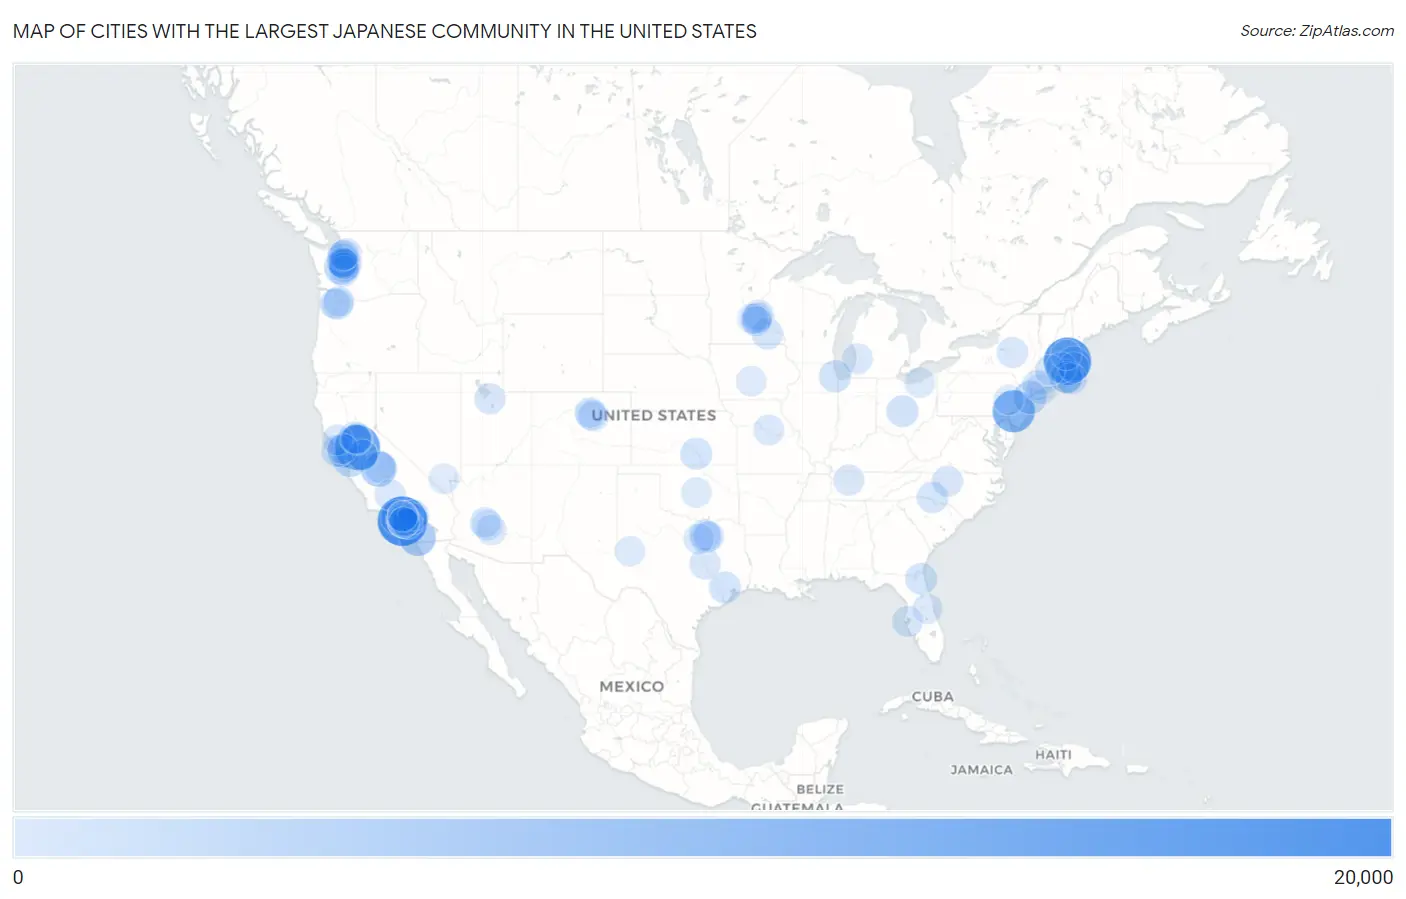
Map of Cities with the Largest Japanese Community in the United States
0
20,000
Cities with the Largest Japanese Community in the United States
| City | Japanese | vs State | vs National | |
| 1. | Long Beach | 17,866 | 122,835(14.54%)#1 | 351,951(5.08%)#1 |
| 2. | Lowell | 15,900 | 32,171(49.42%)#1 | 351,951(4.52%)#2 |
| 3. | Stockton | 13,811 | 122,835(11.24%)#2 | 351,951(3.92%)#3 |
| 4. | Philadelphia | 11,152 | 18,688(59.67%)#1 | 351,951(3.17%)#4 |
| 5. | San Diego | 6,080 | 122,835(4.95%)#3 | 351,951(1.73%)#5 |
| 6. | Fresno | 5,461 | 122,835(4.45%)#4 | 351,951(1.55%)#6 |
| 7. | Los Angeles | 5,191 | 122,835(4.23%)#5 | 351,951(1.47%)#7 |
| 8. | Lynn | 4,224 | 32,171(13.13%)#2 | 351,951(1.20%)#8 |
| 9. | Tacoma | 3,790 | 28,118(13.48%)#1 | 351,951(1.08%)#9 |
| 10. | San Jose | 3,774 | 122,835(3.07%)#6 | 351,951(1.07%)#10 |
| 11. | Providence | 3,417 | 6,731(50.77%)#1 | 351,951(0.97%)#11 |
| 12. | Oakland | 3,186 | 122,835(2.59%)#7 | 351,951(0.91%)#12 |
| 13. | New York | 3,029 | 6,529(46.39%)#1 | 351,951(0.86%)#13 |
| 14. | Modesto | 2,623 | 122,835(2.14%)#8 | 351,951(0.75%)#14 |
| 15. | Lakewood | 2,548 | 122,835(2.07%)#9 | 351,951(0.72%)#15 |
| 16. | Seattle | 1,985 | 28,118(7.06%)#2 | 351,951(0.56%)#16 |
| 17. | Chicago | 1,948 | 5,545(35.13%)#1 | 351,951(0.55%)#17 |
| 18. | Columbus | 1,847 | 6,907(26.74%)#1 | 351,951(0.52%)#18 |
| 19. | San Francisco | 1,806 | 122,835(1.47%)#10 | 351,951(0.51%)#19 |
| 20. | Wichita | 1,737 | 2,440(71.19%)#1 | 351,951(0.49%)#20 |
| 21. | Houston | 1,727 | 22,458(7.69%)#1 | 351,951(0.49%)#21 |
| 22. | Sacramento | 1,714 | 122,835(1.40%)#11 | 351,951(0.49%)#22 |
| 23. | Renton | 1,696 | 28,118(6.03%)#3 | 351,951(0.48%)#23 |
| 24. | Santa Ana | 1,651 | 122,835(1.34%)#12 | 351,951(0.47%)#24 |
| 25. | Jacksonville | 1,593 | 7,694(20.70%)#1 | 351,951(0.45%)#25 |
| 26. | Kent | 1,568 | 28,118(5.58%)#4 | 351,951(0.45%)#26 |
| 27. | Charlotte | 1,474 | 6,433(22.91%)#1 | 351,951(0.42%)#27 |
| 28. | Rochester | 1,427 | 10,101(14.13%)#1 | 351,951(0.41%)#28 |
| 29. | Portland | 1,334 | 4,718(28.27%)#1 | 351,951(0.38%)#29 |
| 30. | Cranston | 1,332 | 6,731(19.79%)#2 | 351,951(0.38%)#30 |
| 31. | Bellflower | 1,327 | 122,835(1.08%)#13 | 351,951(0.38%)#31 |
| 32. | Clovis | 1,310 | 122,835(1.07%)#14 | 351,951(0.37%)#32 |
| 33. | Anaheim | 1,288 | 122,835(1.05%)#15 | 351,951(0.37%)#33 |
| 34. | Burien | 1,276 | 28,118(4.54%)#5 | 351,951(0.36%)#34 |
| 35. | Fall River | 1,274 | 32,171(3.96%)#3 | 351,951(0.36%)#35 |
| 36. | Marlin | 1,212 | 22,458(5.40%)#2 | 351,951(0.34%)#36 |
| 37. | Greensboro | 1,084 | 6,433(16.85%)#2 | 351,951(0.31%)#37 |
| 38. | Signal Hill | 1,041 | 122,835(0.85%)#16 | 351,951(0.30%)#38 |
| 39. | Utica | 1,019 | 6,529(15.61%)#2 | 351,951(0.29%)#39 |
| 40. | West Valley City | 994 | 3,410(29.15%)#1 | 351,951(0.28%)#40 |
| 41. | Buena Park | 964 | 122,835(0.78%)#17 | 351,951(0.27%)#41 |
| 42. | Everett | 959 | 28,118(3.41%)#6 | 351,951(0.27%)#42 |
| 43. | Nashville | 942 | 2,437(38.65%)#1 | 351,951(0.27%)#43 |
| 44. | St Petersburg | 941 | 7,694(12.23%)#2 | 351,951(0.27%)#44 |
| 45. | Bridgeport | 932 | 4,486(20.78%)#1 | 351,951(0.26%)#45 |
| 46. | Vineyard | 931 | 122,835(0.76%)#18 | 351,951(0.26%)#46 |
| 47. | Dallas | 919 | 22,458(4.09%)#3 | 351,951(0.26%)#47 |
| 48. | Bakersfield | 910 | 122,835(0.74%)#19 | 351,951(0.26%)#48 |
| 49. | Pomona | 898 | 122,835(0.73%)#20 | 351,951(0.26%)#49 |
| 50. | Norwalk | 881 | 122,835(0.72%)#21 | 351,951(0.25%)#50 |
| 51. | Worcester | 875 | 32,171(2.72%)#4 | 351,951(0.25%)#51 |
| 52. | Carrollton | 842 | 22,458(3.75%)#4 | 351,951(0.24%)#52 |
| 53. | Riverside | 836 | 122,835(0.68%)#22 | 351,951(0.24%)#53 |
| 54. | Holland | 796 | 3,254(24.46%)#1 | 351,951(0.23%)#54 |
| 55. | Columbia | 793 | 2,374(33.40%)#1 | 351,951(0.23%)#55 |
| 56. | Westminster | 779 | 122,835(0.63%)#23 | 351,951(0.22%)#56 |
| 57. | South Hill | 778 | 28,118(2.77%)#7 | 351,951(0.22%)#57 |
| 58. | Boston | 763 | 32,171(2.37%)#5 | 351,951(0.22%)#58 |
| 59. | Elk Grove | 758 | 122,835(0.62%)#24 | 351,951(0.22%)#59 |
| 60. | San Bernardino | 739 | 122,835(0.60%)#25 | 351,951(0.21%)#60 |
| 61. | Ceres | 738 | 122,835(0.60%)#26 | 351,951(0.21%)#61 |
| 62. | St Paul | 722 | 10,101(7.15%)#2 | 351,951(0.21%)#62 |
| 63. | Santa Rosa | 706 | 122,835(0.57%)#27 | 351,951(0.20%)#63 |
| 64. | Alhambra | 691 | 122,835(0.56%)#28 | 351,951(0.20%)#64 |
| 65. | Danbury | 654 | 4,486(14.58%)#2 | 351,951(0.19%)#65 |
| 66. | Burnsville | 642 | 10,101(6.36%)#3 | 351,951(0.18%)#66 |
| 67. | Phoenix | 631 | 4,573(13.80%)#1 | 351,951(0.18%)#67 |
| 68. | Auburn | 629 | 28,118(2.24%)#8 | 351,951(0.18%)#68 |
| 69. | Seatac | 627 | 28,118(2.23%)#9 | 351,951(0.18%)#69 |
| 70. | Richmond | 613 | 122,835(0.50%)#29 | 351,951(0.17%)#70 |
| 71. | Eagan | 607 | 10,101(6.01%)#4 | 351,951(0.17%)#71 |
| 72. | Aloha | 606 | 4,718(12.84%)#2 | 351,951(0.17%)#72 |
| 73. | Vancouver | 601 | 28,118(2.14%)#10 | 351,951(0.17%)#73 |
| 74. | Garland | 597 | 22,458(2.66%)#5 | 351,951(0.17%)#74 |
| 75. | Aurora | 591 | 3,603(16.40%)#1 | 351,951(0.17%)#75 |
| 76. | Fort Worth | 590 | 22,458(2.63%)#6 | 351,951(0.17%)#76 |
| 77. | Las Vegas | 588 | 2,492(23.60%)#1 | 351,951(0.17%)#77 |
| 78. | Lynnwood | 583 | 28,118(2.07%)#11 | 351,951(0.17%)#78 |
| 79. | Denver | 578 | 3,603(16.04%)#2 | 351,951(0.16%)#79 |
| 80. | Shakopee | 573 | 10,101(5.67%)#5 | 351,951(0.16%)#80 |
| 81. | White Center | 560 | 28,118(1.99%)#12 | 351,951(0.16%)#81 |
| 82. | Chandler | 559 | 4,573(12.22%)#2 | 351,951(0.16%)#82 |
| 83. | Lakeville | 554 | 10,101(5.48%)#6 | 351,951(0.16%)#83 |
| 84. | Irvine | 552 | 122,835(0.45%)#30 | 351,951(0.16%)#84 |
| 85. | Peoria | 549 | 4,573(12.01%)#3 | 351,951(0.16%)#85 |
| 86. | Allentown | 545 | 18,688(2.92%)#2 | 351,951(0.15%)#86 |
| 87. | Chicopee | 545 | 32,171(1.69%)#6 | 351,951(0.15%)#87 |
| 88. | Thornton | 541 | 3,603(15.02%)#3 | 351,951(0.15%)#88 |
| 89. | Alafaya | 540 | 7,694(7.02%)#3 | 351,951(0.15%)#89 |
| 90. | Monterey Park | 540 | 122,835(0.44%)#31 | 351,951(0.15%)#90 |
| 91. | Cleveland | 537 | 6,907(7.77%)#2 | 351,951(0.15%)#91 |
| 92. | Oklahoma City | 529 | 1,160(45.60%)#1 | 351,951(0.15%)#92 |
| 93. | Garden Grove | 525 | 122,835(0.43%)#32 | 351,951(0.15%)#93 |
| 94. | Martha Lake | 525 | 28,118(1.87%)#13 | 351,951(0.15%)#94 |
| 95. | Rosemead | 518 | 122,835(0.42%)#33 | 351,951(0.15%)#95 |
| 96. | Florin | 513 | 122,835(0.42%)#34 | 351,951(0.15%)#96 |
| 97. | Huntington Beach | 511 | 122,835(0.42%)#35 | 351,951(0.15%)#97 |
| 98. | Des Moines | 507 | 1,483(34.19%)#1 | 351,951(0.14%)#98 |
| 99. | Manchester | 505 | 1,796(28.12%)#1 | 351,951(0.14%)#99 |
| 100. | Midland | 503 | 22,458(2.24%)#7 | 351,951(0.14%)#100 |
Common Questions
What are the Top 10 Cities with the Largest Japanese Community in the United States?
Top 10 Cities with the Largest Japanese Community in the United States are:
What city has the Largest Japanese Community in the United States?
Long Beach has the Largest Japanese Community in the United States with 17,866.
What is the Total Japanese Population in the United States?
Total Japanese Population in the United States is 351,951.