Zip Codes with the Highest Percentage of Population with a Degree in Education in Connecticut
RELATED REPORTS & OPTIONS
Education
Connecticut
Compare Zip Codes
Map of Zip Codes with the Highest Percentage of Population with a Degree in Education in Connecticut
10.0%
30.0%
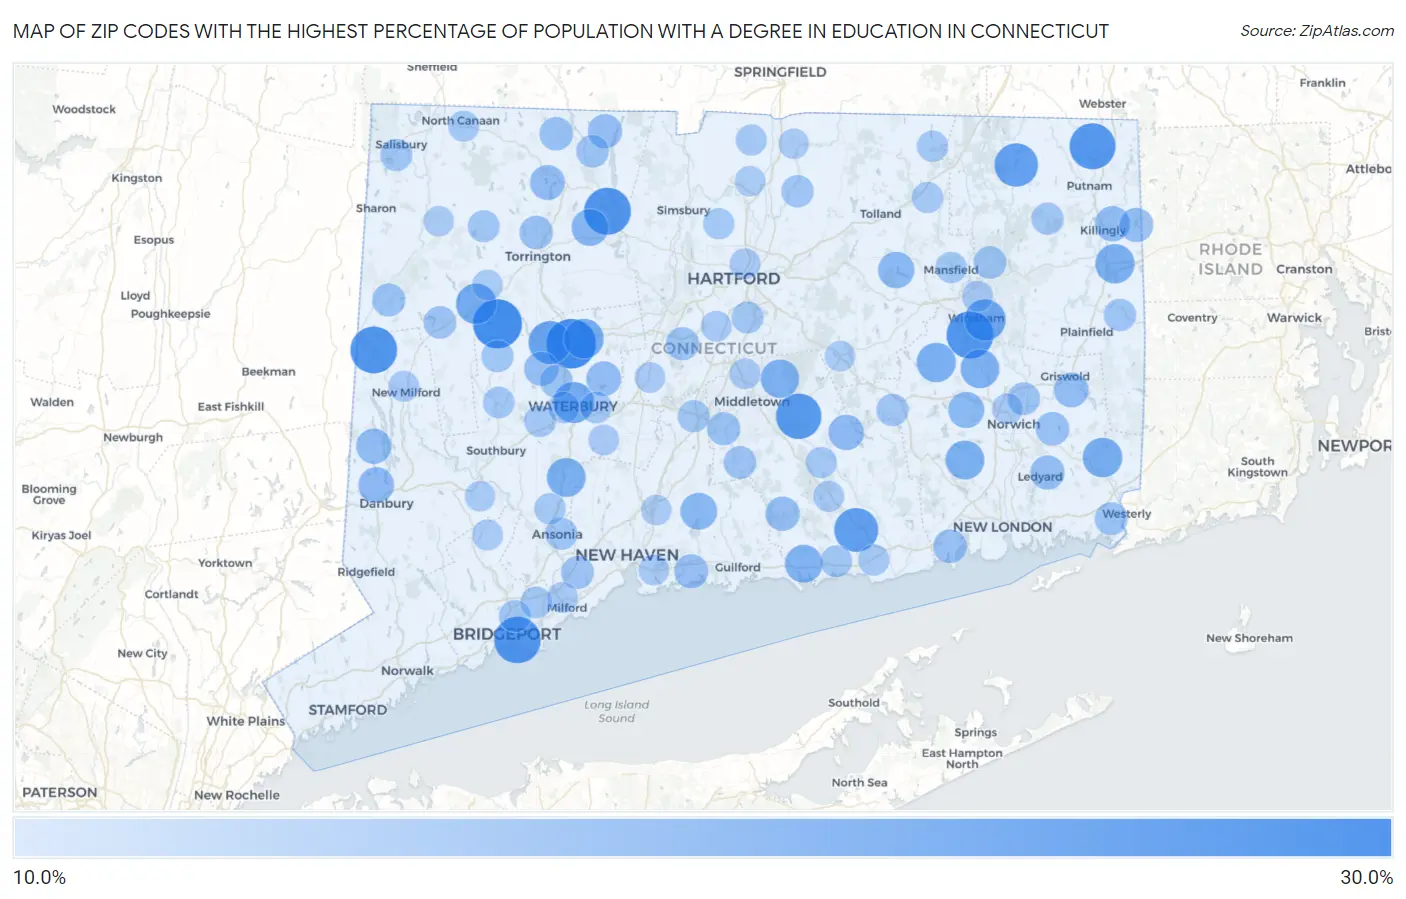
Zip Codes with the Highest Percentage of Population with a Degree in Education in Connecticut
| Zip Code | % Graduates | vs State | vs National | |
| 1. | 06782 | 28.6% | 9.5% (+19.1)#1 | 11.1% (+17.5)#5,036 |
| 2. | 06763 | 28.1% | 9.5% (+18.6)#2 | 11.1% (+17.0)#5,275 |
| 3. | 06266 | 26.3% | 9.5% (+16.7)#3 | 11.1% (+15.2)#6,169 |
| 4. | 06061 | 26.2% | 9.5% (+16.7)#4 | 11.1% (+15.2)#6,192 |
| 5. | 06755 | 26.1% | 9.5% (+16.6)#5 | 11.1% (+15.0)#6,268 |
| 6. | 06607 | 25.9% | 9.5% (+16.4)#6 | 11.1% (+14.8)#6,359 |
| 7. | 06255 | 25.4% | 9.5% (+15.9)#7 | 11.1% (+14.3)#6,666 |
| 8. | 06456 | 24.9% | 9.5% (+15.4)#8 | 11.1% (+13.8)#6,992 |
| 9. | 06409 | 23.6% | 9.5% (+14.1)#9 | 11.1% (+12.5)#7,803 |
| 10. | 06282 | 23.1% | 9.5% (+13.6)#10 | 11.1% (+12.1)#8,115 |
| 11. | 06787 | 22.6% | 9.5% (+13.1)#11 | 11.1% (+11.5)#8,482 |
| 12. | 06280 | 21.4% | 9.5% (+11.9)#12 | 11.1% (+10.4)#9,347 |
| 13. | 06702 | 20.9% | 9.5% (+11.4)#13 | 11.1% (+9.89)#9,742 |
| 14. | 06750 | 20.5% | 9.5% (+11.0)#14 | 11.1% (+9.47)#10,083 |
| 15. | 06786 | 20.1% | 9.5% (+10.6)#15 | 11.1% (+9.07)#10,426 |
| 16. | 06359 | 19.7% | 9.5% (+10.2)#16 | 11.1% (+8.69)#10,756 |
| 17. | 06239 | 19.5% | 9.5% (+9.97)#17 | 11.1% (+8.41)#11,018 |
| 18. | 06249 | 19.5% | 9.5% (+9.95)#18 | 11.1% (+8.39)#11,038 |
| 19. | 06403 | 19.1% | 9.5% (+9.59)#19 | 11.1% (+8.03)#11,330 |
| 20. | 06370 | 19.0% | 9.5% (+9.53)#20 | 11.1% (+7.97)#11,379 |
| 21. | 06254 | 19.0% | 9.5% (+9.46)#21 | 11.1% (+7.91)#11,430 |
| 22. | 06480 | 18.7% | 9.5% (+9.17)#22 | 11.1% (+7.61)#11,726 |
| 23. | 06413 | 18.1% | 9.5% (+8.64)#23 | 11.1% (+7.08)#12,244 |
| 24. | 06057 | 17.4% | 9.5% (+7.87)#24 | 11.1% (+6.32)#12,996 |
| 25. | 06472 | 17.3% | 9.5% (+7.79)#25 | 11.1% (+6.23)#13,082 |
| 26. | 06238 | 16.9% | 9.5% (+7.38)#26 | 11.1% (+5.83)#13,557 |
| 27. | 06334 | 16.7% | 9.5% (+7.17)#27 | 11.1% (+5.61)#13,767 |
| 28. | 06811 | 16.3% | 9.5% (+6.85)#28 | 11.1% (+5.29)#14,158 |
| 29. | 06469 | 16.1% | 9.5% (+6.56)#29 | 11.1% (+5.00)#14,451 |
| 30. | 06812 | 16.0% | 9.5% (+6.46)#30 | 11.1% (+4.90)#14,555 |
| 31. | 06241 | 15.9% | 9.5% (+6.41)#31 | 11.1% (+4.85)#14,594 |
| 32. | 06098 | 15.7% | 9.5% (+6.21)#32 | 11.1% (+4.65)#14,857 |
| 33. | 06716 | 15.6% | 9.5% (+6.07)#33 | 11.1% (+4.52)#14,985 |
| 34. | 06351 | 15.5% | 9.5% (+6.00)#34 | 11.1% (+4.44)#15,061 |
| 35. | 06419 | 15.2% | 9.5% (+5.66)#35 | 11.1% (+4.10)#15,473 |
| 36. | 06339 | 15.1% | 9.5% (+5.61)#36 | 11.1% (+4.05)#15,532 |
| 37. | 06795 | 15.1% | 9.5% (+5.61)#37 | 11.1% (+4.05)#15,540 |
| 38. | 06091 | 15.1% | 9.5% (+5.59)#38 | 11.1% (+4.04)#15,556 |
| 39. | 06243 | 15.0% | 9.5% (+5.50)#39 | 11.1% (+3.94)#15,707 |
| 40. | 06405 | 14.9% | 9.5% (+5.35)#40 | 11.1% (+3.79)#15,888 |
| 41. | 06357 | 14.6% | 9.5% (+5.07)#41 | 11.1% (+3.51)#16,234 |
| 42. | 06365 | 14.5% | 9.5% (+5.01)#42 | 11.1% (+3.46)#16,319 |
| 43. | 06021 | 14.5% | 9.5% (+5.01)#43 | 11.1% (+3.45)#16,325 |
| 44. | 06790 | 14.5% | 9.5% (+4.97)#44 | 11.1% (+3.42)#16,357 |
| 45. | 06052 | 14.2% | 9.5% (+4.70)#45 | 11.1% (+3.14)#16,775 |
| 46. | 06455 | 14.1% | 9.5% (+4.61)#46 | 11.1% (+3.06)#16,870 |
| 47. | 06757 | 14.1% | 9.5% (+4.59)#47 | 11.1% (+3.03)#16,901 |
| 48. | 06379 | 14.0% | 9.5% (+4.51)#48 | 11.1% (+2.95)#17,011 |
| 49. | 06477 | 13.9% | 9.5% (+4.42)#49 | 11.1% (+2.86)#17,118 |
| 50. | 06422 | 13.8% | 9.5% (+4.34)#50 | 11.1% (+2.79)#17,214 |
| 51. | 06779 | 13.8% | 9.5% (+4.29)#51 | 11.1% (+2.73)#17,293 |
| 52. | 06235 | 13.8% | 9.5% (+4.28)#52 | 11.1% (+2.72)#17,309 |
| 53. | 06380 | 13.7% | 9.5% (+4.20)#53 | 11.1% (+2.65)#17,401 |
| 54. | 06065 | 13.7% | 9.5% (+4.20)#54 | 11.1% (+2.64)#17,406 |
| 55. | 06777 | 13.7% | 9.5% (+4.19)#55 | 11.1% (+2.64)#17,420 |
| 56. | 06354 | 13.5% | 9.5% (+3.99)#56 | 11.1% (+2.43)#17,655 |
| 57. | 06415 | 13.5% | 9.5% (+3.98)#57 | 11.1% (+2.42)#17,663 |
| 58. | 06016 | 13.4% | 9.5% (+3.87)#58 | 11.1% (+2.31)#17,792 |
| 59. | 06401 | 13.3% | 9.5% (+3.83)#59 | 11.1% (+2.27)#17,860 |
| 60. | 06259 | 13.3% | 9.5% (+3.76)#60 | 11.1% (+2.20)#17,942 |
| 61. | 06039 | 13.2% | 9.5% (+3.74)#61 | 11.1% (+2.18)#17,955 |
| 62. | 06450 | 13.2% | 9.5% (+3.73)#62 | 11.1% (+2.17)#17,968 |
| 63. | 06751 | 13.2% | 9.5% (+3.71)#63 | 11.1% (+2.16)#17,988 |
| 64. | 06610 | 13.2% | 9.5% (+3.69)#64 | 11.1% (+2.14)#18,015 |
| 65. | 06109 | 13.1% | 9.5% (+3.61)#65 | 11.1% (+2.06)#18,104 |
| 66. | 06756 | 13.0% | 9.5% (+3.52)#66 | 11.1% (+1.96)#18,219 |
| 67. | 06498 | 13.0% | 9.5% (+3.51)#67 | 11.1% (+1.95)#18,229 |
| 68. | 06614 | 12.9% | 9.5% (+3.41)#68 | 11.1% (+1.85)#18,373 |
| 69. | 06705 | 12.9% | 9.5% (+3.39)#69 | 11.1% (+1.83)#18,399 |
| 70. | 06798 | 12.8% | 9.5% (+3.32)#70 | 11.1% (+1.76)#18,486 |
| 71. | 06762 | 12.8% | 9.5% (+3.31)#71 | 11.1% (+1.75)#18,495 |
| 72. | 06708 | 12.8% | 9.5% (+3.26)#72 | 11.1% (+1.70)#18,565 |
| 73. | 06250 | 12.6% | 9.5% (+3.14)#73 | 11.1% (+1.59)#18,701 |
| 74. | 06483 | 12.6% | 9.5% (+3.07)#74 | 11.1% (+1.51)#18,804 |
| 75. | 06475 | 12.5% | 9.5% (+3.01)#75 | 11.1% (+1.45)#18,868 |
| 76. | 06076 | 12.5% | 9.5% (+3.01)#76 | 11.1% (+1.45)#18,870 |
| 77. | 06279 | 12.5% | 9.5% (+2.96)#77 | 11.1% (+1.40)#18,998 |
| 78. | 06438 | 12.4% | 9.5% (+2.93)#78 | 11.1% (+1.38)#19,021 |
| 79. | 06078 | 12.4% | 9.5% (+2.89)#79 | 11.1% (+1.34)#19,075 |
| 80. | 06002 | 12.4% | 9.5% (+2.88)#80 | 11.1% (+1.32)#19,092 |
| 81. | 06024 | 12.3% | 9.5% (+2.79)#81 | 11.1% (+1.24)#19,215 |
| 82. | 06256 | 12.3% | 9.5% (+2.75)#82 | 11.1% (+1.20)#19,256 |
| 83. | 06412 | 12.2% | 9.5% (+2.75)#83 | 11.1% (+1.19)#19,269 |
| 84. | 06461 | 12.2% | 9.5% (+2.74)#84 | 11.1% (+1.18)#19,278 |
| 85. | 06360 | 12.2% | 9.5% (+2.71)#85 | 11.1% (+1.15)#19,319 |
| 86. | 06468 | 12.2% | 9.5% (+2.68)#86 | 11.1% (+1.12)#19,353 |
| 87. | 06416 | 12.1% | 9.5% (+2.64)#87 | 11.1% (+1.09)#19,404 |
| 88. | 06776 | 12.1% | 9.5% (+2.60)#88 | 11.1% (+1.04)#19,473 |
| 89. | 06712 | 12.1% | 9.5% (+2.56)#89 | 11.1% (+0.998)#19,539 |
| 90. | 06120 | 12.0% | 9.5% (+2.54)#90 | 11.1% (+0.986)#19,552 |
| 91. | 06759 | 12.0% | 9.5% (+2.53)#91 | 11.1% (+0.974)#19,576 |
| 92. | 06512 | 12.0% | 9.5% (+2.51)#92 | 11.1% (+0.950)#19,606 |
| 93. | 06489 | 12.0% | 9.5% (+2.50)#93 | 11.1% (+0.946)#19,612 |
| 94. | 06111 | 12.0% | 9.5% (+2.50)#94 | 11.1% (+0.938)#19,630 |
| 95. | 06447 | 11.9% | 9.5% (+2.37)#95 | 11.1% (+0.816)#19,802 |
| 96. | 06096 | 11.8% | 9.5% (+2.34)#96 | 11.1% (+0.782)#19,844 |
| 97. | 06473 | 11.8% | 9.5% (+2.31)#97 | 11.1% (+0.749)#19,884 |
| 98. | 06482 | 11.8% | 9.5% (+2.29)#98 | 11.1% (+0.730)#19,899 |
| 99. | 06796 | 11.8% | 9.5% (+2.28)#99 | 11.1% (+0.722)#19,912 |
| 100. | 06082 | 11.8% | 9.5% (+2.26)#100 | 11.1% (+0.704)#19,956 |
Common Questions
What are the Top 10 Zip Codes with the Highest Percentage of Population with a Degree in Education in Connecticut?
Top 10 Zip Codes with the Highest Percentage of Population with a Degree in Education in Connecticut are:
What zip code has the Highest Percentage of Population with a Degree in Education in Connecticut?
06782 has the Highest Percentage of Population with a Degree in Education in Connecticut with 28.6%.
What is the Percentage of Population with a Degree in Education in the State of Connecticut?
Percentage of Population with a Degree in Education in Connecticut is 9.5%.
What is the Percentage of Population with a Degree in Education in the United States?
Percentage of Population with a Degree in Education in the United States is 11.1%.