Zip Codes with the Highest Percentage of Population Employed in Legal Services & Support in Danbury, CT
RELATED REPORTS & OPTIONS
Legal Services & Support
Danbury
Compare Zip Codes
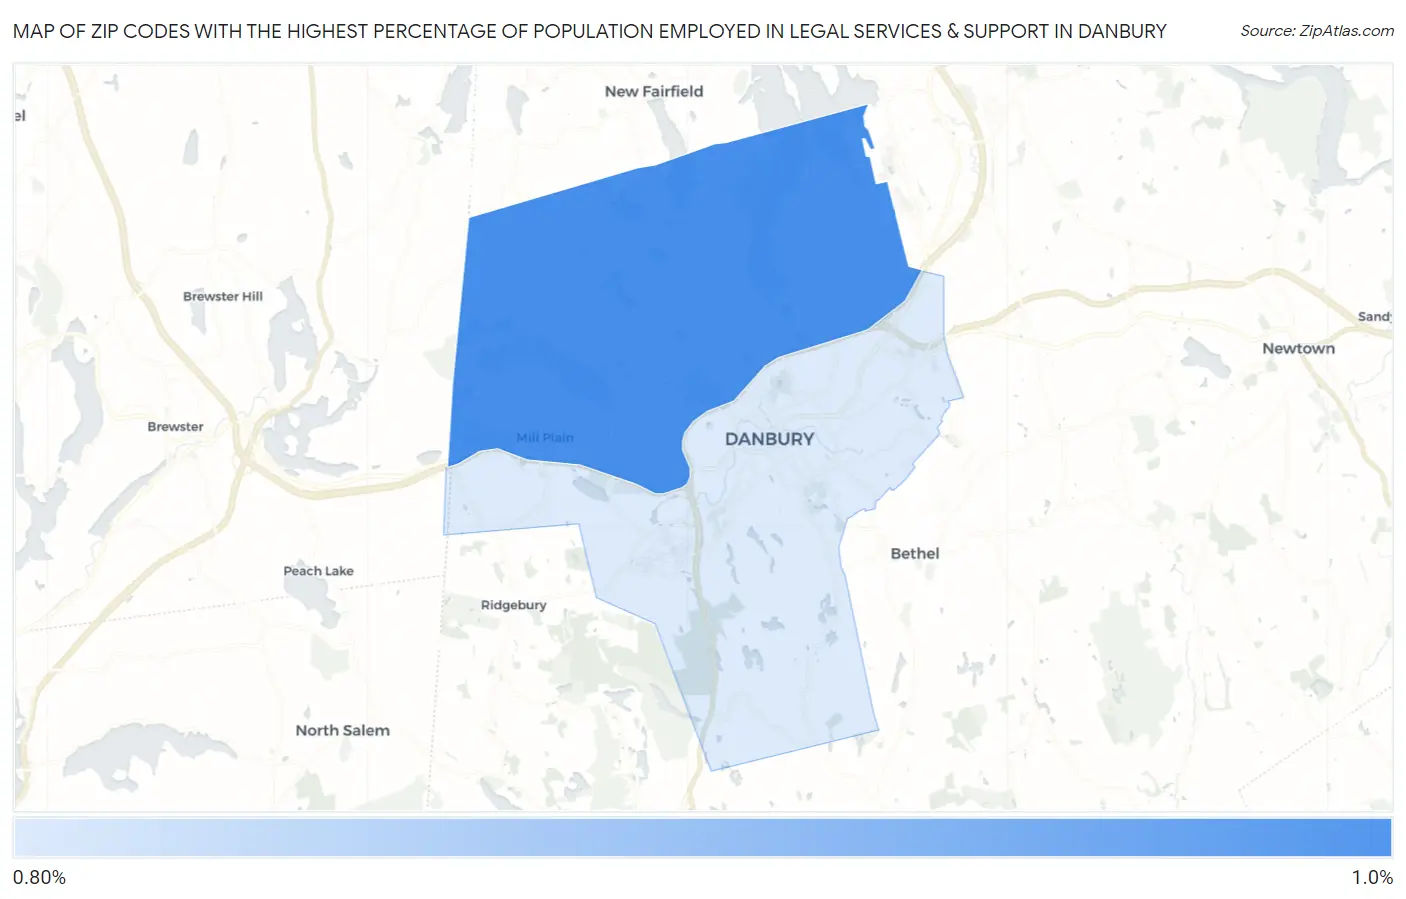
Map of Zip Codes with the Highest Percentage of Population Employed in Legal Services & Support in Danbury
0.82%
0.99%
Zip Codes with the Highest Percentage of Population Employed in Legal Services & Support in Danbury, CT
| Zip Code | % Employed | vs State | vs National | |
| 1. | 06811 | 0.99% | 1.4%(-0.426)#138 | 1.2%(-0.192)#7,885 |
| 2. | 06810 | 0.82% | 1.4%(-0.599)#154 | 1.2%(-0.365)#9,287 |
1
Common Questions
What are the Top Zip Codes with the Highest Percentage of Population Employed in Legal Services & Support in Danbury, CT?
Top Zip Codes with the Highest Percentage of Population Employed in Legal Services & Support in Danbury, CT are:
What zip code has the Highest Percentage of Population Employed in Legal Services & Support in Danbury, CT?
06811 has the Highest Percentage of Population Employed in Legal Services & Support in Danbury, CT with 0.99%.
What is the Percentage of Population Employed in Legal Services & Support in Danbury, CT?
Percentage of Population Employed in Legal Services & Support in Danbury is 0.88%.
What is the Percentage of Population Employed in Legal Services & Support in Connecticut?
Percentage of Population Employed in Legal Services & Support in Connecticut is 1.4%.
What is the Percentage of Population Employed in Legal Services & Support in the United States?
Percentage of Population Employed in Legal Services & Support in the United States is 1.2%.