Redland, MD Map & Demographics
Redland Map
Redland Overview
$47,640
PER CAPITA INCOME
$130,273
AVG FAMILY INCOME
$125,480
AVG HOUSEHOLD INCOME
19.4%
WAGE / INCOME GAP [ % ]
80.6¢/ $1
WAGE / INCOME GAP [ $ ]
$8,185
FAMILY INCOME DEFICIT
0.38
INEQUALITY / GINI INDEX
18,346
TOTAL POPULATION
9,045
MALE POPULATION
9,301
FEMALE POPULATION
97.25
MALES / 100 FEMALES
102.83
FEMALES / 100 MALES
40.4
MEDIAN AGE
3.5
AVG FAMILY SIZE
3.2
AVG HOUSEHOLD SIZE
10,126
LABOR FORCE [ PEOPLE ]
69.0%
PERCENT IN LABOR FORCE
4.0%
UNEMPLOYMENT RATE
Income in Redland
Income Overview in Redland
Per Capita Income in Redland is $47,640, while median incomes of families and households are $130,273 and $125,480 respectively.
| Characteristic | Number | Measure |
| Per Capita Income | 18,346 | $47,640 |
| Median Family Income | 4,637 | $130,273 |
| Mean Family Income | 4,637 | $152,834 |
| Median Household Income | 5,719 | $125,480 |
| Mean Household Income | 5,719 | $149,479 |
| Income Deficit | 4,637 | $8,185 |
| Wage / Income Gap (%) | 18,346 | 19.43% |
| Wage / Income Gap ($) | 18,346 | 80.57¢ per $1 |
| Gini / Inequality Index | 18,346 | 0.38 |
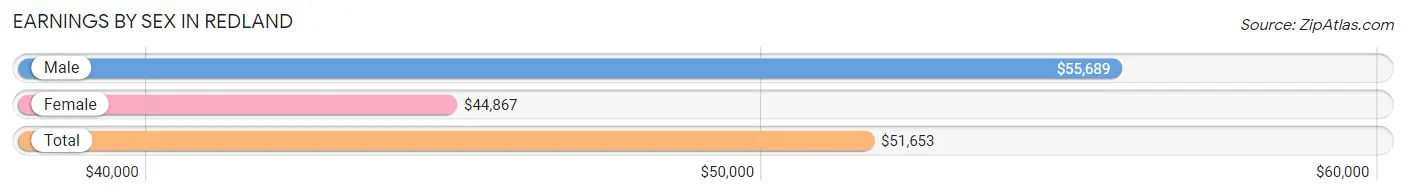
Earnings by Sex in Redland
Average Earnings in Redland are $51,653, $55,689 for men and $44,867 for women, a difference of 19.4%.
| Sex | Number | Average Earnings |
| Male | 5,247 (51.1%) | $55,689 |
| Female | 5,015 (48.9%) | $44,867 |
| Total | 10,262 (100.0%) | $51,653 |
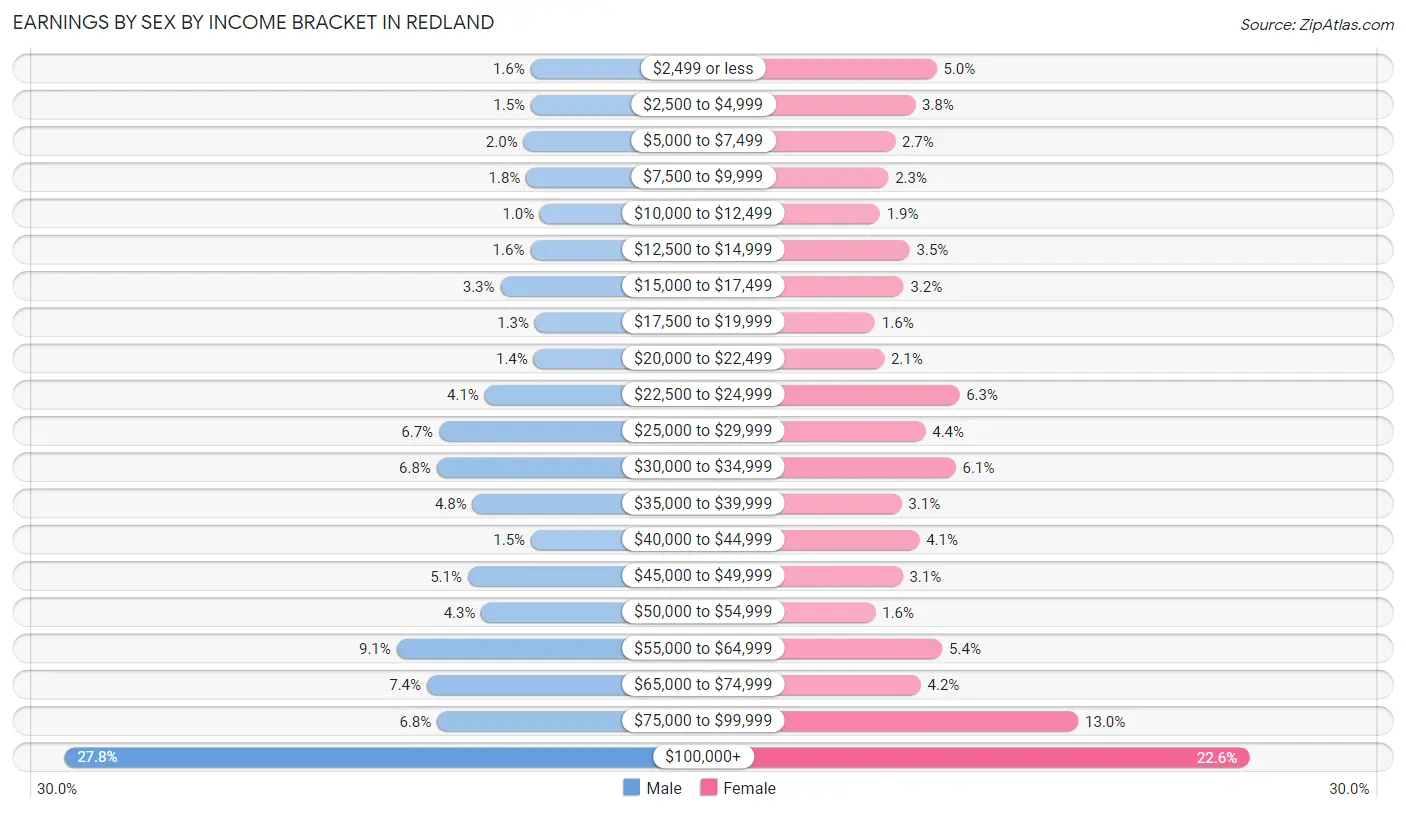
Earnings by Sex by Income Bracket in Redland
The most common earnings brackets in Redland are $100,000+ for men (1,457 | 27.8%) and $100,000+ for women (1,134 | 22.6%).
| Income | Male | Female |
| $2,499 or less | 82 (1.6%) | 253 (5.0%) |
| $2,500 to $4,999 | 81 (1.5%) | 192 (3.8%) |
| $5,000 to $7,499 | 103 (2.0%) | 136 (2.7%) |
| $7,500 to $9,999 | 95 (1.8%) | 117 (2.3%) |
| $10,000 to $12,499 | 54 (1.0%) | 93 (1.8%) |
| $12,500 to $14,999 | 83 (1.6%) | 177 (3.5%) |
| $15,000 to $17,499 | 171 (3.3%) | 160 (3.2%) |
| $17,500 to $19,999 | 69 (1.3%) | 79 (1.6%) |
| $20,000 to $22,499 | 73 (1.4%) | 105 (2.1%) |
| $22,500 to $24,999 | 217 (4.1%) | 317 (6.3%) |
| $25,000 to $29,999 | 352 (6.7%) | 221 (4.4%) |
| $30,000 to $34,999 | 359 (6.8%) | 307 (6.1%) |
| $35,000 to $39,999 | 253 (4.8%) | 154 (3.1%) |
| $40,000 to $44,999 | 81 (1.5%) | 204 (4.1%) |
| $45,000 to $49,999 | 267 (5.1%) | 157 (3.1%) |
| $50,000 to $54,999 | 227 (4.3%) | 80 (1.6%) |
| $55,000 to $64,999 | 477 (9.1%) | 269 (5.4%) |
| $65,000 to $74,999 | 388 (7.4%) | 208 (4.2%) |
| $75,000 to $99,999 | 358 (6.8%) | 652 (13.0%) |
| $100,000+ | 1,457 (27.8%) | 1,134 (22.6%) |
| Total | 5,247 (100.0%) | 5,015 (100.0%) |
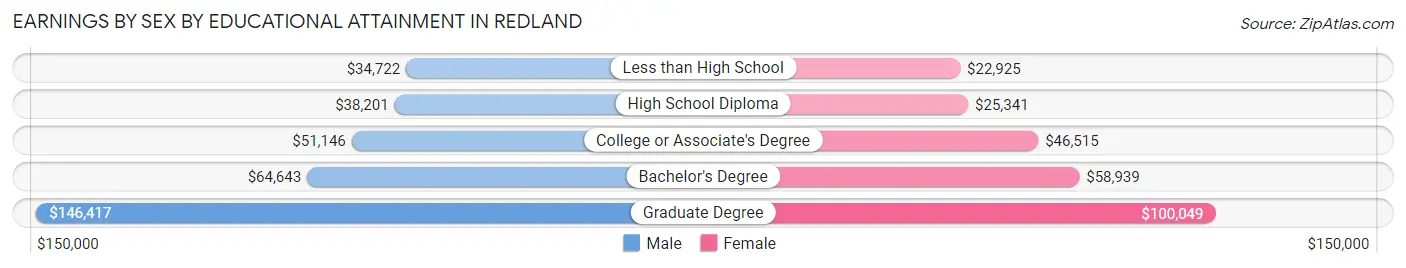
Earnings by Sex by Educational Attainment in Redland
Average earnings in Redland are $59,543 for men and $54,750 for women, a difference of 8.1%. Men with an educational attainment of graduate degree enjoy the highest average annual earnings of $146,417, while those with less than high school education earn the least with $34,722. Women with an educational attainment of graduate degree earn the most with the average annual earnings of $100,049, while those with less than high school education have the smallest earnings of $22,925.
| Educational Attainment | Male Income | Female Income |
| Less than High School | $34,722 | $22,925 |
| High School Diploma | $38,201 | $25,341 |
| College or Associate's Degree | $51,146 | $46,515 |
| Bachelor's Degree | $64,643 | $58,939 |
| Graduate Degree | $146,417 | $100,049 |
| Total | $59,543 | $54,750 |
Family Income in Redland
Family Income Brackets in Redland
According to the Redland family income data, there are 1,243 families falling into the $200,000+ income range, which is the most common income bracket and makes up 26.8% of all families. Conversely, the less than $10,000 income bracket is the least frequent group with only 23 families (0.5%) belonging to this category.
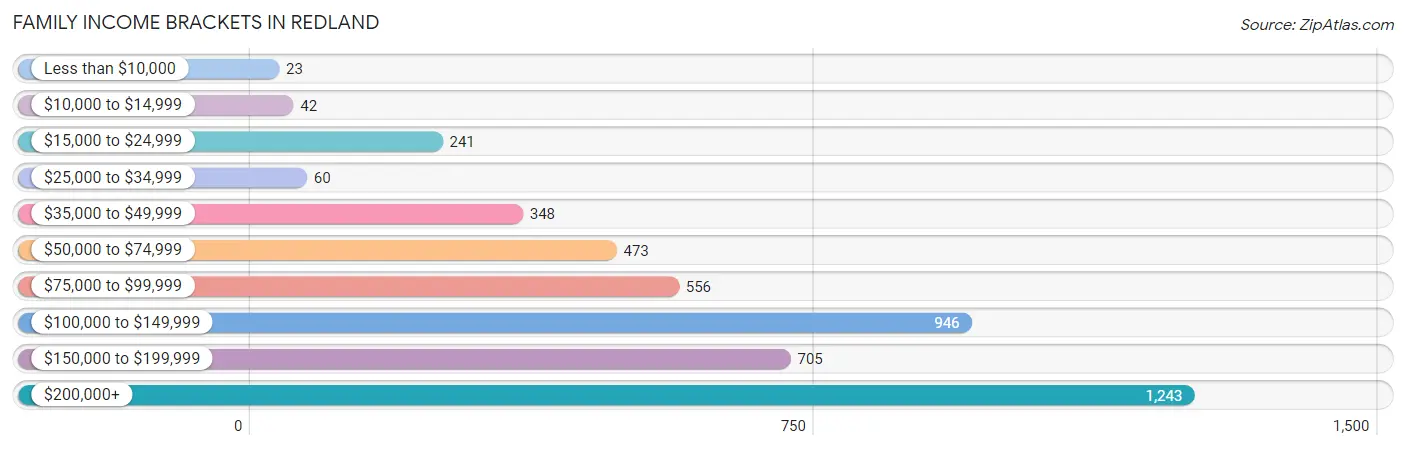
| Income Bracket | # Families | % Families |
| Less than $10,000 | 23 | 0.5% |
| $10,000 to $14,999 | 42 | 0.9% |
| $15,000 to $24,999 | 241 | 5.2% |
| $25,000 to $34,999 | 60 | 1.3% |
| $35,000 to $49,999 | 348 | 7.5% |
| $50,000 to $74,999 | 473 | 10.2% |
| $75,000 to $99,999 | 556 | 12.0% |
| $100,000 to $149,999 | 946 | 20.4% |
| $150,000 to $199,999 | 705 | 15.2% |
| $200,000+ | 1,243 | 26.8% |
Family Income by Famaliy Size in Redland
3-person families (822 | 17.7%) account for the highest median family income in Redland with $168,026 per family, while 2-person families (1,711 | 36.9%) have the highest median income of $62,676 per family member.
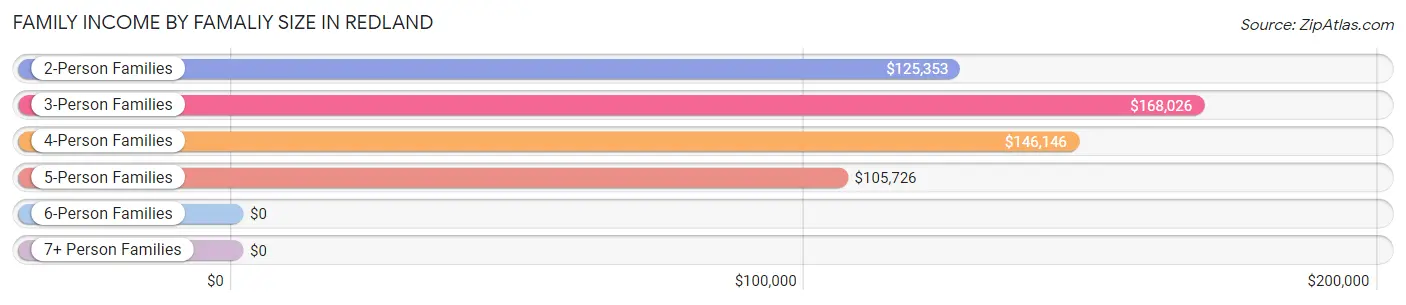
| Income Bracket | # Families | Median Income |
| 2-Person Families | 1,711 (36.9%) | $125,353 |
| 3-Person Families | 822 (17.7%) | $168,026 |
| 4-Person Families | 1,069 (23.1%) | $146,146 |
| 5-Person Families | 630 (13.6%) | $105,726 |
| 6-Person Families | 246 (5.3%) | $0 |
| 7+ Person Families | 159 (3.4%) | $0 |
| Total | 4,637 (100.0%) | $130,273 |
Family Income by Number of Earners in Redland
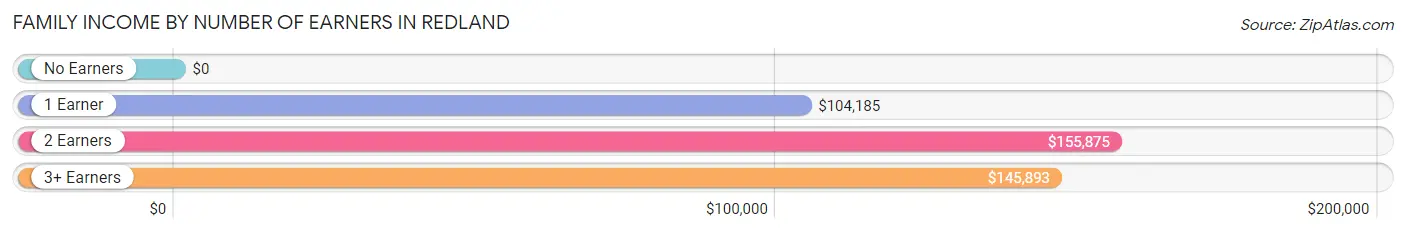
| Number of Earners | # Families | Median Income |
| No Earners | 300 (6.5%) | $0 |
| 1 Earner | 1,187 (25.6%) | $104,185 |
| 2 Earners | 2,237 (48.2%) | $155,875 |
| 3+ Earners | 913 (19.7%) | $145,893 |
| Total | 4,637 (100.0%) | $130,273 |
Household Income in Redland
Household Income Brackets in Redland
With 1,407 households falling in the category, the $200,000+ income range is the most frequent in Redland, accounting for 24.6% of all households. In contrast, only 40 households (0.7%) fall into the less than $10,000 income bracket, making it the least populous group.
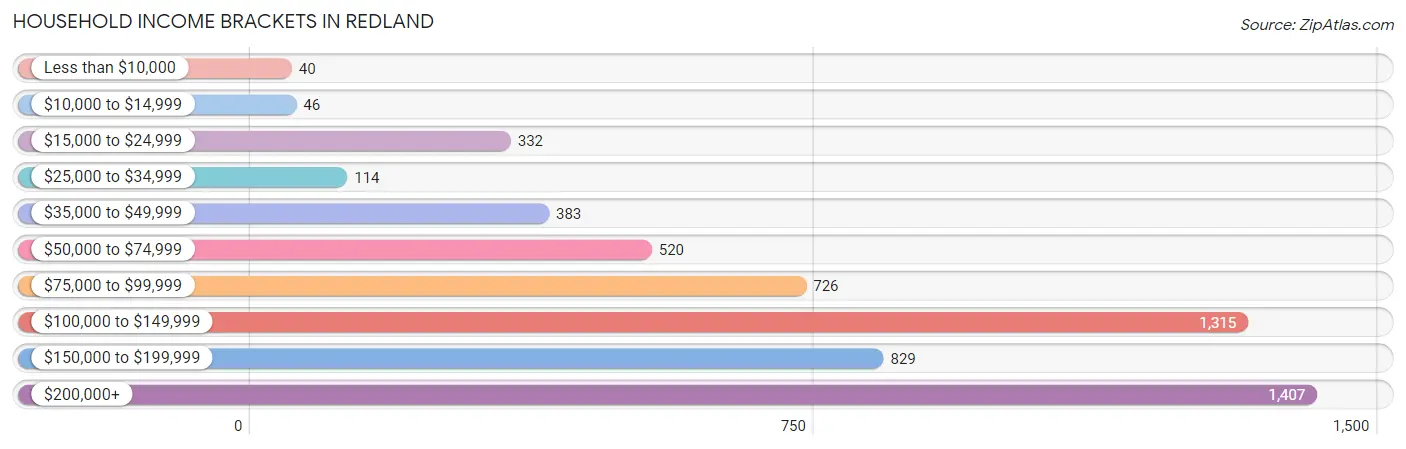
| Income Bracket | # Households | % Households |
| Less than $10,000 | 40 | 0.7% |
| $10,000 to $14,999 | 46 | 0.8% |
| $15,000 to $24,999 | 332 | 5.8% |
| $25,000 to $34,999 | 114 | 2.0% |
| $35,000 to $49,999 | 383 | 6.7% |
| $50,000 to $74,999 | 520 | 9.1% |
| $75,000 to $99,999 | 726 | 12.7% |
| $100,000 to $149,999 | 1,315 | 23.0% |
| $150,000 to $199,999 | 829 | 14.5% |
| $200,000+ | 1,407 | 24.6% |
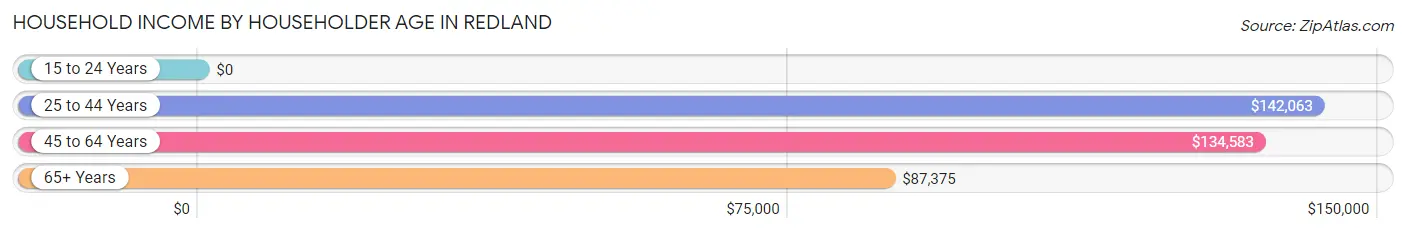
Household Income by Householder Age in Redland
The median household income in Redland is $125,480, with the highest median household income of $142,063 found in the 25 to 44 years age bracket for the primary householder. A total of 1,772 households (31.0%) fall into this category. Meanwhile, the 15 to 24 years age bracket for the primary householder has the lowest median household income of $0, with 51 households (0.9%) in this group.
| Income Bracket | # Households | Median Income |
| 15 to 24 Years | 51 (0.9%) | $0 |
| 25 to 44 Years | 1,772 (31.0%) | $142,063 |
| 45 to 64 Years | 2,434 (42.6%) | $134,583 |
| 65+ Years | 1,462 (25.6%) | $87,375 |
| Total | 5,719 (100.0%) | $125,480 |
Poverty in Redland
Income Below Poverty by Sex and Age in Redland
With 5.8% poverty level for males and 5.8% for females among the residents of Redland, under 5 year old males and 18 to 24 year old females are the most vulnerable to poverty, with 124 males (15.9%) and 108 females (17.4%) in their respective age groups living below the poverty level.
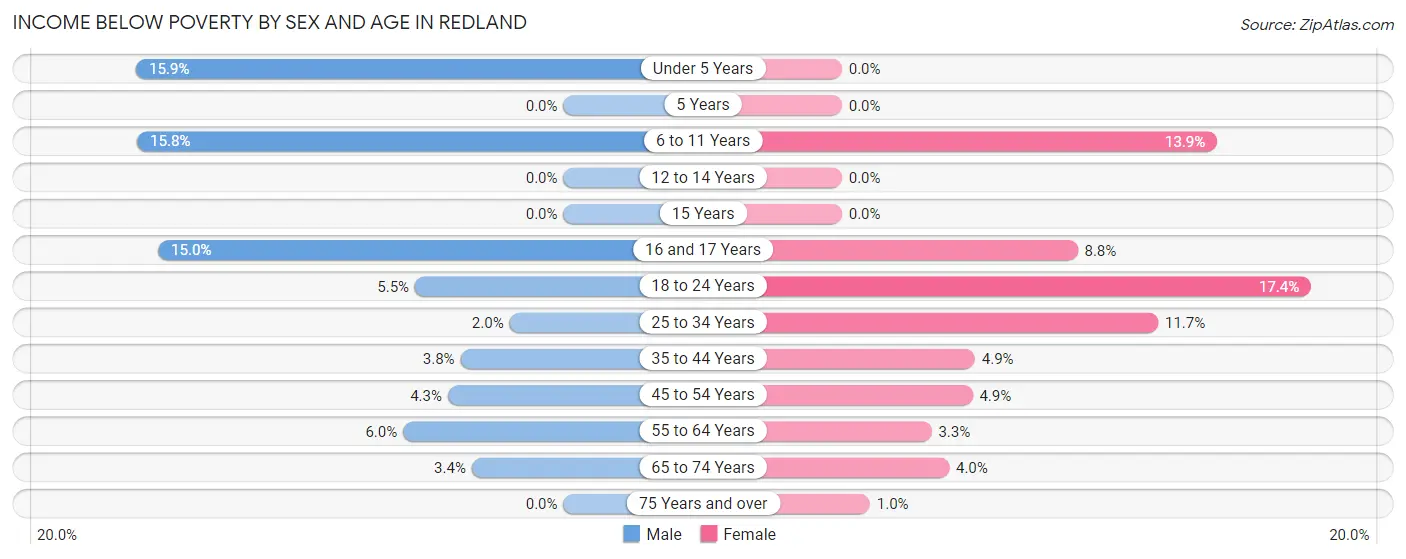
| Age Bracket | Male | Female |
| Under 5 Years | 124 (15.9%) | 0 (0.0%) |
| 5 Years | 0 (0.0%) | 0 (0.0%) |
| 6 to 11 Years | 103 (15.8%) | 68 (13.9%) |
| 12 to 14 Years | 0 (0.0%) | 0 (0.0%) |
| 15 Years | 0 (0.0%) | 0 (0.0%) |
| 16 and 17 Years | 37 (15.0%) | 23 (8.7%) |
| 18 to 24 Years | 39 (5.5%) | 108 (17.4%) |
| 25 to 34 Years | 25 (2.0%) | 114 (11.7%) |
| 35 to 44 Years | 44 (3.8%) | 75 (4.9%) |
| 45 to 54 Years | 43 (4.3%) | 60 (4.9%) |
| 55 to 64 Years | 78 (5.9%) | 45 (3.3%) |
| 65 to 74 Years | 30 (3.4%) | 39 (4.0%) |
| 75 Years and over | 0 (0.0%) | 7 (1.0%) |
| Total | 523 (5.8%) | 539 (5.8%) |
Income Above Poverty by Sex and Age in Redland
According to the poverty statistics in Redland, males aged 5 years and females aged under 5 years are the age groups that are most secure financially, with 100.0% of males and 100.0% of females in these age groups living above the poverty line.
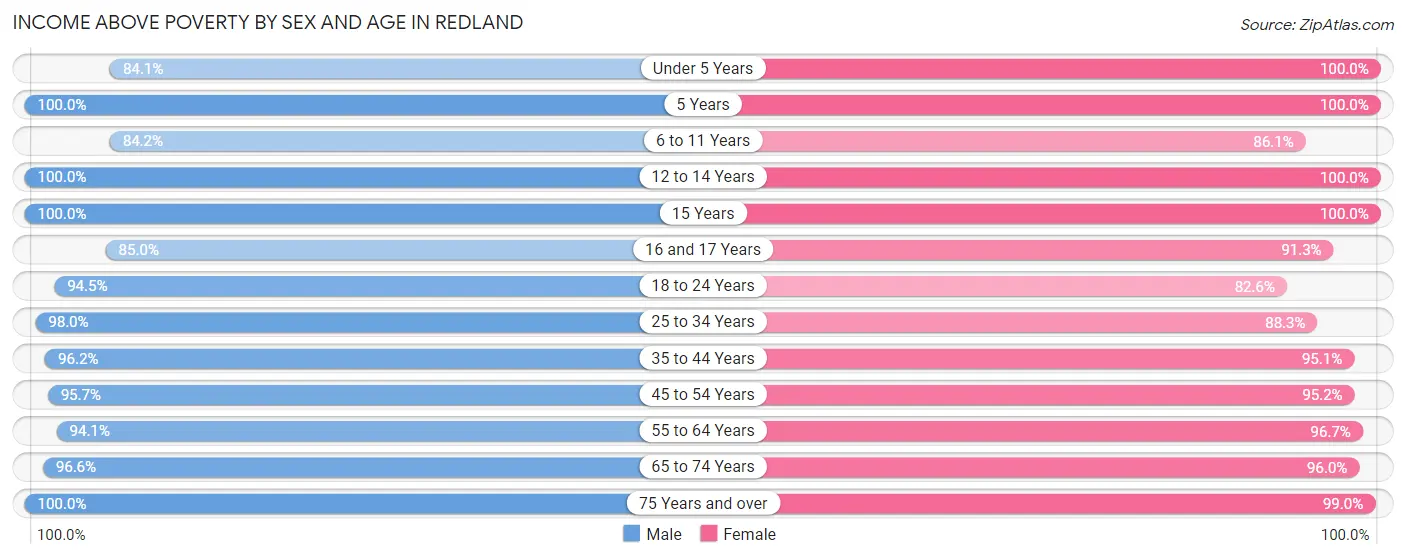
| Age Bracket | Male | Female |
| Under 5 Years | 658 (84.1%) | 425 (100.0%) |
| 5 Years | 69 (100.0%) | 60 (100.0%) |
| 6 to 11 Years | 548 (84.2%) | 420 (86.1%) |
| 12 to 14 Years | 245 (100.0%) | 494 (100.0%) |
| 15 Years | 160 (100.0%) | 208 (100.0%) |
| 16 and 17 Years | 209 (85.0%) | 240 (91.2%) |
| 18 to 24 Years | 669 (94.5%) | 512 (82.6%) |
| 25 to 34 Years | 1,222 (98.0%) | 857 (88.3%) |
| 35 to 44 Years | 1,108 (96.2%) | 1,444 (95.1%) |
| 45 to 54 Years | 959 (95.7%) | 1,178 (95.2%) |
| 55 to 64 Years | 1,234 (94.1%) | 1,307 (96.7%) |
| 65 to 74 Years | 853 (96.6%) | 941 (96.0%) |
| 75 Years and over | 501 (100.0%) | 664 (99.0%) |
| Total | 8,435 (94.2%) | 8,750 (94.2%) |
Income Below Poverty Among Married-Couple Families in Redland
The poverty statistics for married-couple families in Redland show that 1.6% or 62 of the total 3,769 families live below the poverty line. Families with no children have the highest poverty rate of 2.5%, comprising of 51 families. On the other hand, families with 3 or 4 children have the lowest poverty rate of 0.0%, which includes 0 families.
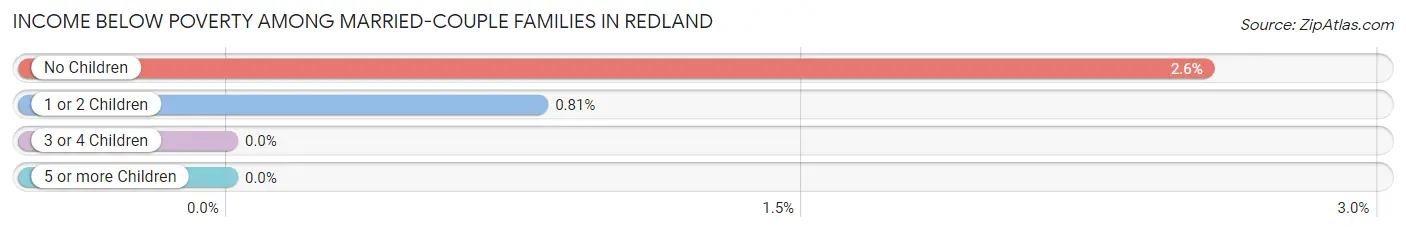
| Children | Above Poverty | Below Poverty |
| No Children | 1,947 (97.5%) | 51 (2.5%) |
| 1 or 2 Children | 1,355 (99.2%) | 11 (0.8%) |
| 3 or 4 Children | 405 (100.0%) | 0 (0.0%) |
| 5 or more Children | 0 (0.0%) | 0 (0.0%) |
| Total | 3,707 (98.4%) | 62 (1.6%) |
Income Below Poverty Among Single-Parent Households in Redland
According to the poverty data in Redland, 20.2% or 51 single-father households and 20.0% or 123 single-mother households are living below the poverty line. Among single-father households, those with 1 or 2 children have the highest poverty rate, with 31 households (22.3%) experiencing poverty. Likewise, among single-mother households, those with 3 or 4 children have the highest poverty rate, with 62 households (95.4%) falling below the poverty line.
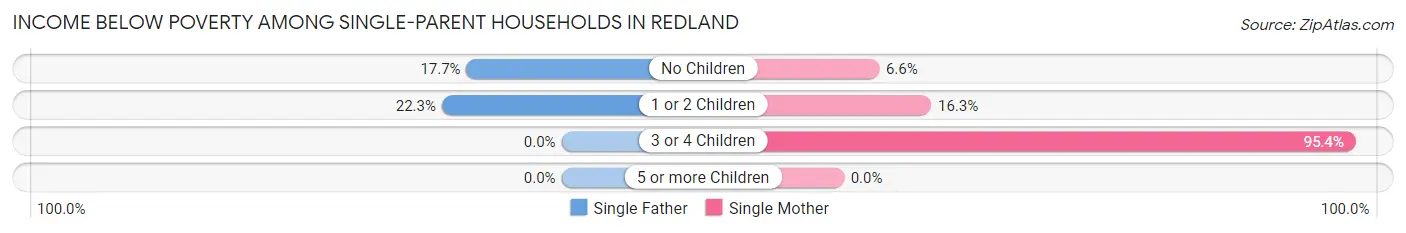
| Children | Single Father | Single Mother |
| No Children | 20 (17.7%) | 19 (6.6%) |
| 1 or 2 Children | 31 (22.3%) | 42 (16.3%) |
| 3 or 4 Children | 0 (0.0%) | 62 (95.4%) |
| 5 or more Children | 0 (0.0%) | 0 (0.0%) |
| Total | 51 (20.2%) | 123 (20.0%) |
Income Below Poverty Among Married-Couple vs Single-Parent Households in Redland
The poverty data for Redland shows that 62 of the married-couple family households (1.6%) and 174 of the single-parent households (20.1%) are living below the poverty level. Within the married-couple family households, those with no children have the highest poverty rate, with 51 households (2.5%) falling below the poverty line. Among the single-parent households, those with 3 or 4 children have the highest poverty rate, with 62 household (95.4%) living below poverty.
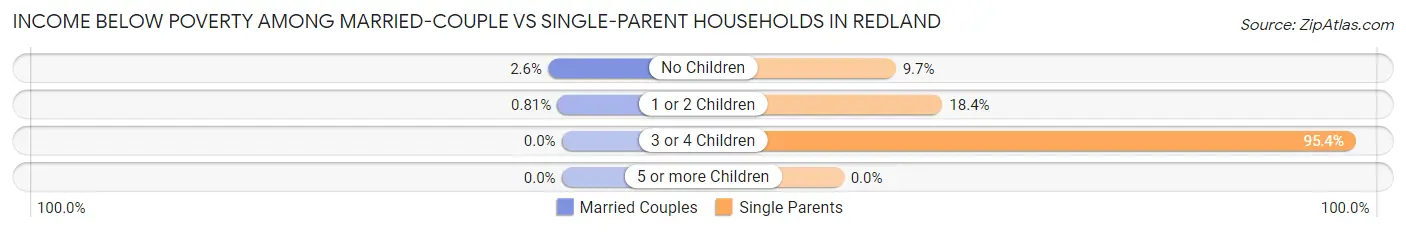
| Children | Married-Couple Families | Single-Parent Households |
| No Children | 51 (2.5%) | 39 (9.7%) |
| 1 or 2 Children | 11 (0.8%) | 73 (18.4%) |
| 3 or 4 Children | 0 (0.0%) | 62 (95.4%) |
| 5 or more Children | 0 (0.0%) | 0 (0.0%) |
| Total | 62 (1.6%) | 174 (20.1%) |
Race in Redland
The most populous races in Redland are White / Caucasian (7,487 | 40.8%), Hispanic or Latino (6,614 | 36.0%), and Some other Race (3,930 | 21.4%).
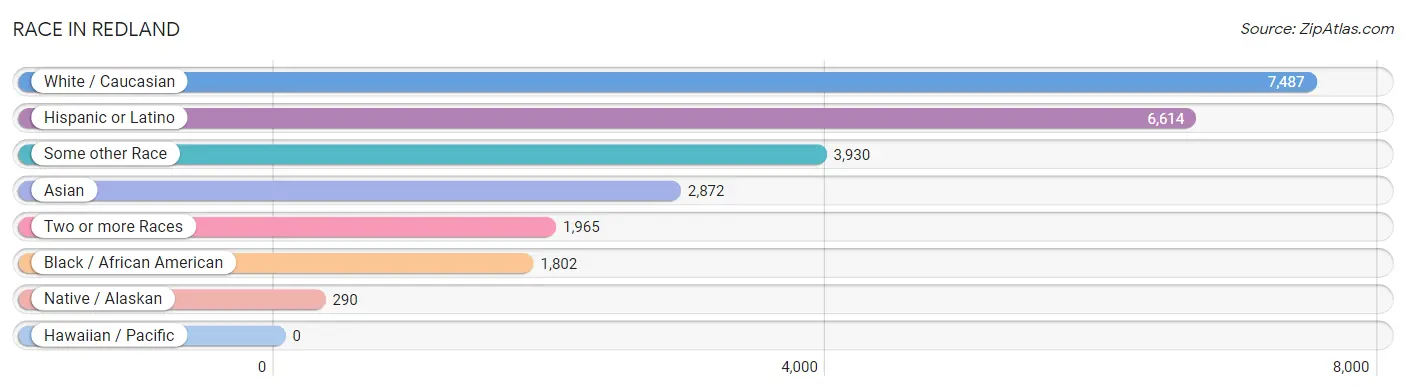
| Race | # Population | % Population |
| Asian | 2,872 | 15.7% |
| Black / African American | 1,802 | 9.8% |
| Hawaiian / Pacific | 0 | 0.0% |
| Hispanic or Latino | 6,614 | 36.0% |
| Native / Alaskan | 290 | 1.6% |
| White / Caucasian | 7,487 | 40.8% |
| Two or more Races | 1,965 | 10.7% |
| Some other Race | 3,930 | 21.4% |
| Total | 18,346 | 100.0% |
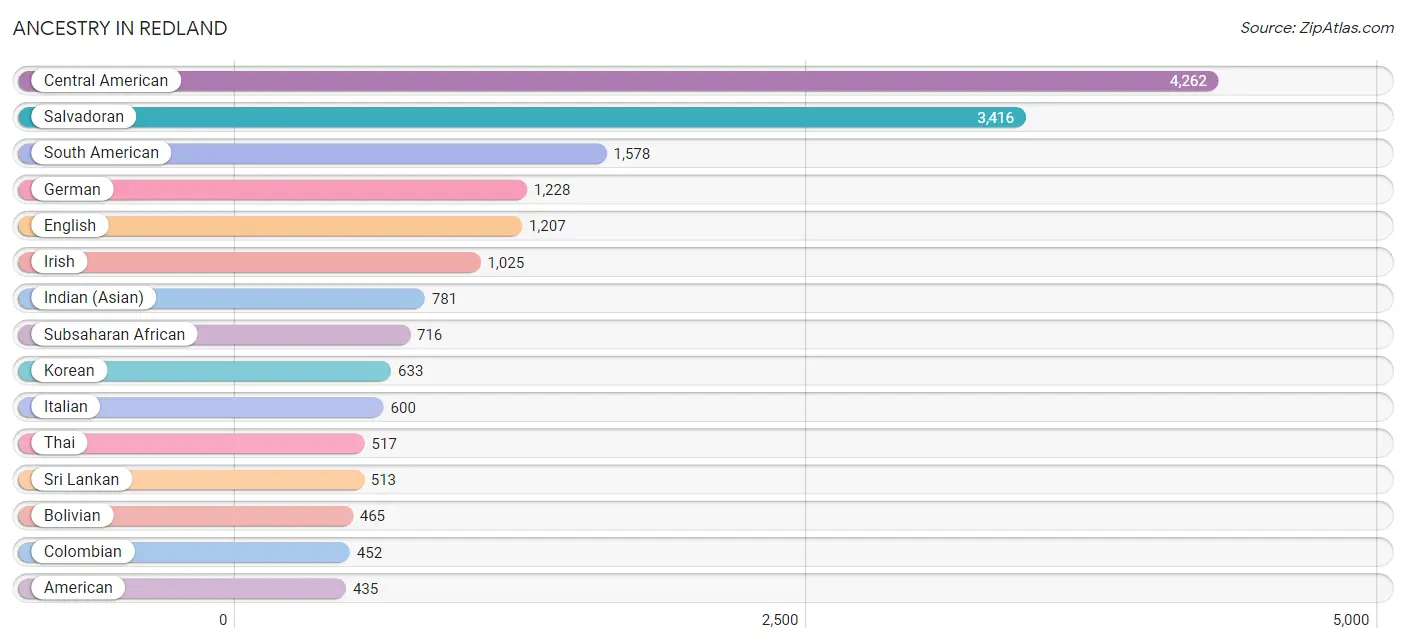
Ancestry in Redland
The most populous ancestries reported in Redland are Central American (4,262 | 23.2%), Salvadoran (3,416 | 18.6%), South American (1,578 | 8.6%), German (1,228 | 6.7%), and English (1,207 | 6.6%), together accounting for 63.7% of all Redland residents.
| Ancestry | # Population | % Population |
| African | 275 | 1.5% |
| Albanian | 6 | 0.0% |
| American | 435 | 2.4% |
| Arab | 389 | 2.1% |
| Argentinean | 43 | 0.2% |
| Armenian | 20 | 0.1% |
| Australian | 20 | 0.1% |
| Austrian | 13 | 0.1% |
| Barbadian | 21 | 0.1% |
| Basque | 22 | 0.1% |
| Belgian | 10 | 0.1% |
| Bhutanese | 73 | 0.4% |
| Bolivian | 465 | 2.5% |
| British | 87 | 0.5% |
| British West Indian | 15 | 0.1% |
| Bulgarian | 4 | 0.0% |
| Burmese | 247 | 1.3% |
| Canadian | 26 | 0.1% |
| Celtic | 5 | 0.0% |
| Central American | 4,262 | 23.2% |
| Central American Indian | 120 | 0.6% |
| Cherokee | 11 | 0.1% |
| Chilean | 78 | 0.4% |
| Colombian | 452 | 2.5% |
| Costa Rican | 60 | 0.3% |
| Croatian | 37 | 0.2% |
| Czech | 50 | 0.3% |
| Czechoslovakian | 16 | 0.1% |
| Danish | 25 | 0.1% |
| Dominican | 359 | 2.0% |
| Dutch | 253 | 1.4% |
| Eastern European | 94 | 0.5% |
| Ecuadorian | 148 | 0.8% |
| Egyptian | 38 | 0.2% |
| English | 1,207 | 6.6% |
| Ethiopian | 109 | 0.6% |
| European | 349 | 1.9% |
| Filipino | 63 | 0.3% |
| French | 152 | 0.8% |
| French Canadian | 34 | 0.2% |
| German | 1,228 | 6.7% |
| Ghanaian | 16 | 0.1% |
| Greek | 91 | 0.5% |
| Guatemalan | 407 | 2.2% |
| Guyanese | 13 | 0.1% |
| Honduran | 179 | 1.0% |
| Hungarian | 81 | 0.4% |
| Indian (Asian) | 781 | 4.3% |
| Indonesian | 28 | 0.2% |
| Iranian | 224 | 1.2% |
| Irish | 1,025 | 5.6% |
| Italian | 600 | 3.3% |
| Jamaican | 133 | 0.7% |
| Japanese | 10 | 0.1% |
| Jordanian | 9 | 0.1% |
| Kenyan | 230 | 1.3% |
| Korean | 633 | 3.5% |
| Laotian | 57 | 0.3% |
| Liberian | 1 | 0.0% |
| Lithuanian | 5 | 0.0% |
| Lumbee | 27 | 0.2% |
| Mexican | 108 | 0.6% |
| Mongolian | 18 | 0.1% |
| Native Hawaiian | 10 | 0.1% |
| Nicaraguan | 196 | 1.1% |
| Nigerian | 67 | 0.4% |
| Norwegian | 93 | 0.5% |
| Pakistani | 179 | 1.0% |
| Palestinian | 30 | 0.2% |
| Panamanian | 4 | 0.0% |
| Paraguayan | 45 | 0.3% |
| Pennsylvania German | 17 | 0.1% |
| Peruvian | 347 | 1.9% |
| Polish | 360 | 2.0% |
| Puerto Rican | 162 | 0.9% |
| Romanian | 104 | 0.6% |
| Russian | 224 | 1.2% |
| Salvadoran | 3,416 | 18.6% |
| Scandinavian | 33 | 0.2% |
| Scotch-Irish | 102 | 0.6% |
| Scottish | 201 | 1.1% |
| Slovak | 26 | 0.1% |
| Slovene | 7 | 0.0% |
| South American | 1,578 | 8.6% |
| South American Indian | 265 | 1.4% |
| Spaniard | 13 | 0.1% |
| Sri Lankan | 513 | 2.8% |
| Subsaharan African | 716 | 3.9% |
| Swedish | 153 | 0.8% |
| Swiss | 19 | 0.1% |
| Thai | 517 | 2.8% |
| Trinidadian and Tobagonian | 67 | 0.4% |
| Turkish | 16 | 0.1% |
| Ugandan | 1 | 0.0% |
| Ukrainian | 122 | 0.7% |
| Welsh | 89 | 0.5% |
| Yup'ik | 14 | 0.1% | View All 97 Rows |
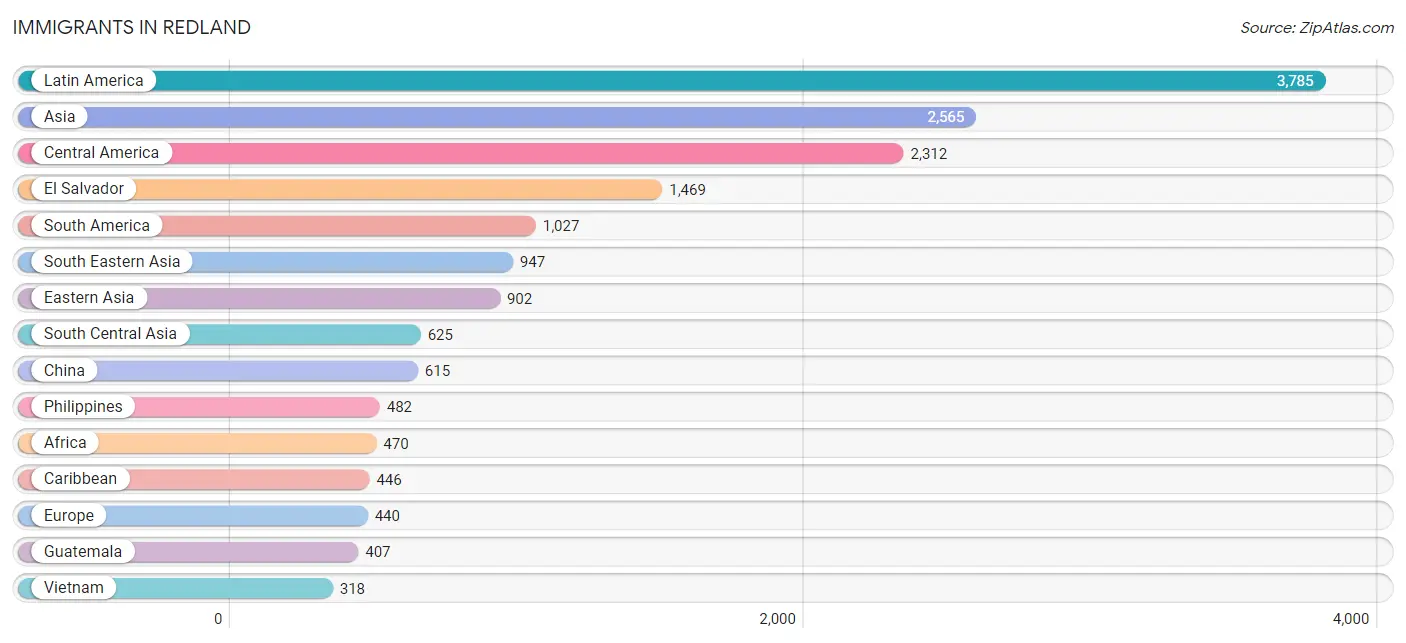
Immigrants in Redland
The most numerous immigrant groups reported in Redland came from Latin America (3,785 | 20.6%), Asia (2,565 | 14.0%), Central America (2,312 | 12.6%), El Salvador (1,469 | 8.0%), and South America (1,027 | 5.6%), together accounting for 60.8% of all Redland residents.
| Immigration Origin | # Population | % Population |
| Africa | 470 | 2.6% |
| Argentina | 17 | 0.1% |
| Asia | 2,565 | 14.0% |
| Barbados | 21 | 0.1% |
| Belarus | 73 | 0.4% |
| Bolivia | 271 | 1.5% |
| Brazil | 35 | 0.2% |
| Cameroon | 63 | 0.3% |
| Canada | 25 | 0.1% |
| Caribbean | 446 | 2.4% |
| Central America | 2,312 | 12.6% |
| Chile | 31 | 0.2% |
| China | 615 | 3.4% |
| Colombia | 317 | 1.7% |
| Costa Rica | 76 | 0.4% |
| Dominican Republic | 245 | 1.3% |
| Eastern Africa | 208 | 1.1% |
| Eastern Asia | 902 | 4.9% |
| Eastern Europe | 298 | 1.6% |
| Ecuador | 71 | 0.4% |
| Egypt | 19 | 0.1% |
| El Salvador | 1,469 | 8.0% |
| England | 6 | 0.0% |
| Ethiopia | 5 | 0.0% |
| Europe | 440 | 2.4% |
| Germany | 15 | 0.1% |
| Ghana | 16 | 0.1% |
| Greece | 60 | 0.3% |
| Grenada | 15 | 0.1% |
| Guatemala | 407 | 2.2% |
| Guyana | 10 | 0.1% |
| Honduras | 134 | 0.7% |
| Hong Kong | 61 | 0.3% |
| India | 248 | 1.3% |
| Indonesia | 77 | 0.4% |
| Iran | 60 | 0.3% |
| Ireland | 9 | 0.1% |
| Israel | 25 | 0.1% |
| Italy | 15 | 0.1% |
| Jamaica | 71 | 0.4% |
| Japan | 23 | 0.1% |
| Jordan | 9 | 0.1% |
| Kenya | 183 | 1.0% |
| Korea | 264 | 1.4% |
| Kuwait | 11 | 0.1% |
| Latin America | 3,785 | 20.6% |
| Liberia | 82 | 0.4% |
| Lithuania | 7 | 0.0% |
| Mexico | 91 | 0.5% |
| Middle Africa | 98 | 0.5% |
| Moldova | 61 | 0.3% |
| Nepal | 201 | 1.1% |
| Netherlands | 9 | 0.1% |
| Nicaragua | 135 | 0.7% |
| Nigeria | 18 | 0.1% |
| Northern Africa | 19 | 0.1% |
| Northern Europe | 36 | 0.2% |
| Oceania | 14 | 0.1% |
| Pakistan | 21 | 0.1% |
| Peru | 275 | 1.5% |
| Philippines | 482 | 2.6% |
| Poland | 15 | 0.1% |
| Russia | 39 | 0.2% |
| Saudi Arabia | 11 | 0.1% |
| South America | 1,027 | 5.6% |
| South Central Asia | 625 | 3.4% |
| South Eastern Asia | 947 | 5.2% |
| Southern Europe | 76 | 0.4% |
| Spain | 1 | 0.0% |
| Sri Lanka | 95 | 0.5% |
| Switzerland | 6 | 0.0% |
| Syria | 26 | 0.1% |
| Taiwan | 59 | 0.3% |
| Thailand | 42 | 0.2% |
| Trinidad and Tobago | 89 | 0.5% |
| Uganda | 1 | 0.0% |
| Ukraine | 103 | 0.6% |
| Vietnam | 318 | 1.7% |
| West Indies | 5 | 0.0% |
| Western Africa | 116 | 0.6% |
| Western Asia | 91 | 0.5% |
| Western Europe | 30 | 0.2% |
| Zaire | 35 | 0.2% | View All 83 Rows |
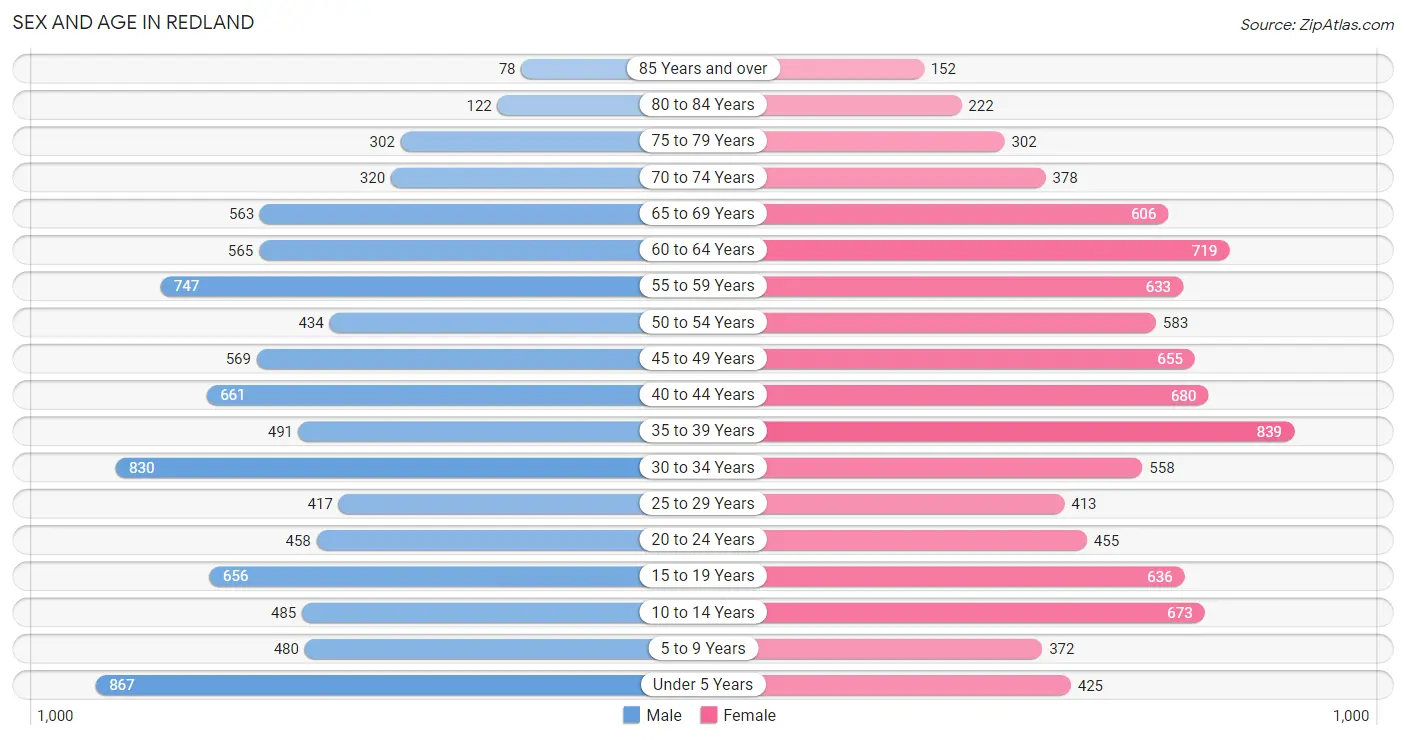
Sex and Age in Redland
Sex and Age in Redland
The most populous age groups in Redland are Under 5 Years (867 | 9.6%) for men and 35 to 39 Years (839 | 9.0%) for women.
| Age Bracket | Male | Female |
| Under 5 Years | 867 (9.6%) | 425 (4.6%) |
| 5 to 9 Years | 480 (5.3%) | 372 (4.0%) |
| 10 to 14 Years | 485 (5.4%) | 673 (7.2%) |
| 15 to 19 Years | 656 (7.2%) | 636 (6.8%) |
| 20 to 24 Years | 458 (5.1%) | 455 (4.9%) |
| 25 to 29 Years | 417 (4.6%) | 413 (4.4%) |
| 30 to 34 Years | 830 (9.2%) | 558 (6.0%) |
| 35 to 39 Years | 491 (5.4%) | 839 (9.0%) |
| 40 to 44 Years | 661 (7.3%) | 680 (7.3%) |
| 45 to 49 Years | 569 (6.3%) | 655 (7.0%) |
| 50 to 54 Years | 434 (4.8%) | 583 (6.3%) |
| 55 to 59 Years | 747 (8.3%) | 633 (6.8%) |
| 60 to 64 Years | 565 (6.2%) | 719 (7.7%) |
| 65 to 69 Years | 563 (6.2%) | 606 (6.5%) |
| 70 to 74 Years | 320 (3.5%) | 378 (4.1%) |
| 75 to 79 Years | 302 (3.3%) | 302 (3.3%) |
| 80 to 84 Years | 122 (1.3%) | 222 (2.4%) |
| 85 Years and over | 78 (0.9%) | 152 (1.6%) |
| Total | 9,045 (100.0%) | 9,301 (100.0%) |
Families and Households in Redland
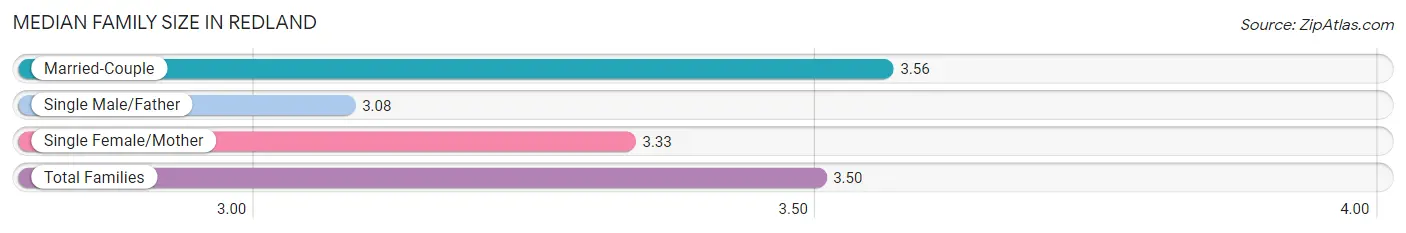
Median Family Size in Redland
The median family size in Redland is 3.50 persons per family, with married-couple families (3,769 | 81.3%) accounting for the largest median family size of 3.56 persons per family. On the other hand, single male/father families (252 | 5.4%) represent the smallest median family size with 3.08 persons per family.
| Family Type | # Families | Family Size |
| Married-Couple | 3,769 (81.3%) | 3.56 |
| Single Male/Father | 252 (5.4%) | 3.08 |
| Single Female/Mother | 616 (13.3%) | 3.33 |
| Total Families | 4,637 (100.0%) | 3.50 |
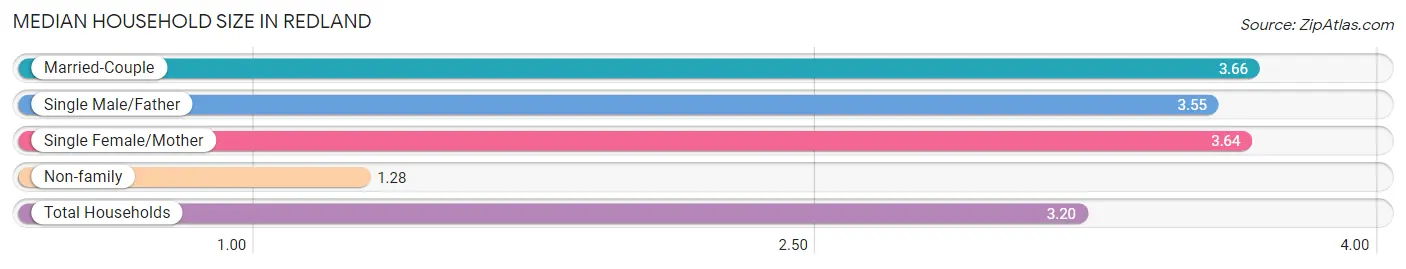
Median Household Size in Redland
The median household size in Redland is 3.20 persons per household, with married-couple households (3,769 | 65.9%) accounting for the largest median household size of 3.66 persons per household. non-family households (1,082 | 18.9%) represent the smallest median household size with 1.28 persons per household.
| Household Type | # Households | Household Size |
| Married-Couple | 3,769 (65.9%) | 3.66 |
| Single Male/Father | 252 (4.4%) | 3.55 |
| Single Female/Mother | 616 (10.8%) | 3.64 |
| Non-family | 1,082 (18.9%) | 1.28 |
| Total Households | 5,719 (100.0%) | 3.20 |
Household Size by Marriage Status in Redland
Out of a total of 5,719 households in Redland, 4,637 (81.1%) are family households, while 1,082 (18.9%) are nonfamily households. The most numerous type of family households are 2-person households, comprising 1,575, and the most common type of nonfamily households are 1-person households, comprising 865.
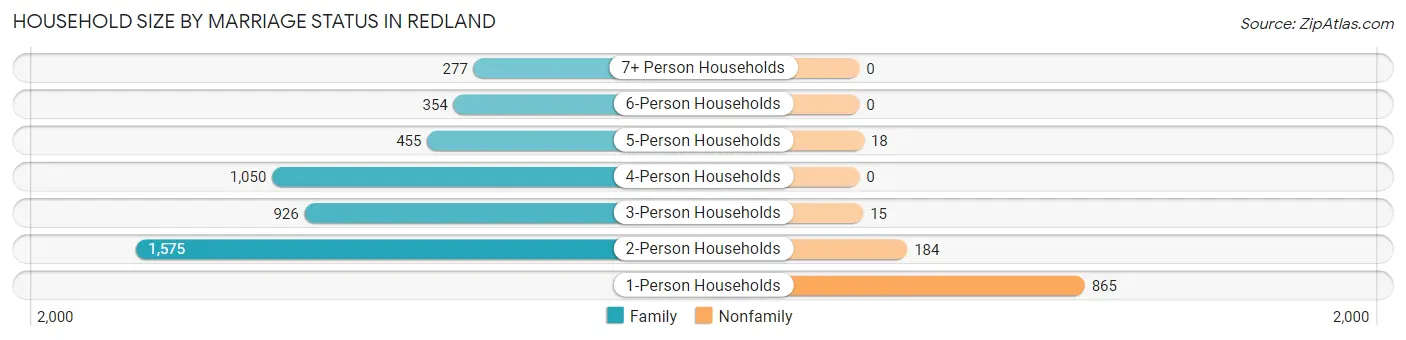
| Household Size | Family Households | Nonfamily Households |
| 1-Person Households | - | 865 (15.1%) |
| 2-Person Households | 1,575 (27.5%) | 184 (3.2%) |
| 3-Person Households | 926 (16.2%) | 15 (0.3%) |
| 4-Person Households | 1,050 (18.4%) | 0 (0.0%) |
| 5-Person Households | 455 (8.0%) | 18 (0.3%) |
| 6-Person Households | 354 (6.2%) | 0 (0.0%) |
| 7+ Person Households | 277 (4.8%) | 0 (0.0%) |
| Total | 4,637 (81.1%) | 1,082 (18.9%) |
Female Fertility in Redland
Fertility by Age in Redland
Average fertility rate in Redland is 99.0 births per 1,000 women. Women in the age bracket of 20 to 34 years have the highest fertility rate with 139.0 births per 1,000 women. Women in the age bracket of 35 to 50 years acount for 54.7% of all women with births.
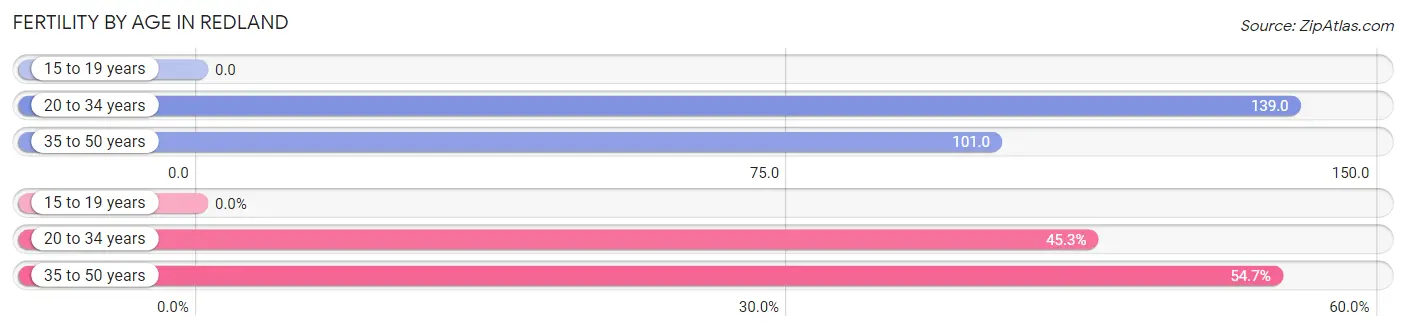
| Age Bracket | Women with Births | Births / 1,000 Women |
| 15 to 19 years | 0 (0.0%) | 0.0 |
| 20 to 34 years | 198 (45.3%) | 139.0 |
| 35 to 50 years | 239 (54.7%) | 101.0 |
| Total | 437 (100.0%) | 99.0 |
Fertility by Age by Marriage Status in Redland
73.2% of women with births (437) in Redland are married. The highest percentage of unmarried women with births falls into 20 to 34 years age bracket with 47.0% of them unmarried at the time of birth, while the lowest percentage of unmarried women with births belong to 35 to 50 years age bracket with 10.0% of them unmarried.
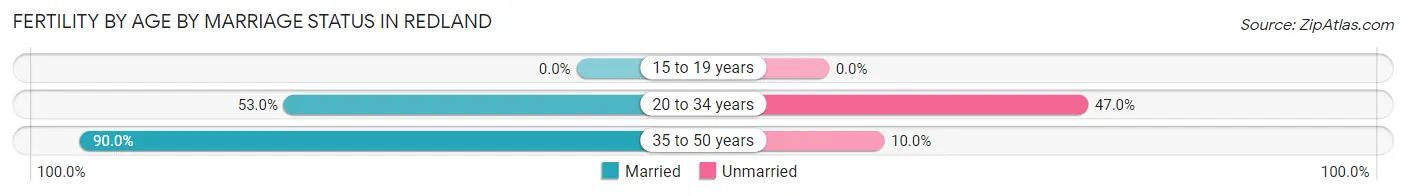
| Age Bracket | Married | Unmarried |
| 15 to 19 years | 0 (0.0%) | 0 (0.0%) |
| 20 to 34 years | 105 (53.0%) | 93 (47.0%) |
| 35 to 50 years | 215 (90.0%) | 24 (10.0%) |
| Total | 320 (73.2%) | 117 (26.8%) |
Fertility by Education in Redland
Average fertility rate in Redland is 99.0 births per 1,000 women. Women with the education attainment of college or associate's degree have the highest fertility rate of 170.0 births per 1,000 women, while women with the education attainment of graduate degree have the lowest fertility at 56.0 births per 1,000 women. Women with the education attainment of college or associate's degree represent 30.4% of all women with births.
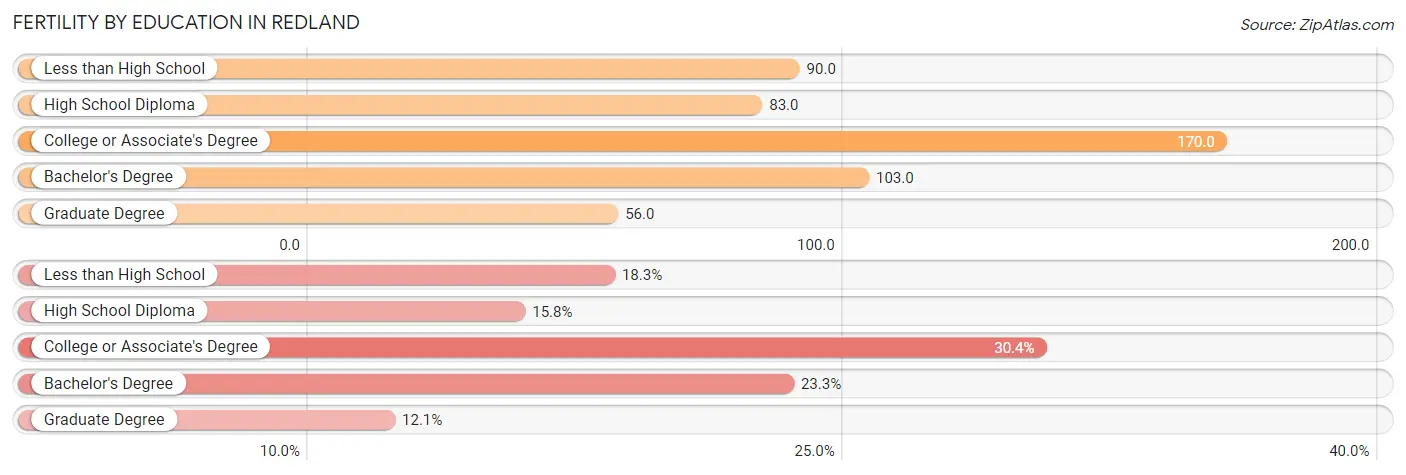
| Educational Attainment | Women with Births | Births / 1,000 Women |
| Less than High School | 80 (18.3%) | 90.0 |
| High School Diploma | 69 (15.8%) | 83.0 |
| College or Associate's Degree | 133 (30.4%) | 170.0 |
| Bachelor's Degree | 102 (23.3%) | 103.0 |
| Graduate Degree | 53 (12.1%) | 56.0 |
| Total | 437 (100.0%) | 99.0 |
Fertility by Education by Marriage Status in Redland
26.8% of women with births in Redland are unmarried. Women with the educational attainment of graduate degree are most likely to be married with 100.0% of them married at childbirth, while women with the educational attainment of less than high school are least likely to be married with 85.0% of them unmarried at childbirth.
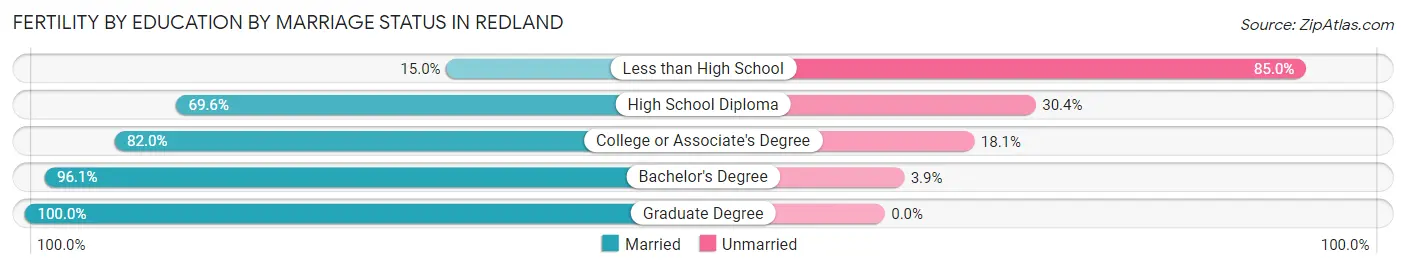
| Educational Attainment | Married | Unmarried |
| Less than High School | 12 (15.0%) | 68 (85.0%) |
| High School Diploma | 48 (69.6%) | 21 (30.4%) |
| College or Associate's Degree | 109 (82.0%) | 24 (18.0%) |
| Bachelor's Degree | 98 (96.1%) | 4 (3.9%) |
| Graduate Degree | 53 (100.0%) | 0 (0.0%) |
| Total | 320 (73.2%) | 117 (26.8%) |
Employment Characteristics in Redland
Employment by Class of Employer in Redland
Among the 9,471 employed individuals in Redland, private company employees (6,171 | 65.2%), federal government employees (856 | 9.0%), and not-for-profit organizations (758 | 8.0%) make up the most common classes of employment.
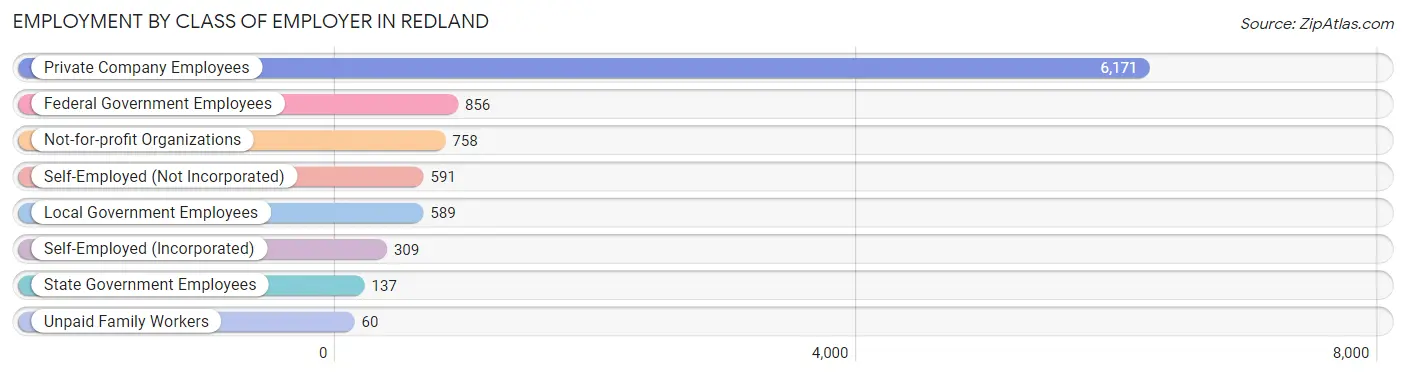
| Employer Class | # Employees | % Employees |
| Private Company Employees | 6,171 | 65.2% |
| Self-Employed (Incorporated) | 309 | 3.3% |
| Self-Employed (Not Incorporated) | 591 | 6.2% |
| Not-for-profit Organizations | 758 | 8.0% |
| Local Government Employees | 589 | 6.2% |
| State Government Employees | 137 | 1.5% |
| Federal Government Employees | 856 | 9.0% |
| Unpaid Family Workers | 60 | 0.6% |
| Total | 9,471 | 100.0% |
Employment Status by Age in Redland
According to the labor force statistics for Redland, out of the total population over 16 years of age (14,676), 69.0% or 10,126 individuals are in the labor force, with 4.0% or 405 of them unemployed. The age group with the highest labor force participation rate is 55 to 59 years, with 91.6% or 1,264 individuals in the labor force. Within the labor force, the 20 to 24 years age range has the highest percentage of unemployed individuals, with 12.4% or 85 of them being unemployed.
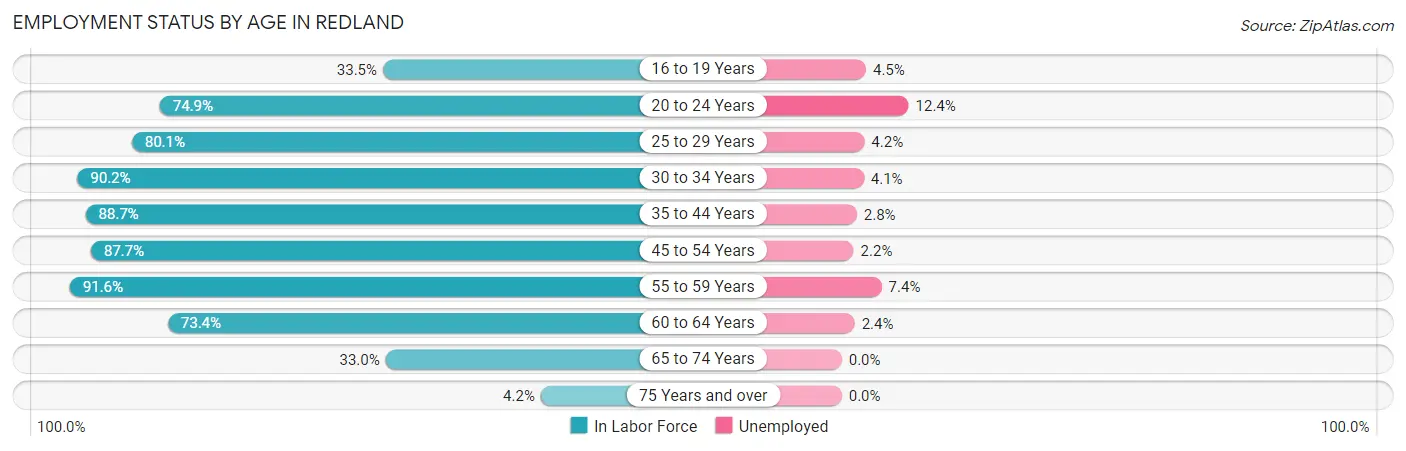
| Age Bracket | In Labor Force | Unemployed |
| 16 to 19 Years | 310 (33.5%) | 14 (4.5%) |
| 20 to 24 Years | 684 (74.9%) | 85 (12.4%) |
| 25 to 29 Years | 665 (80.1%) | 28 (4.2%) |
| 30 to 34 Years | 1,252 (90.2%) | 51 (4.1%) |
| 35 to 44 Years | 2,369 (88.7%) | 66 (2.8%) |
| 45 to 54 Years | 1,965 (87.7%) | 43 (2.2%) |
| 55 to 59 Years | 1,264 (91.6%) | 94 (7.4%) |
| 60 to 64 Years | 942 (73.4%) | 23 (2.4%) |
| 65 to 74 Years | 616 (33.0%) | 0 (0.0%) |
| 75 Years and over | 49 (4.2%) | 0 (0.0%) |
| Total | 10,126 (69.0%) | 405 (4.0%) |
Employment Status by Educational Attainment in Redland
According to labor force statistics for Redland, 86.4% of individuals (8,462) out of the total population between 25 and 64 years of age (9,794) are in the labor force, with 3.6% or 305 of them being unemployed. The group with the highest labor force participation rate are those with the educational attainment of college / associate degree, with 91.4% or 1,748 individuals in the labor force. Within the labor force, individuals with less than high school education have the highest percentage of unemployment, with 8.9% or 92 of them being unemployed.
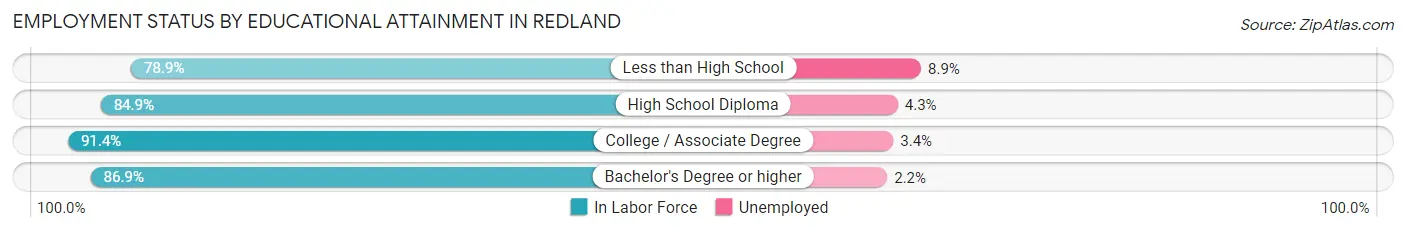
| Educational Attainment | In Labor Force | Unemployed |
| Less than High School | 1,038 (78.9%) | 117 (8.9%) |
| High School Diploma | 1,391 (84.9%) | 70 (4.3%) |
| College / Associate Degree | 1,748 (91.4%) | 65 (3.4%) |
| Bachelor's Degree or higher | 4,283 (86.9%) | 108 (2.2%) |
| Total | 8,462 (86.4%) | 353 (3.6%) |
Employment Occupations by Sex in Redland
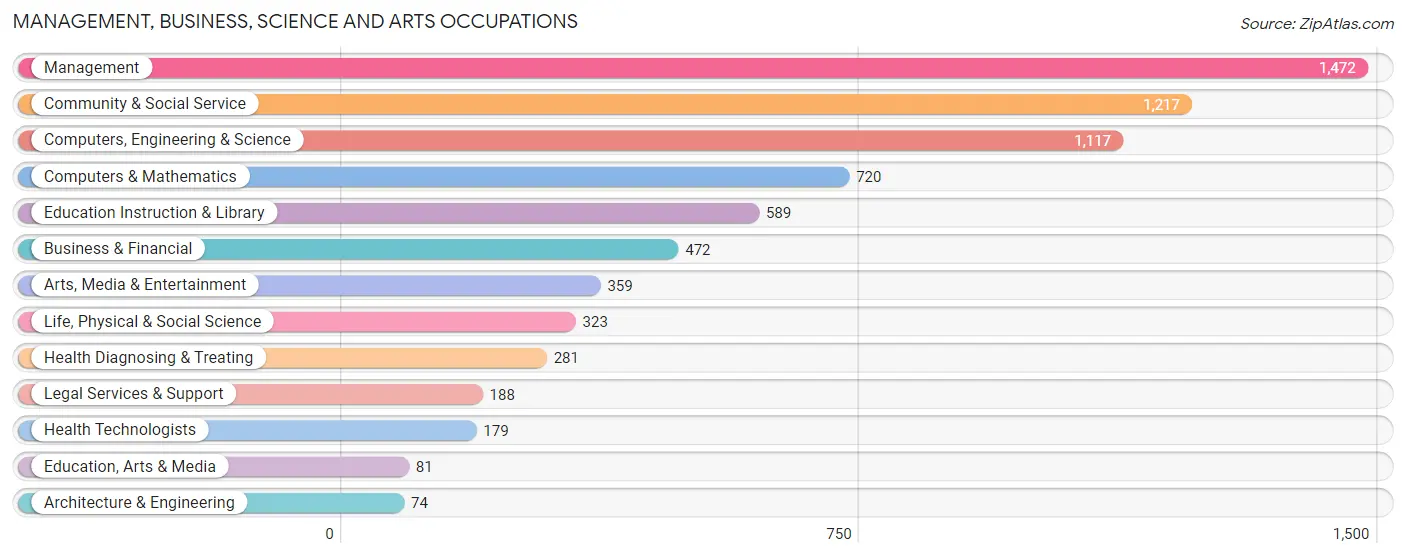
Management, Business, Science and Arts Occupations
The most common Management, Business, Science and Arts occupations in Redland are Management (1,472 | 15.2%), Community & Social Service (1,217 | 12.6%), Computers, Engineering & Science (1,117 | 11.5%), Computers & Mathematics (720 | 7.4%), and Education Instruction & Library (589 | 6.1%).
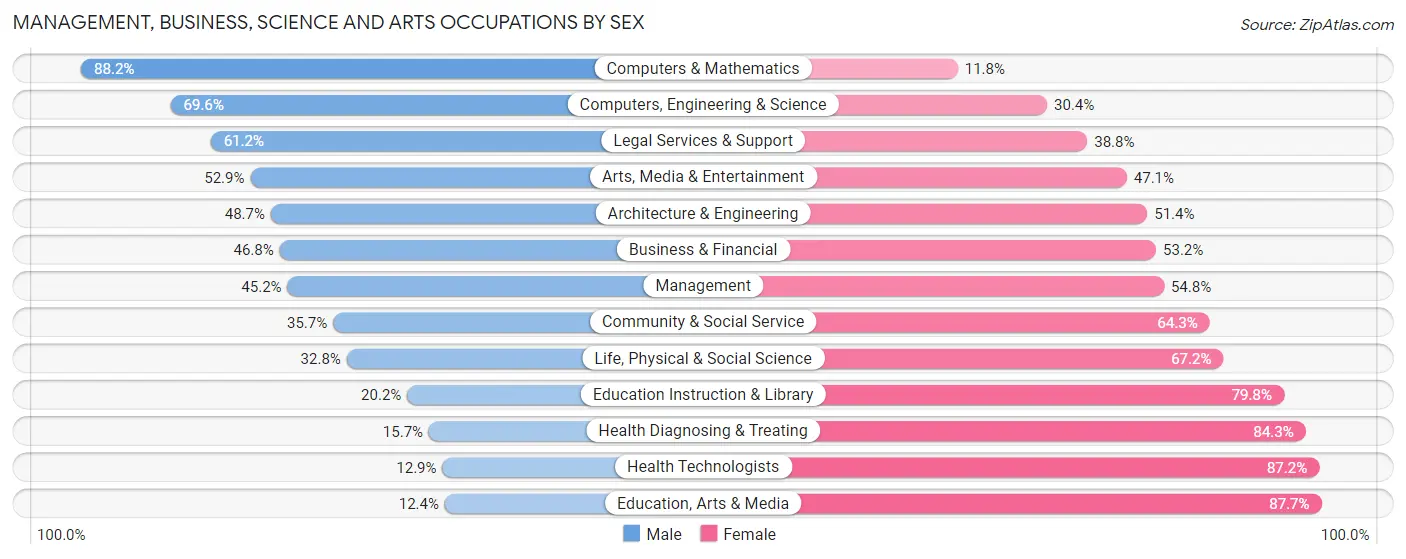
Management, Business, Science and Arts Occupations by Sex
Within the Management, Business, Science and Arts occupations in Redland, the most male-oriented occupations are Computers & Mathematics (88.2%), Computers, Engineering & Science (69.6%), and Legal Services & Support (61.2%), while the most female-oriented occupations are Education, Arts & Media (87.6%), Health Technologists (87.2%), and Health Diagnosing & Treating (84.3%).
| Occupation | Male | Female |
| Management | 665 (45.2%) | 807 (54.8%) |
| Business & Financial | 221 (46.8%) | 251 (53.2%) |
| Computers, Engineering & Science | 777 (69.6%) | 340 (30.4%) |
| Computers & Mathematics | 635 (88.2%) | 85 (11.8%) |
| Architecture & Engineering | 36 (48.6%) | 38 (51.3%) |
| Life, Physical & Social Science | 106 (32.8%) | 217 (67.2%) |
| Community & Social Service | 434 (35.7%) | 783 (64.3%) |
| Education, Arts & Media | 10 (12.3%) | 71 (87.6%) |
| Legal Services & Support | 115 (61.2%) | 73 (38.8%) |
| Education Instruction & Library | 119 (20.2%) | 470 (79.8%) |
| Arts, Media & Entertainment | 190 (52.9%) | 169 (47.1%) |
| Health Diagnosing & Treating | 44 (15.7%) | 237 (84.3%) |
| Health Technologists | 23 (12.9%) | 156 (87.2%) |
| Total (Category) | 2,141 (47.0%) | 2,418 (53.0%) |
| Total (Overall) | 4,942 (51.0%) | 4,740 (49.0%) |
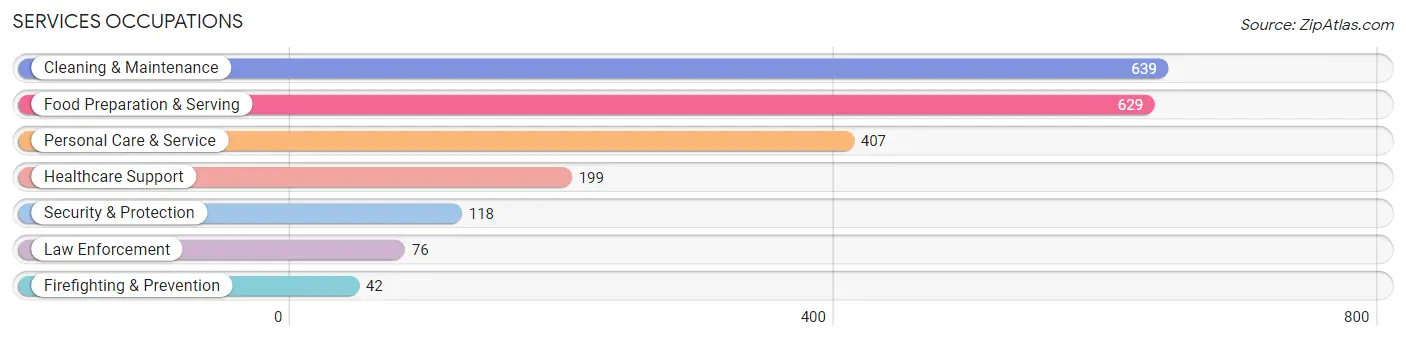
Services Occupations
The most common Services occupations in Redland are Cleaning & Maintenance (639 | 6.6%), Food Preparation & Serving (629 | 6.5%), Personal Care & Service (407 | 4.2%), Healthcare Support (199 | 2.1%), and Security & Protection (118 | 1.2%).
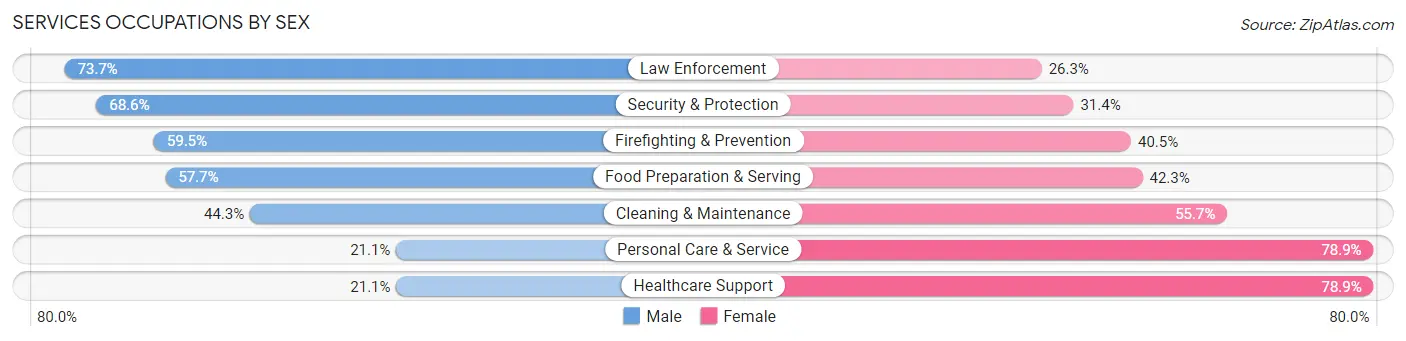
Services Occupations by Sex
Within the Services occupations in Redland, the most male-oriented occupations are Law Enforcement (73.7%), Security & Protection (68.6%), and Firefighting & Prevention (59.5%), while the most female-oriented occupations are Healthcare Support (78.9%), Personal Care & Service (78.9%), and Cleaning & Maintenance (55.7%).
| Occupation | Male | Female |
| Healthcare Support | 42 (21.1%) | 157 (78.9%) |
| Security & Protection | 81 (68.6%) | 37 (31.4%) |
| Firefighting & Prevention | 25 (59.5%) | 17 (40.5%) |
| Law Enforcement | 56 (73.7%) | 20 (26.3%) |
| Food Preparation & Serving | 363 (57.7%) | 266 (42.3%) |
| Cleaning & Maintenance | 283 (44.3%) | 356 (55.7%) |
| Personal Care & Service | 86 (21.1%) | 321 (78.9%) |
| Total (Category) | 855 (42.9%) | 1,137 (57.1%) |
| Total (Overall) | 4,942 (51.0%) | 4,740 (49.0%) |
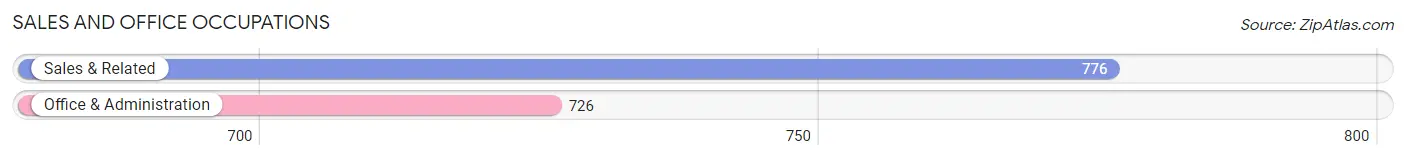
Sales and Office Occupations
The most common Sales and Office occupations in Redland are Sales & Related (776 | 8.0%), and Office & Administration (726 | 7.5%).
Sales and Office Occupations by Sex
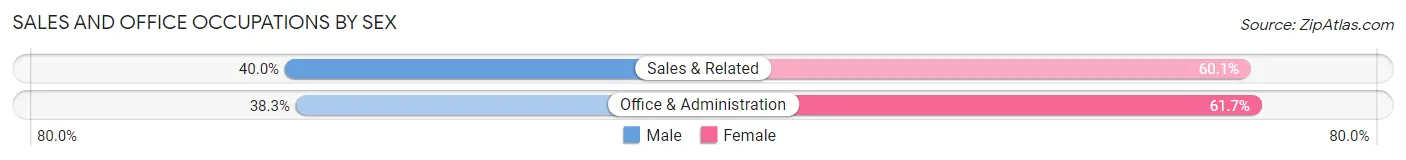
| Occupation | Male | Female |
| Sales & Related | 310 (40.0%) | 466 (60.1%) |
| Office & Administration | 278 (38.3%) | 448 (61.7%) |
| Total (Category) | 588 (39.2%) | 914 (60.9%) |
| Total (Overall) | 4,942 (51.0%) | 4,740 (49.0%) |
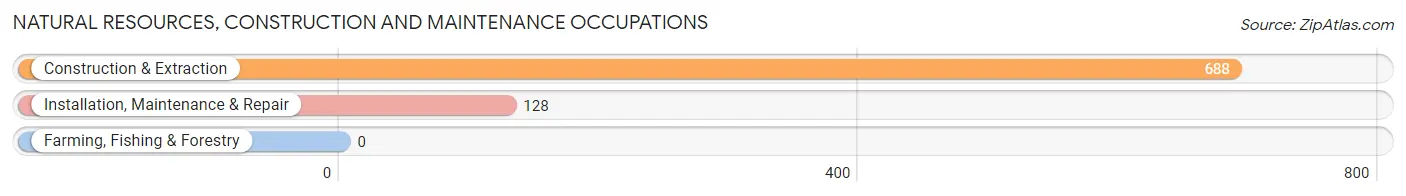
Natural Resources, Construction and Maintenance Occupations
The most common Natural Resources, Construction and Maintenance occupations in Redland are Construction & Extraction (688 | 7.1%), and Installation, Maintenance & Repair (128 | 1.3%).
Natural Resources, Construction and Maintenance Occupations by Sex
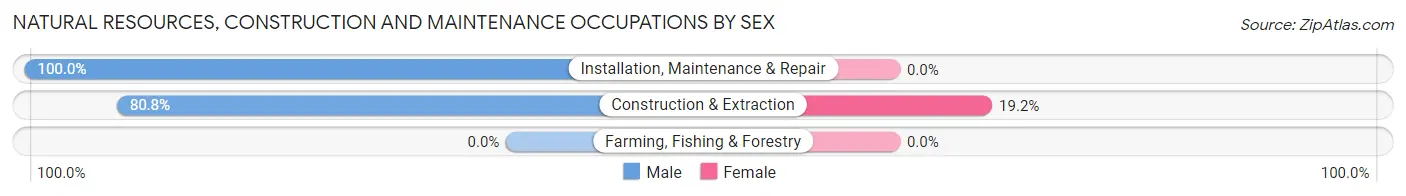
| Occupation | Male | Female |
| Farming, Fishing & Forestry | 0 (0.0%) | 0 (0.0%) |
| Construction & Extraction | 556 (80.8%) | 132 (19.2%) |
| Installation, Maintenance & Repair | 128 (100.0%) | 0 (0.0%) |
| Total (Category) | 684 (83.8%) | 132 (16.2%) |
| Total (Overall) | 4,942 (51.0%) | 4,740 (49.0%) |
Production, Transportation and Moving Occupations
The most common Production, Transportation and Moving occupations in Redland are Production (338 | 3.5%), Transportation (299 | 3.1%), and Material Moving (176 | 1.8%).
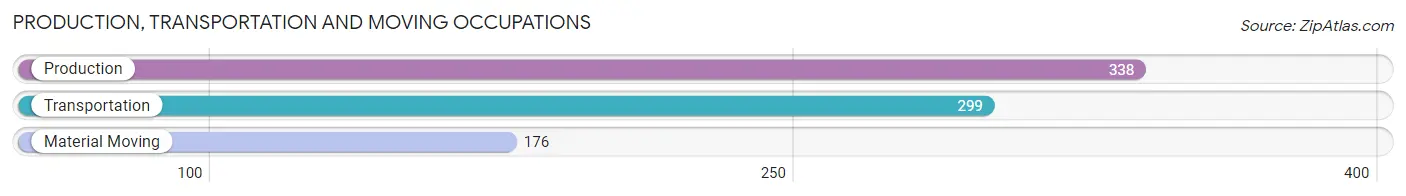
Production, Transportation and Moving Occupations by Sex
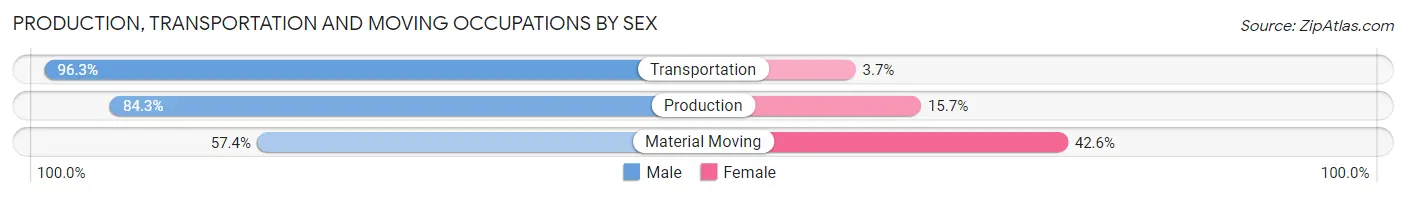
| Occupation | Male | Female |
| Production | 285 (84.3%) | 53 (15.7%) |
| Transportation | 288 (96.3%) | 11 (3.7%) |
| Material Moving | 101 (57.4%) | 75 (42.6%) |
| Total (Category) | 674 (82.9%) | 139 (17.1%) |
| Total (Overall) | 4,942 (51.0%) | 4,740 (49.0%) |
Employment Industries by Sex in Redland
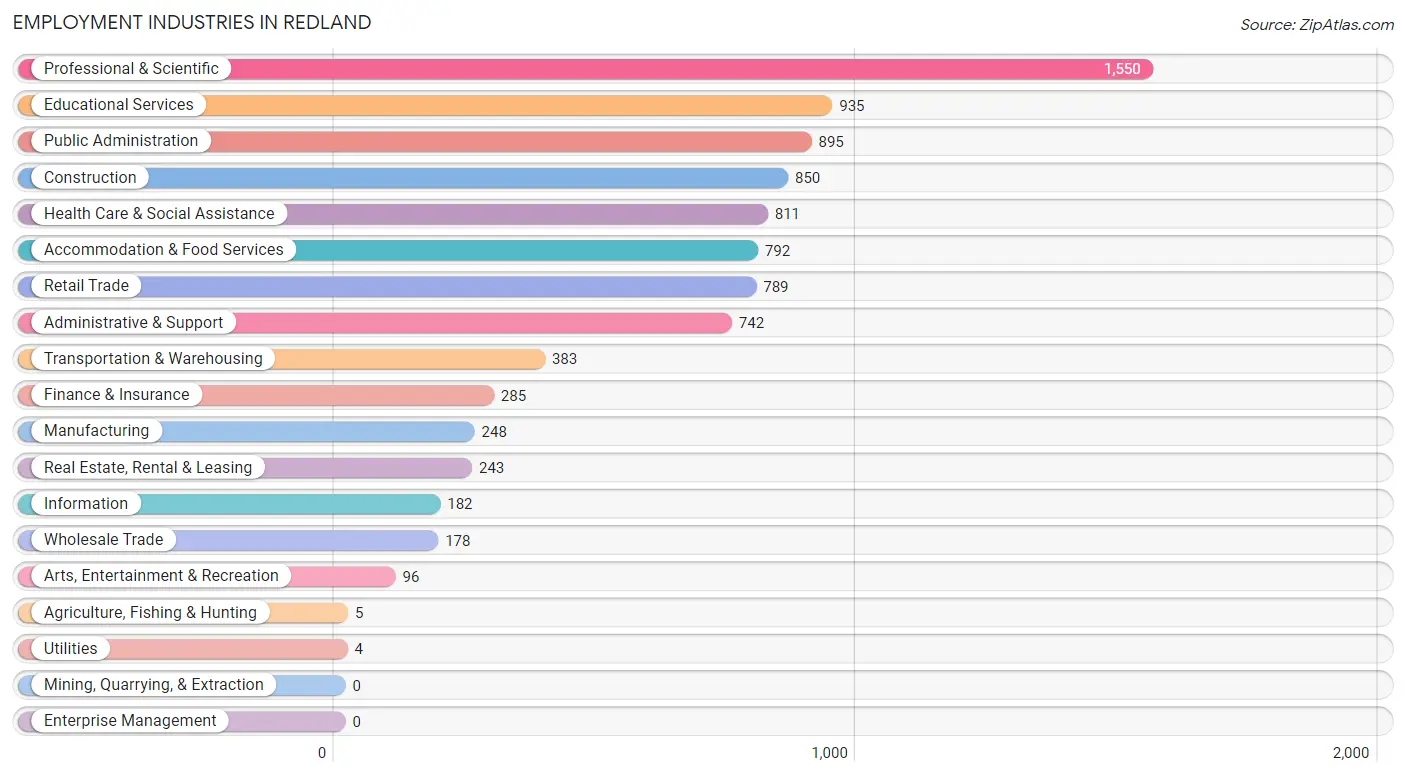
Employment Industries in Redland
The major employment industries in Redland include Professional & Scientific (1,550 | 16.0%), Educational Services (935 | 9.7%), Public Administration (895 | 9.2%), Construction (850 | 8.8%), and Health Care & Social Assistance (811 | 8.4%).
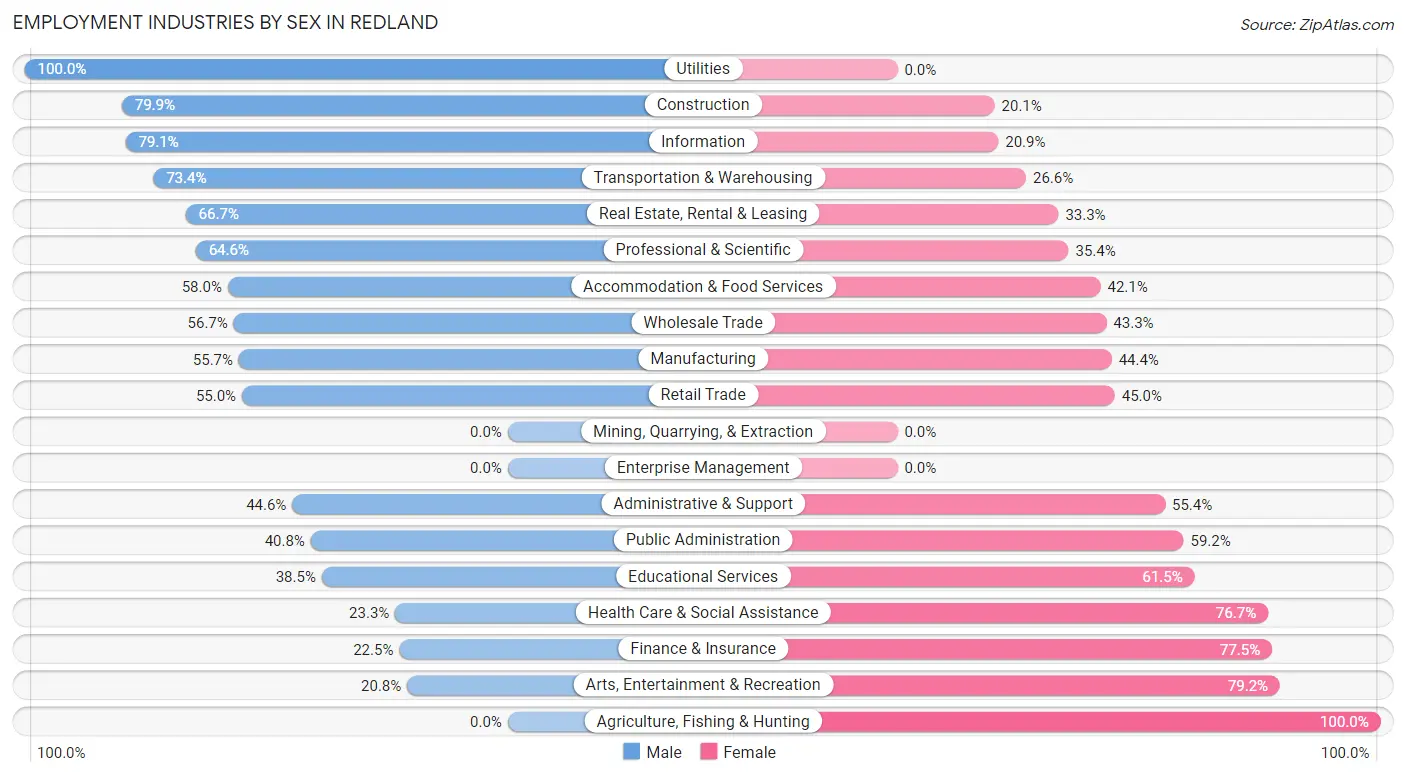
Employment Industries by Sex in Redland
The Redland industries that see more men than women are Utilities (100.0%), Construction (79.9%), and Information (79.1%), whereas the industries that tend to have a higher number of women are Agriculture, Fishing & Hunting (100.0%), Arts, Entertainment & Recreation (79.2%), and Finance & Insurance (77.5%).
| Industry | Male | Female |
| Agriculture, Fishing & Hunting | 0 (0.0%) | 5 (100.0%) |
| Mining, Quarrying, & Extraction | 0 (0.0%) | 0 (0.0%) |
| Construction | 679 (79.9%) | 171 (20.1%) |
| Manufacturing | 138 (55.6%) | 110 (44.4%) |
| Wholesale Trade | 101 (56.7%) | 77 (43.3%) |
| Retail Trade | 434 (55.0%) | 355 (45.0%) |
| Transportation & Warehousing | 281 (73.4%) | 102 (26.6%) |
| Utilities | 4 (100.0%) | 0 (0.0%) |
| Information | 144 (79.1%) | 38 (20.9%) |
| Finance & Insurance | 64 (22.5%) | 221 (77.5%) |
| Real Estate, Rental & Leasing | 162 (66.7%) | 81 (33.3%) |
| Professional & Scientific | 1,001 (64.6%) | 549 (35.4%) |
| Enterprise Management | 0 (0.0%) | 0 (0.0%) |
| Administrative & Support | 331 (44.6%) | 411 (55.4%) |
| Educational Services | 360 (38.5%) | 575 (61.5%) |
| Health Care & Social Assistance | 189 (23.3%) | 622 (76.7%) |
| Arts, Entertainment & Recreation | 20 (20.8%) | 76 (79.2%) |
| Accommodation & Food Services | 459 (58.0%) | 333 (42.0%) |
| Public Administration | 365 (40.8%) | 530 (59.2%) |
| Total | 4,942 (51.0%) | 4,740 (49.0%) |
Education in Redland
School Enrollment in Redland
The most common levels of schooling among the 4,133 students in Redland are high school (1,251 | 30.3%), middle school (983 | 23.8%), and elementary school (704 | 17.0%).
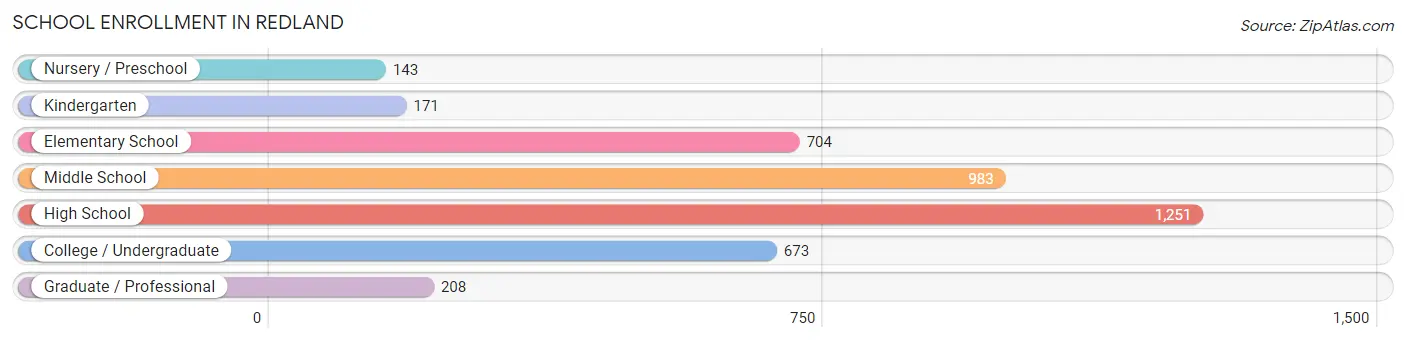
| School Level | # Students | % Students |
| Nursery / Preschool | 143 | 3.5% |
| Kindergarten | 171 | 4.1% |
| Elementary School | 704 | 17.0% |
| Middle School | 983 | 23.8% |
| High School | 1,251 | 30.3% |
| College / Undergraduate | 673 | 16.3% |
| Graduate / Professional | 208 | 5.0% |
| Total | 4,133 | 100.0% |
School Enrollment by Age by Funding Source in Redland
Out of a total of 4,133 students who are enrolled in schools in Redland, 467 (11.3%) attend a private institution, while the remaining 3,666 (88.7%) are enrolled in public schools. The age group of 3 to 4 year olds has the highest likelihood of being enrolled in private schools, with 82 (54.7% in the age bracket) enrolled. Conversely, the age group of 15 to 17 year olds has the lowest likelihood of being enrolled in a private school, with 758 (97.7% in the age bracket) attending a public institution.
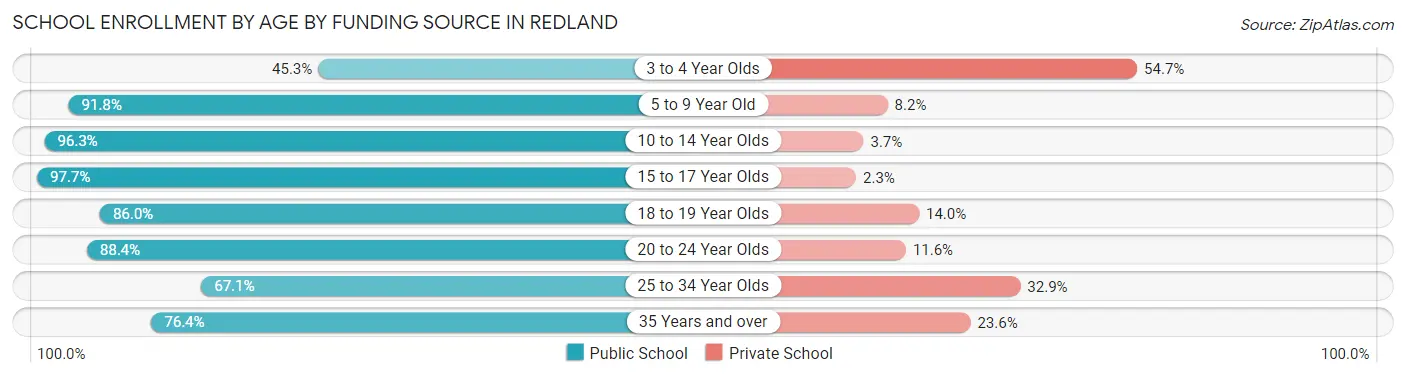
| Age Bracket | Public School | Private School |
| 3 to 4 Year Olds | 68 (45.3%) | 82 (54.7%) |
| 5 to 9 Year Old | 751 (91.8%) | 67 (8.2%) |
| 10 to 14 Year Olds | 1,015 (96.3%) | 39 (3.7%) |
| 15 to 17 Year Olds | 758 (97.7%) | 18 (2.3%) |
| 18 to 19 Year Olds | 300 (86.0%) | 49 (14.0%) |
| 20 to 24 Year Olds | 320 (88.4%) | 42 (11.6%) |
| 25 to 34 Year Olds | 163 (67.1%) | 80 (32.9%) |
| 35 Years and over | 291 (76.4%) | 90 (23.6%) |
| Total | 3,666 (88.7%) | 467 (11.3%) |
Educational Attainment by Field of Study in Redland
Business (1,125 | 16.4%), social sciences (952 | 13.9%), computers & mathematics (690 | 10.1%), engineering (495 | 7.2%), and bio, nature & agricultural (484 | 7.1%) are the most common fields of study among 6,846 individuals in Redland who have obtained a bachelor's degree or higher.
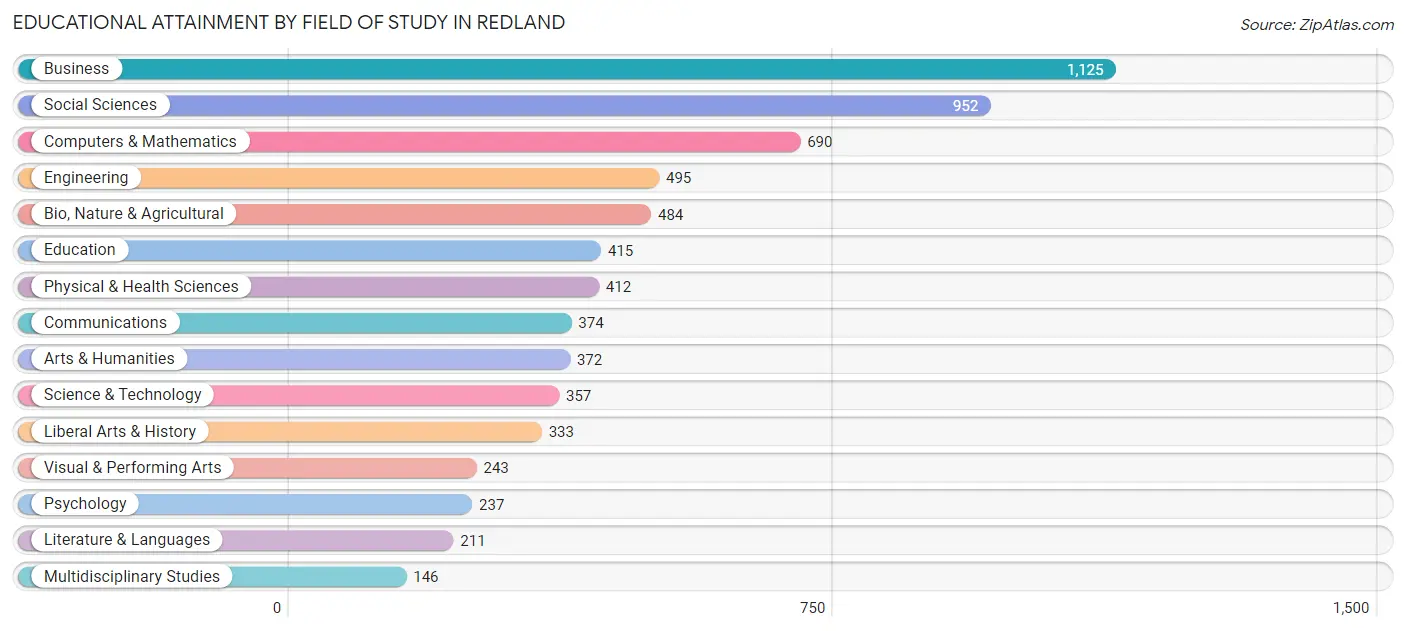
| Field of Study | # Graduates | % Graduates |
| Computers & Mathematics | 690 | 10.1% |
| Bio, Nature & Agricultural | 484 | 7.1% |
| Physical & Health Sciences | 412 | 6.0% |
| Psychology | 237 | 3.5% |
| Social Sciences | 952 | 13.9% |
| Engineering | 495 | 7.2% |
| Multidisciplinary Studies | 146 | 2.1% |
| Science & Technology | 357 | 5.2% |
| Business | 1,125 | 16.4% |
| Education | 415 | 6.1% |
| Literature & Languages | 211 | 3.1% |
| Liberal Arts & History | 333 | 4.9% |
| Visual & Performing Arts | 243 | 3.5% |
| Communications | 374 | 5.5% |
| Arts & Humanities | 372 | 5.4% |
| Total | 6,846 | 100.0% |
Transportation & Commute in Redland
Vehicle Availability by Sex in Redland
The most prevalent vehicle ownership categories in Redland are males with 2 vehicles (2,282, accounting for 47.0%) and females with 2 vehicles (2,172, making up 49.5%).
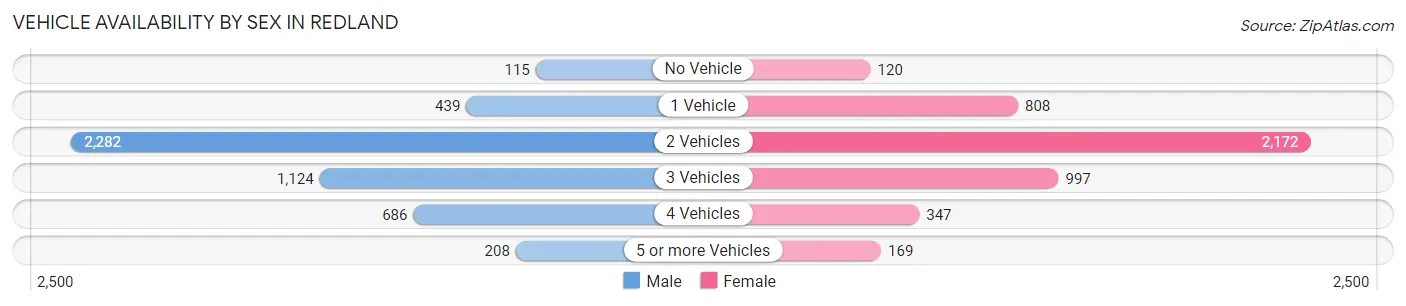
| Vehicles Available | Male | Female |
| No Vehicle | 115 (2.4%) | 120 (2.6%) |
| 1 Vehicle | 439 (9.0%) | 808 (17.5%) |
| 2 Vehicles | 2,282 (47.0%) | 2,172 (47.1%) |
| 3 Vehicles | 1,124 (23.2%) | 997 (21.6%) |
| 4 Vehicles | 686 (14.1%) | 347 (7.5%) |
| 5 or more Vehicles | 208 (4.3%) | 169 (3.7%) |
| Total | 4,854 (100.0%) | 4,613 (100.0%) |
Commute Time in Redland
The most frequently occuring commute durations in Redland are 30 to 34 minutes (1,220 commuters, 15.7%), 15 to 19 minutes (1,049 commuters, 13.5%), and 60 to 89 minutes (1,034 commuters, 13.3%).
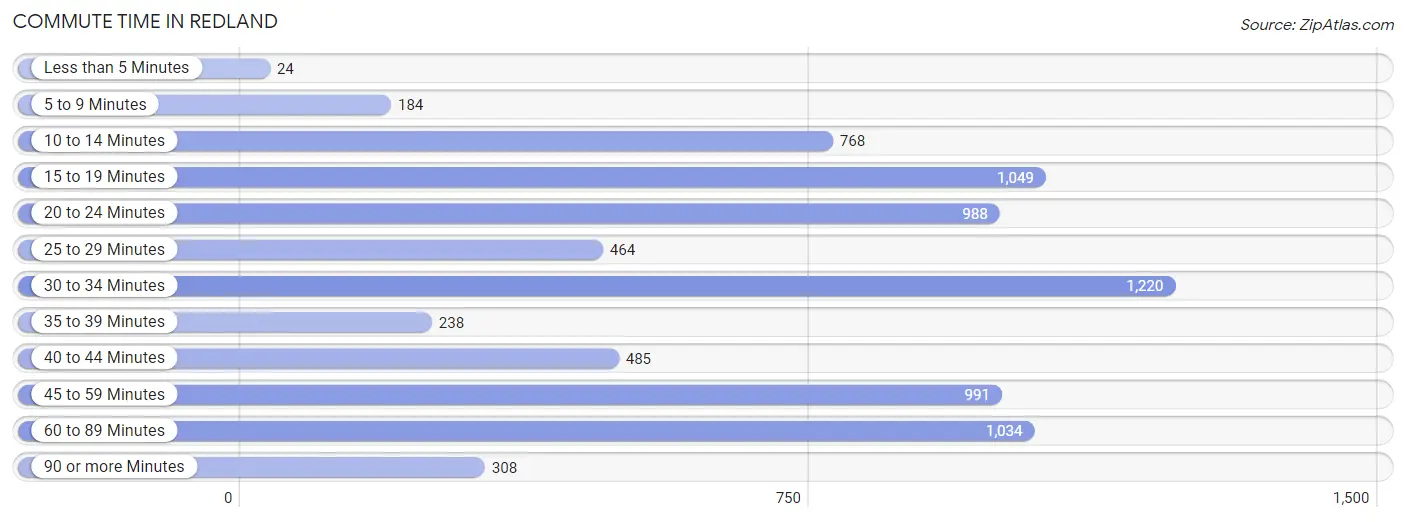
| Commute Time | # Commuters | % Commuters |
| Less than 5 Minutes | 24 | 0.3% |
| 5 to 9 Minutes | 184 | 2.4% |
| 10 to 14 Minutes | 768 | 9.9% |
| 15 to 19 Minutes | 1,049 | 13.5% |
| 20 to 24 Minutes | 988 | 12.7% |
| 25 to 29 Minutes | 464 | 6.0% |
| 30 to 34 Minutes | 1,220 | 15.7% |
| 35 to 39 Minutes | 238 | 3.1% |
| 40 to 44 Minutes | 485 | 6.3% |
| 45 to 59 Minutes | 991 | 12.8% |
| 60 to 89 Minutes | 1,034 | 13.3% |
| 90 or more Minutes | 308 | 4.0% |
Commute Time by Sex in Redland
The most common commute times in Redland are 60 to 89 minutes (694 commuters, 16.9%) for males and 15 to 19 minutes (715 commuters, 19.6%) for females.
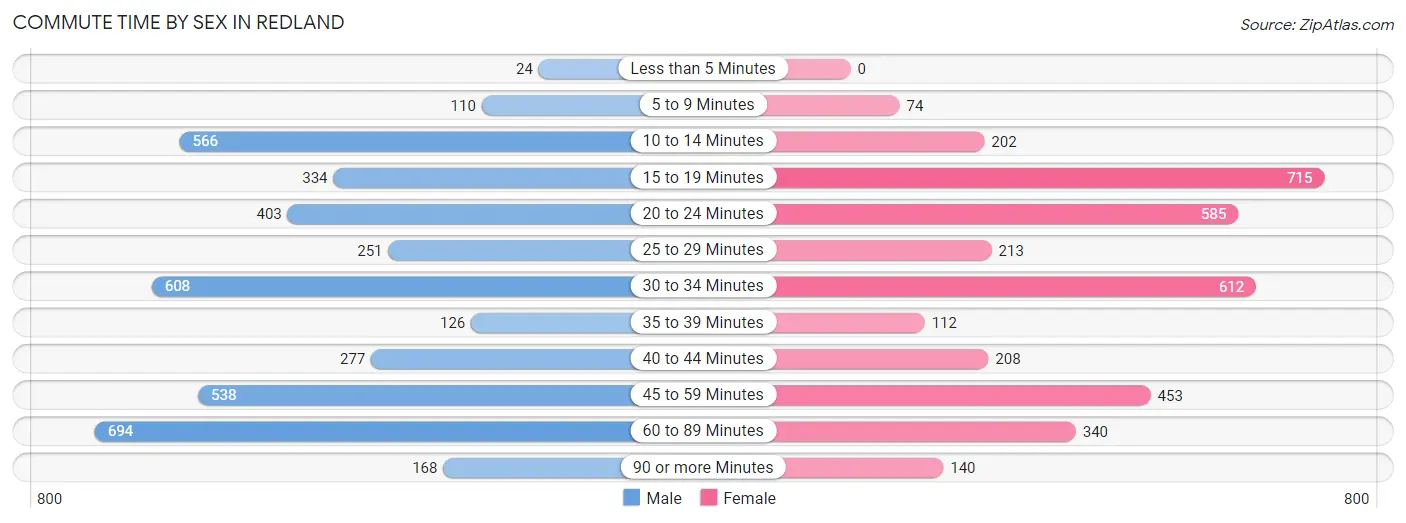
| Commute Time | Male | Female |
| Less than 5 Minutes | 24 (0.6%) | 0 (0.0%) |
| 5 to 9 Minutes | 110 (2.7%) | 74 (2.0%) |
| 10 to 14 Minutes | 566 (13.8%) | 202 (5.5%) |
| 15 to 19 Minutes | 334 (8.2%) | 715 (19.6%) |
| 20 to 24 Minutes | 403 (9.8%) | 585 (16.0%) |
| 25 to 29 Minutes | 251 (6.1%) | 213 (5.8%) |
| 30 to 34 Minutes | 608 (14.8%) | 612 (16.8%) |
| 35 to 39 Minutes | 126 (3.1%) | 112 (3.1%) |
| 40 to 44 Minutes | 277 (6.8%) | 208 (5.7%) |
| 45 to 59 Minutes | 538 (13.1%) | 453 (12.4%) |
| 60 to 89 Minutes | 694 (16.9%) | 340 (9.3%) |
| 90 or more Minutes | 168 (4.1%) | 140 (3.8%) |
Time of Departure to Work by Sex in Redland
The most frequent times of departure to work in Redland are 9:00 AM to 9:59 AM (644, 15.7%) for males and 7:30 AM to 7:59 AM (586, 16.0%) for females.
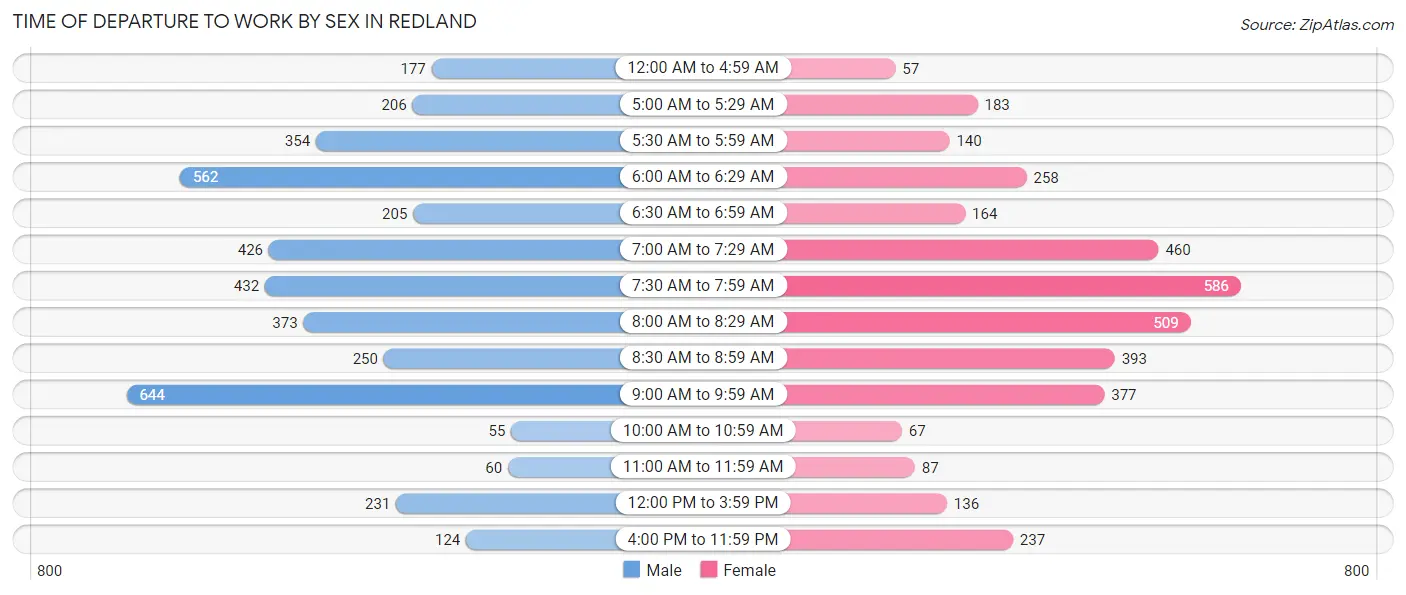
| Time of Departure | Male | Female |
| 12:00 AM to 4:59 AM | 177 (4.3%) | 57 (1.6%) |
| 5:00 AM to 5:29 AM | 206 (5.0%) | 183 (5.0%) |
| 5:30 AM to 5:59 AM | 354 (8.6%) | 140 (3.8%) |
| 6:00 AM to 6:29 AM | 562 (13.7%) | 258 (7.1%) |
| 6:30 AM to 6:59 AM | 205 (5.0%) | 164 (4.5%) |
| 7:00 AM to 7:29 AM | 426 (10.4%) | 460 (12.6%) |
| 7:30 AM to 7:59 AM | 432 (10.5%) | 586 (16.0%) |
| 8:00 AM to 8:29 AM | 373 (9.1%) | 509 (13.9%) |
| 8:30 AM to 8:59 AM | 250 (6.1%) | 393 (10.8%) |
| 9:00 AM to 9:59 AM | 644 (15.7%) | 377 (10.3%) |
| 10:00 AM to 10:59 AM | 55 (1.3%) | 67 (1.8%) |
| 11:00 AM to 11:59 AM | 60 (1.5%) | 87 (2.4%) |
| 12:00 PM to 3:59 PM | 231 (5.6%) | 136 (3.7%) |
| 4:00 PM to 11:59 PM | 124 (3.0%) | 237 (6.5%) |
| Total | 4,099 (100.0%) | 3,654 (100.0%) |
Housing Occupancy in Redland
Occupancy by Ownership in Redland
Of the total 5,719 dwellings in Redland, owner-occupied units account for 4,561 (79.7%), while renter-occupied units make up 1,158 (20.3%).
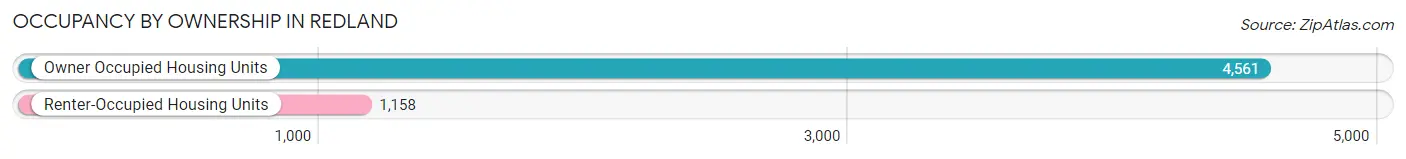
| Occupancy | # Housing Units | % Housing Units |
| Owner Occupied Housing Units | 4,561 | 79.7% |
| Renter-Occupied Housing Units | 1,158 | 20.3% |
| Total Occupied Housing Units | 5,719 | 100.0% |
Occupancy by Household Size in Redland
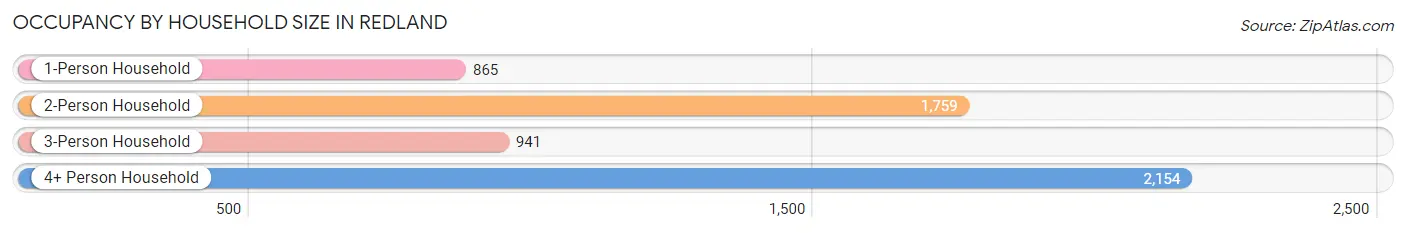
| Household Size | # Housing Units | % Housing Units |
| 1-Person Household | 865 | 15.1% |
| 2-Person Household | 1,759 | 30.8% |
| 3-Person Household | 941 | 16.5% |
| 4+ Person Household | 2,154 | 37.7% |
| Total Housing Units | 5,719 | 100.0% |
Occupancy by Ownership by Household Size in Redland
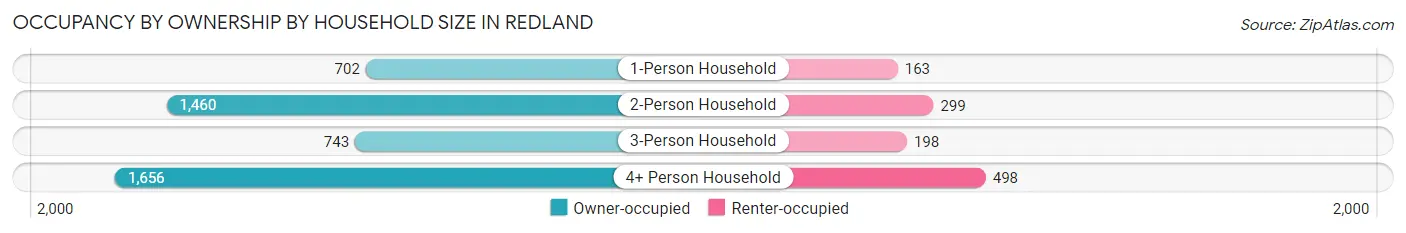
| Household Size | Owner-occupied | Renter-occupied |
| 1-Person Household | 702 (81.2%) | 163 (18.8%) |
| 2-Person Household | 1,460 (83.0%) | 299 (17.0%) |
| 3-Person Household | 743 (79.0%) | 198 (21.0%) |
| 4+ Person Household | 1,656 (76.9%) | 498 (23.1%) |
| Total Housing Units | 4,561 (79.7%) | 1,158 (20.3%) |
Occupancy by Educational Attainment in Redland
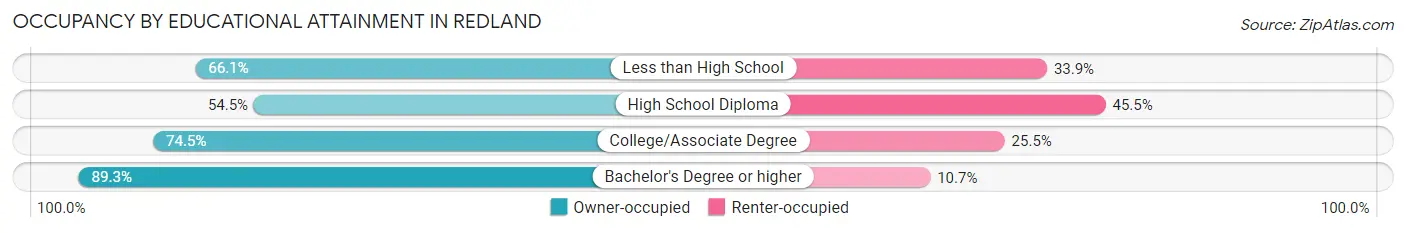
| Household Size | Owner-occupied | Renter-occupied |
| Less than High School | 375 (66.1%) | 192 (33.9%) |
| High School Diploma | 421 (54.5%) | 351 (45.5%) |
| College/Associate Degree | 734 (74.5%) | 251 (25.5%) |
| Bachelor's Degree or higher | 3,031 (89.3%) | 364 (10.7%) |
Occupancy by Age of Householder in Redland
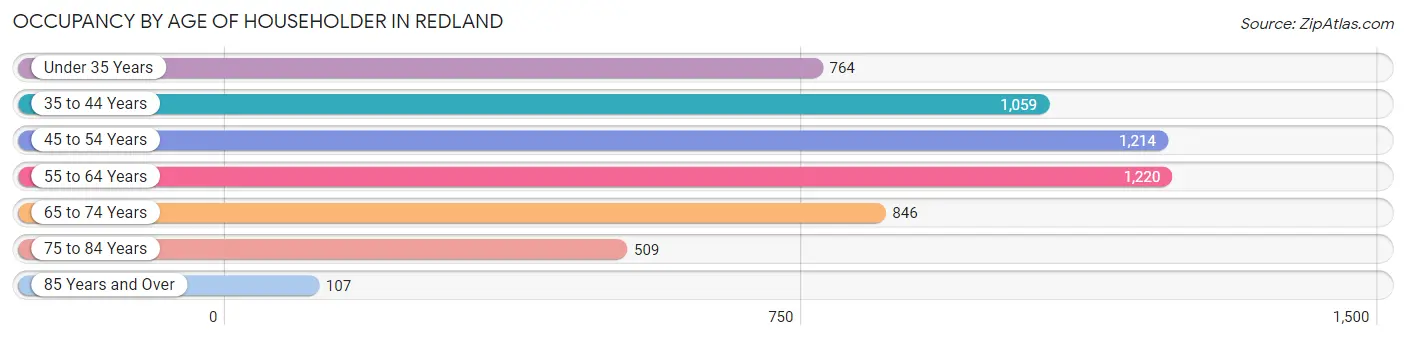
| Age Bracket | # Households | % Households |
| Under 35 Years | 764 | 13.4% |
| 35 to 44 Years | 1,059 | 18.5% |
| 45 to 54 Years | 1,214 | 21.2% |
| 55 to 64 Years | 1,220 | 21.3% |
| 65 to 74 Years | 846 | 14.8% |
| 75 to 84 Years | 509 | 8.9% |
| 85 Years and Over | 107 | 1.9% |
| Total | 5,719 | 100.0% |
Housing Finances in Redland
Median Income by Occupancy in Redland
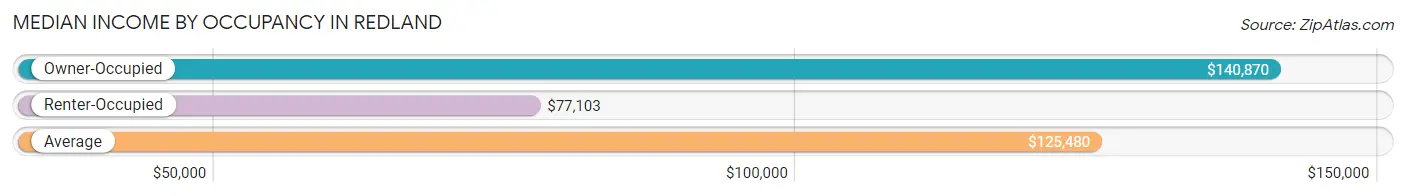
| Occupancy Type | # Households | Median Income |
| Owner-Occupied | 4,561 (79.7%) | $140,870 |
| Renter-Occupied | 1,158 (20.3%) | $77,103 |
| Average | 5,719 (100.0%) | $125,480 |
Occupancy by Householder Income Bracket in Redland
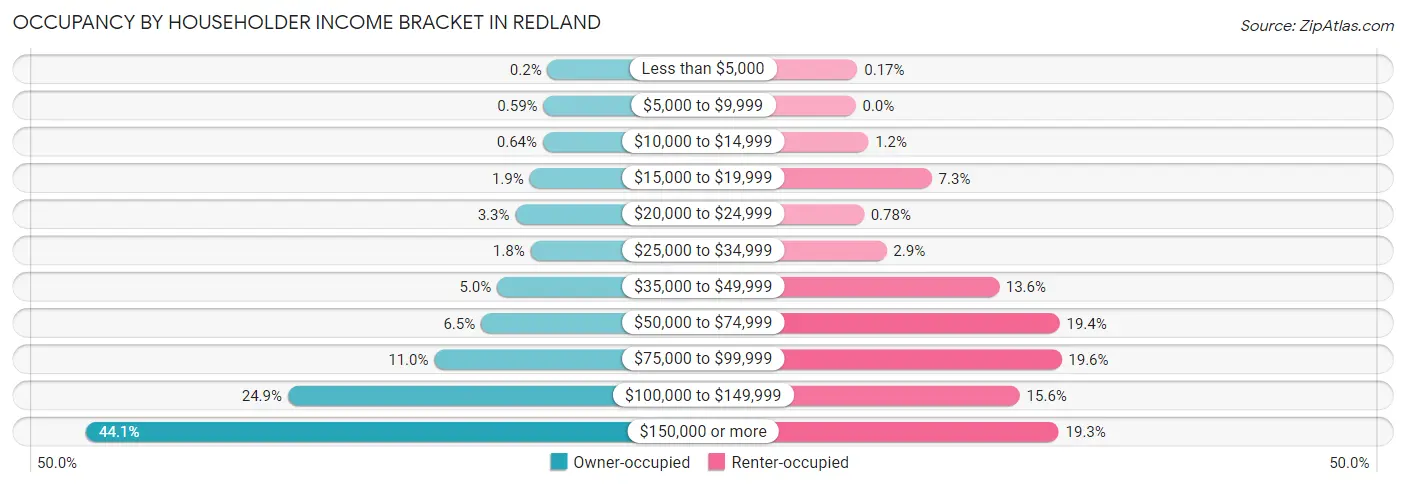
| Income Bracket | Owner-occupied | Renter-occupied |
| Less than $5,000 | 9 (0.2%) | 2 (0.2%) |
| $5,000 to $9,999 | 27 (0.6%) | 0 (0.0%) |
| $10,000 to $14,999 | 29 (0.6%) | 14 (1.2%) |
| $15,000 to $19,999 | 87 (1.9%) | 84 (7.2%) |
| $20,000 to $24,999 | 149 (3.3%) | 9 (0.8%) |
| $25,000 to $34,999 | 83 (1.8%) | 34 (2.9%) |
| $35,000 to $49,999 | 228 (5.0%) | 158 (13.6%) |
| $50,000 to $74,999 | 298 (6.5%) | 225 (19.4%) |
| $75,000 to $99,999 | 501 (11.0%) | 227 (19.6%) |
| $100,000 to $149,999 | 1,137 (24.9%) | 181 (15.6%) |
| $150,000 or more | 2,013 (44.1%) | 224 (19.3%) |
| Total | 4,561 (100.0%) | 1,158 (100.0%) |
Monthly Housing Cost Tiers in Redland
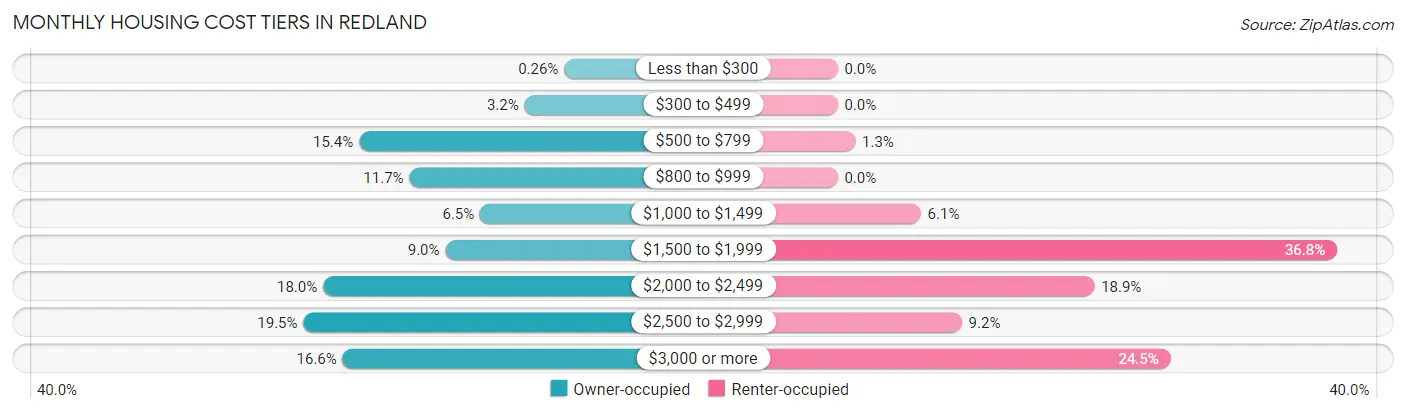
| Monthly Cost | Owner-occupied | Renter-occupied |
| Less than $300 | 12 (0.3%) | 0 (0.0%) |
| $300 to $499 | 145 (3.2%) | 0 (0.0%) |
| $500 to $799 | 701 (15.4%) | 15 (1.3%) |
| $800 to $999 | 532 (11.7%) | 0 (0.0%) |
| $1,000 to $1,499 | 294 (6.5%) | 71 (6.1%) |
| $1,500 to $1,999 | 411 (9.0%) | 426 (36.8%) |
| $2,000 to $2,499 | 822 (18.0%) | 219 (18.9%) |
| $2,500 to $2,999 | 888 (19.5%) | 106 (9.1%) |
| $3,000 or more | 756 (16.6%) | 284 (24.5%) |
| Total | 4,561 (100.0%) | 1,158 (100.0%) |
Physical Housing Characteristics in Redland
Housing Structures in Redland
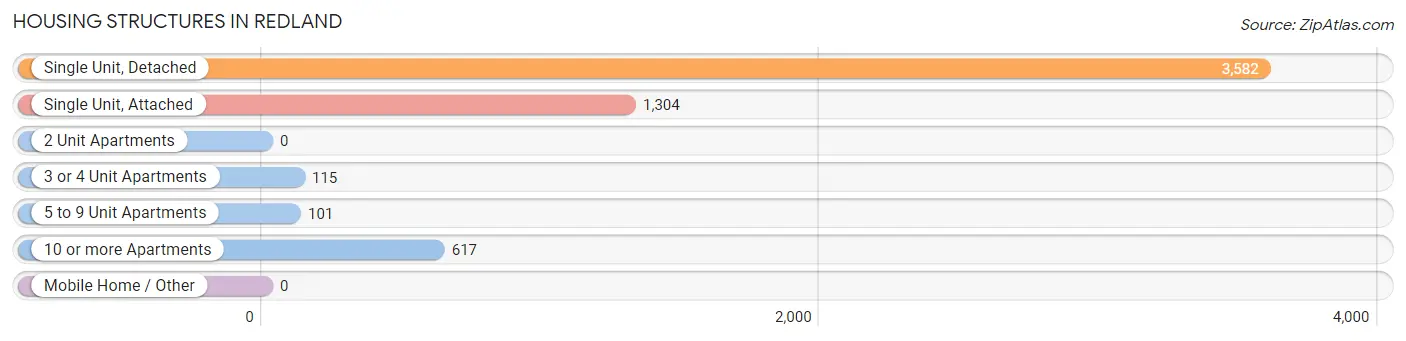
| Structure Type | # Housing Units | % Housing Units |
| Single Unit, Detached | 3,582 | 62.6% |
| Single Unit, Attached | 1,304 | 22.8% |
| 2 Unit Apartments | 0 | 0.0% |
| 3 or 4 Unit Apartments | 115 | 2.0% |
| 5 to 9 Unit Apartments | 101 | 1.8% |
| 10 or more Apartments | 617 | 10.8% |
| Mobile Home / Other | 0 | 0.0% |
| Total | 5,719 | 100.0% |
Housing Structures by Occupancy in Redland
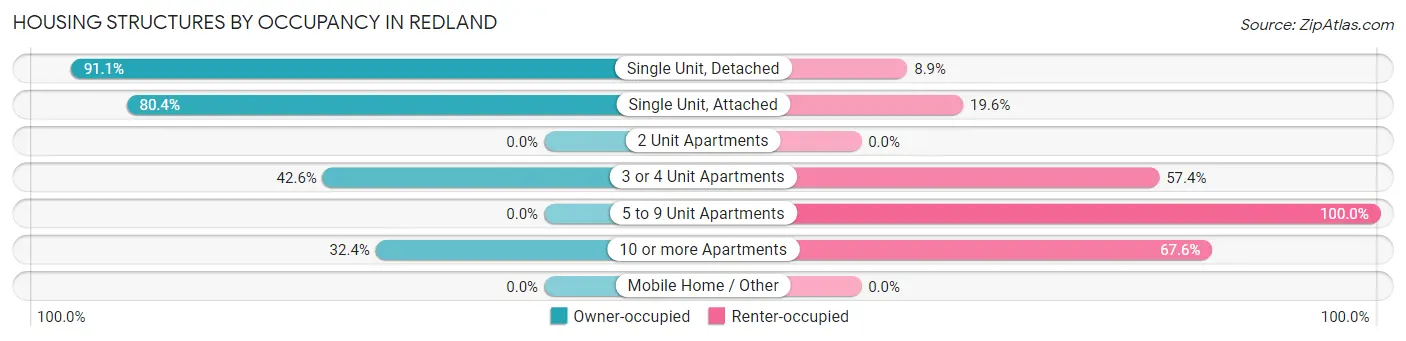
| Structure Type | Owner-occupied | Renter-occupied |
| Single Unit, Detached | 3,264 (91.1%) | 318 (8.9%) |
| Single Unit, Attached | 1,048 (80.4%) | 256 (19.6%) |
| 2 Unit Apartments | 0 (0.0%) | 0 (0.0%) |
| 3 or 4 Unit Apartments | 49 (42.6%) | 66 (57.4%) |
| 5 to 9 Unit Apartments | 0 (0.0%) | 101 (100.0%) |
| 10 or more Apartments | 200 (32.4%) | 417 (67.6%) |
| Mobile Home / Other | 0 (0.0%) | 0 (0.0%) |
| Total | 4,561 (79.7%) | 1,158 (20.3%) |
Housing Structures by Number of Rooms in Redland
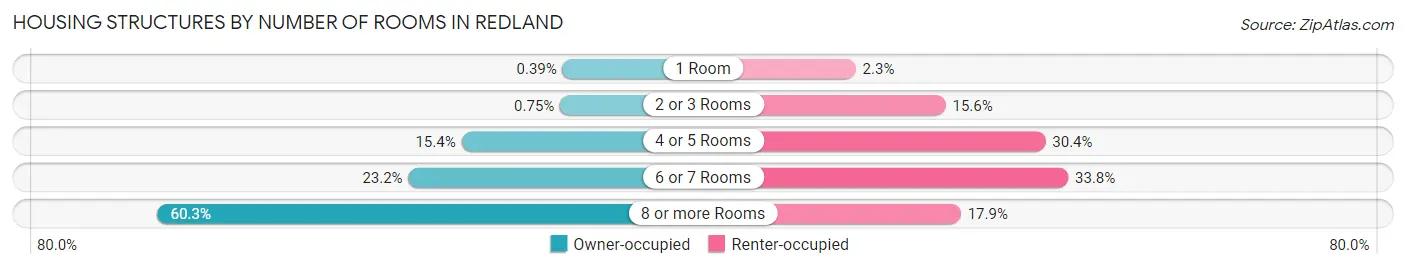
| Number of Rooms | Owner-occupied | Renter-occupied |
| 1 Room | 18 (0.4%) | 27 (2.3%) |
| 2 or 3 Rooms | 34 (0.7%) | 181 (15.6%) |
| 4 or 5 Rooms | 700 (15.3%) | 352 (30.4%) |
| 6 or 7 Rooms | 1,058 (23.2%) | 391 (33.8%) |
| 8 or more Rooms | 2,751 (60.3%) | 207 (17.9%) |
| Total | 4,561 (100.0%) | 1,158 (100.0%) |
Housing Structure by Heating Type in Redland
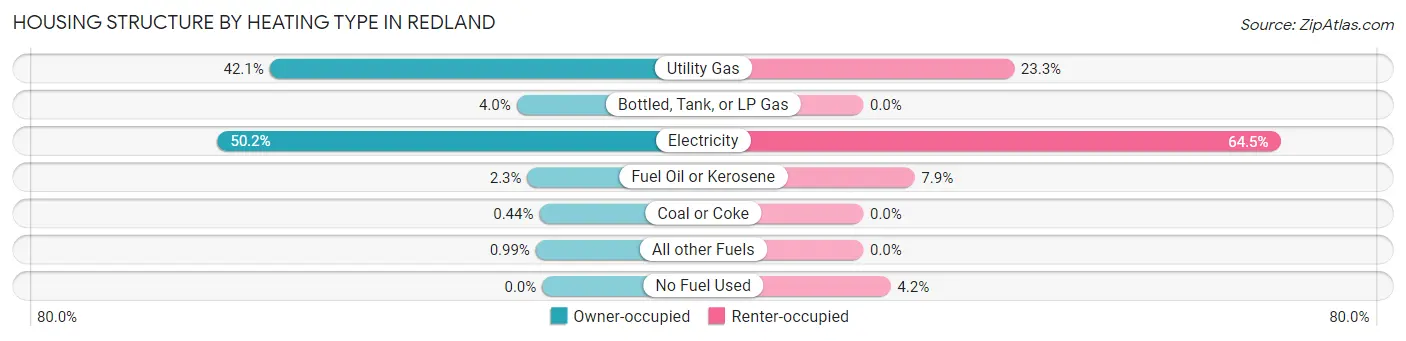
| Heating Type | Owner-occupied | Renter-occupied |
| Utility Gas | 1,922 (42.1%) | 270 (23.3%) |
| Bottled, Tank, or LP Gas | 180 (4.0%) | 0 (0.0%) |
| Electricity | 2,290 (50.2%) | 747 (64.5%) |
| Fuel Oil or Kerosene | 104 (2.3%) | 92 (7.9%) |
| Coal or Coke | 20 (0.4%) | 0 (0.0%) |
| All other Fuels | 45 (1.0%) | 0 (0.0%) |
| No Fuel Used | 0 (0.0%) | 49 (4.2%) |
| Total | 4,561 (100.0%) | 1,158 (100.0%) |
Household Vehicle Usage in Redland
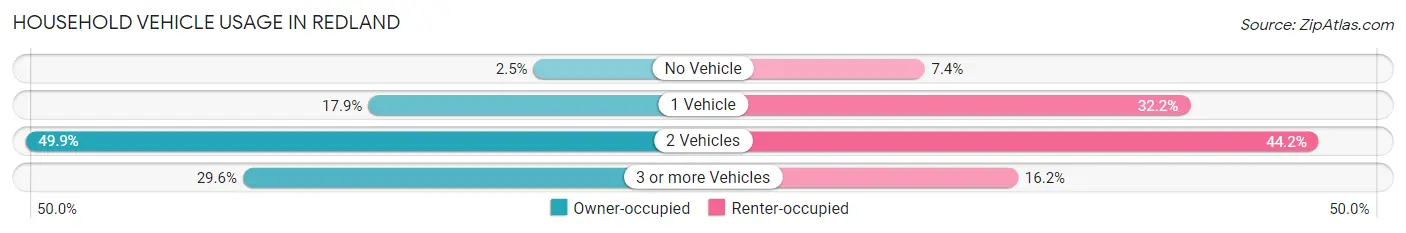
| Vehicles per Household | Owner-occupied | Renter-occupied |
| No Vehicle | 114 (2.5%) | 86 (7.4%) |
| 1 Vehicle | 818 (17.9%) | 373 (32.2%) |
| 2 Vehicles | 2,277 (49.9%) | 512 (44.2%) |
| 3 or more Vehicles | 1,352 (29.6%) | 187 (16.2%) |
| Total | 4,561 (100.0%) | 1,158 (100.0%) |
Real Estate & Mortgages in Redland
Real Estate and Mortgage Overview in Redland
| Characteristic | Without Mortgage | With Mortgage |
| Housing Units | 1,446 | 3,115 |
| Median Property Value | $502,600 | $496,100 |
| Median Household Income | $126,066 | $1,477 |
| Monthly Housing Costs | $762 | $756 |
| Real Estate Taxes | $4,471 | $124 |
Property Value by Mortgage Status in Redland
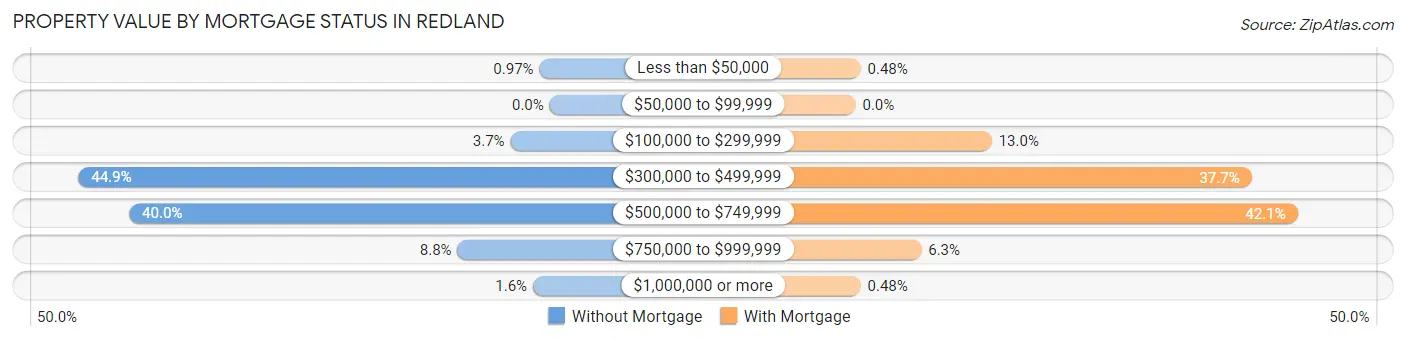
| Property Value | Without Mortgage | With Mortgage |
| Less than $50,000 | 14 (1.0%) | 15 (0.5%) |
| $50,000 to $99,999 | 0 (0.0%) | 0 (0.0%) |
| $100,000 to $299,999 | 54 (3.7%) | 404 (13.0%) |
| $300,000 to $499,999 | 649 (44.9%) | 1,175 (37.7%) |
| $500,000 to $749,999 | 579 (40.0%) | 1,311 (42.1%) |
| $750,000 to $999,999 | 127 (8.8%) | 195 (6.3%) |
| $1,000,000 or more | 23 (1.6%) | 15 (0.5%) |
| Total | 1,446 (100.0%) | 3,115 (100.0%) |
Household Income by Mortgage Status in Redland
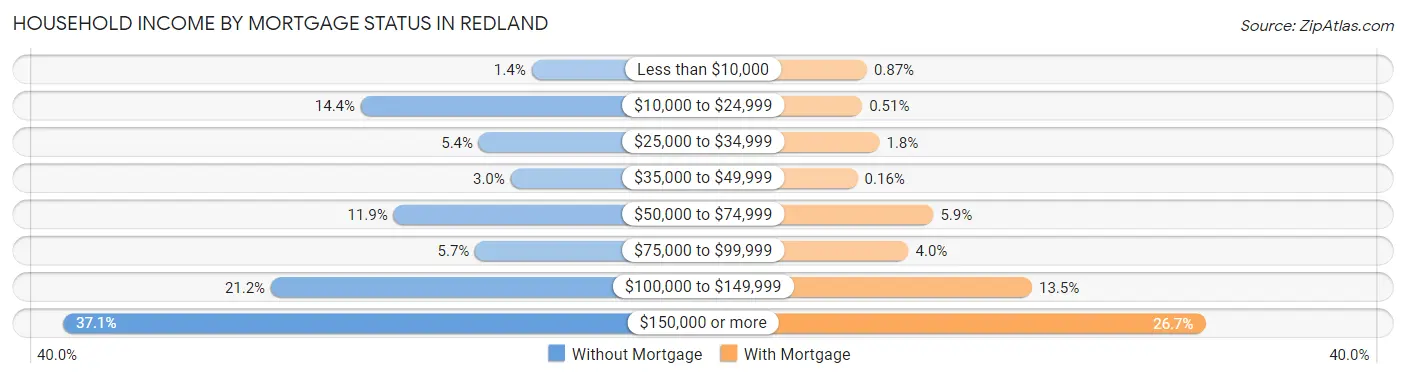
| Household Income | Without Mortgage | With Mortgage |
| Less than $10,000 | 20 (1.4%) | 27 (0.9%) |
| $10,000 to $24,999 | 208 (14.4%) | 16 (0.5%) |
| $25,000 to $34,999 | 78 (5.4%) | 57 (1.8%) |
| $35,000 to $49,999 | 43 (3.0%) | 5 (0.2%) |
| $50,000 to $74,999 | 172 (11.9%) | 185 (5.9%) |
| $75,000 to $99,999 | 82 (5.7%) | 126 (4.0%) |
| $100,000 to $149,999 | 307 (21.2%) | 419 (13.5%) |
| $150,000 or more | 536 (37.1%) | 830 (26.7%) |
| Total | 1,446 (100.0%) | 3,115 (100.0%) |
Property Value to Household Income Ratio in Redland
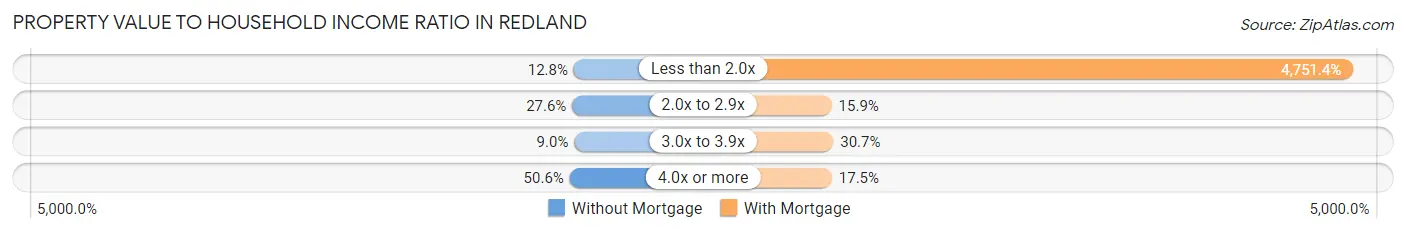
| Value-to-Income Ratio | Without Mortgage | With Mortgage |
| Less than 2.0x | 185 (12.8%) | 148,007 (4,751.4%) |
| 2.0x to 2.9x | 399 (27.6%) | 494 (15.9%) |
| 3.0x to 3.9x | 130 (9.0%) | 957 (30.7%) |
| 4.0x or more | 732 (50.6%) | 544 (17.5%) |
| Total | 1,446 (100.0%) | 3,115 (100.0%) |
Real Estate Taxes by Mortgage Status in Redland
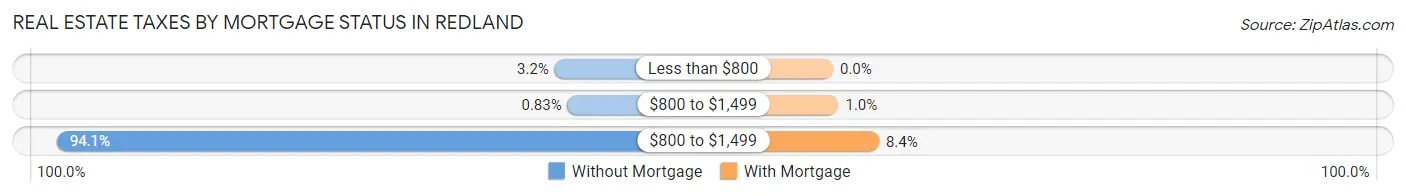
| Property Taxes | Without Mortgage | With Mortgage |
| Less than $800 | 46 (3.2%) | 0 (0.0%) |
| $800 to $1,499 | 12 (0.8%) | 31 (1.0%) |
| $800 to $1,499 | 1,361 (94.1%) | 261 (8.4%) |
| Total | 1,446 (100.0%) | 3,115 (100.0%) |
Health & Disability in Redland
Health Insurance Coverage by Age in Redland
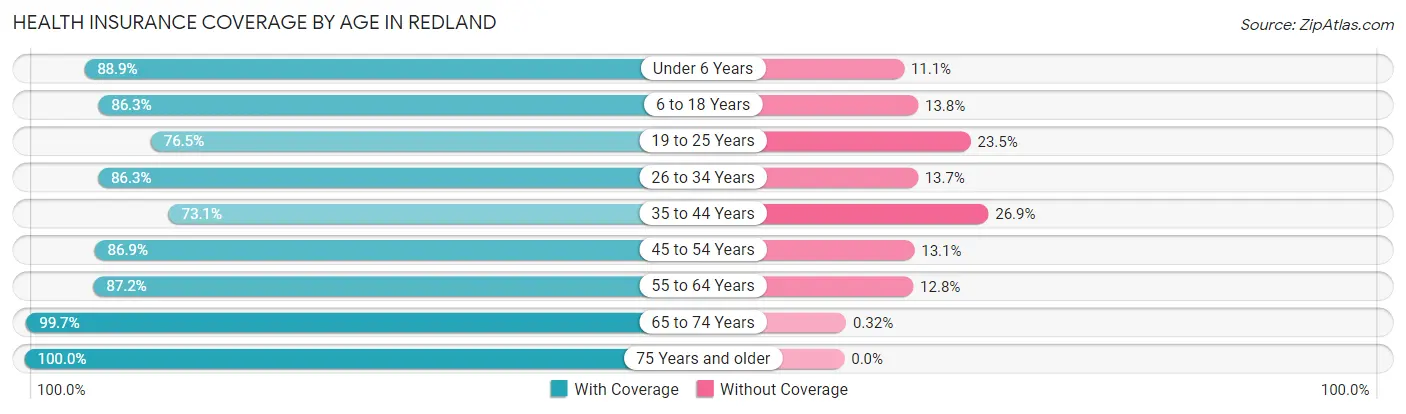
| Age Bracket | With Coverage | Without Coverage |
| Under 6 Years | 1,263 (88.9%) | 158 (11.1%) |
| 6 to 18 Years | 2,572 (86.3%) | 410 (13.8%) |
| 19 to 25 Years | 932 (76.5%) | 287 (23.5%) |
| 26 to 34 Years | 1,815 (86.3%) | 288 (13.7%) |
| 35 to 44 Years | 1,933 (73.1%) | 710 (26.9%) |
| 45 to 54 Years | 1,943 (86.9%) | 292 (13.1%) |
| 55 to 64 Years | 2,322 (87.2%) | 342 (12.8%) |
| 65 to 74 Years | 1,857 (99.7%) | 6 (0.3%) |
| 75 Years and older | 1,172 (100.0%) | 0 (0.0%) |
| Total | 15,809 (86.4%) | 2,493 (13.6%) |
Health Insurance Coverage by Citizenship Status in Redland
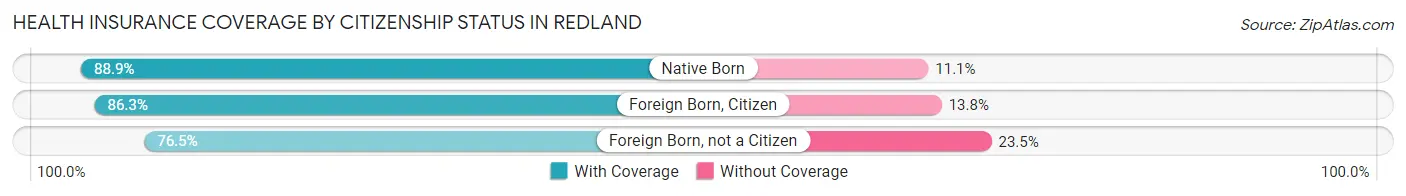
| Citizenship Status | With Coverage | Without Coverage |
| Native Born | 1,263 (88.9%) | 158 (11.1%) |
| Foreign Born, Citizen | 2,572 (86.3%) | 410 (13.8%) |
| Foreign Born, not a Citizen | 932 (76.5%) | 287 (23.5%) |
Health Insurance Coverage by Household Income in Redland
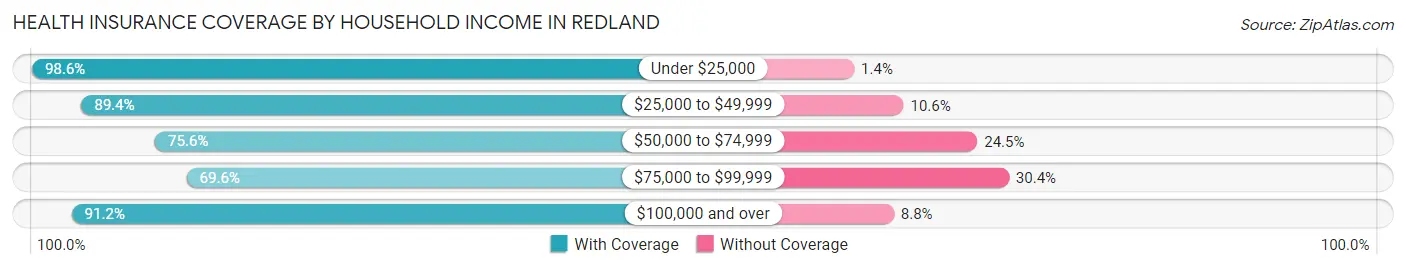
| Household Income | With Coverage | Without Coverage |
| Under $25,000 | 785 (98.6%) | 11 (1.4%) |
| $25,000 to $49,999 | 1,084 (89.4%) | 129 (10.6%) |
| $50,000 to $74,999 | 1,573 (75.5%) | 509 (24.4%) |
| $75,000 to $99,999 | 1,912 (69.6%) | 834 (30.4%) |
| $100,000 and over | 10,427 (91.2%) | 1,007 (8.8%) |
Public vs Private Health Insurance Coverage by Age in Redland
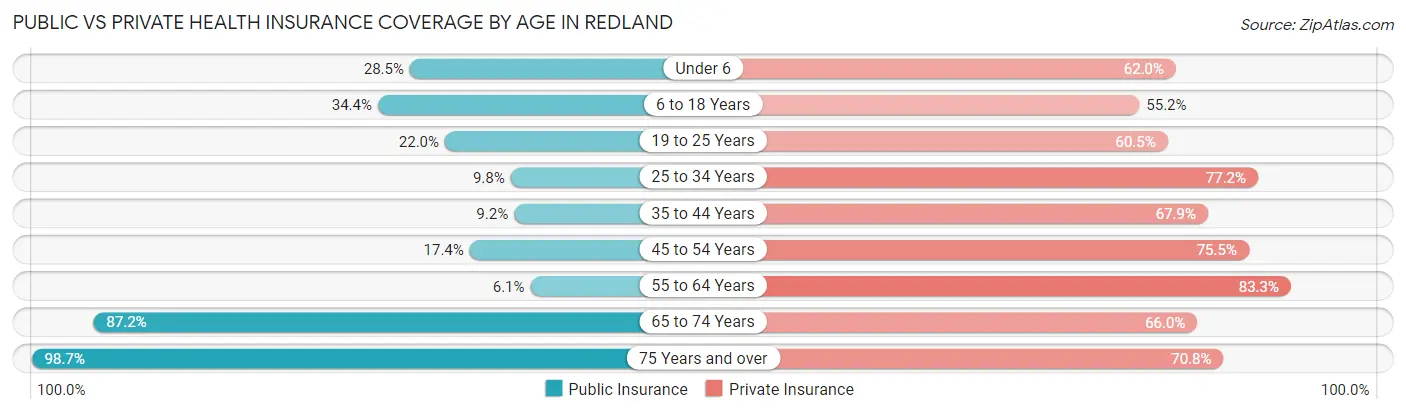
| Age Bracket | Public Insurance | Private Insurance |
| Under 6 | 405 (28.5%) | 881 (62.0%) |
| 6 to 18 Years | 1,027 (34.4%) | 1,647 (55.2%) |
| 19 to 25 Years | 268 (22.0%) | 737 (60.5%) |
| 25 to 34 Years | 206 (9.8%) | 1,624 (77.2%) |
| 35 to 44 Years | 242 (9.2%) | 1,795 (67.9%) |
| 45 to 54 Years | 389 (17.4%) | 1,688 (75.5%) |
| 55 to 64 Years | 163 (6.1%) | 2,220 (83.3%) |
| 65 to 74 Years | 1,625 (87.2%) | 1,229 (66.0%) |
| 75 Years and over | 1,157 (98.7%) | 830 (70.8%) |
| Total | 5,482 (29.9%) | 12,651 (69.1%) |
Disability Status by Sex by Age in Redland
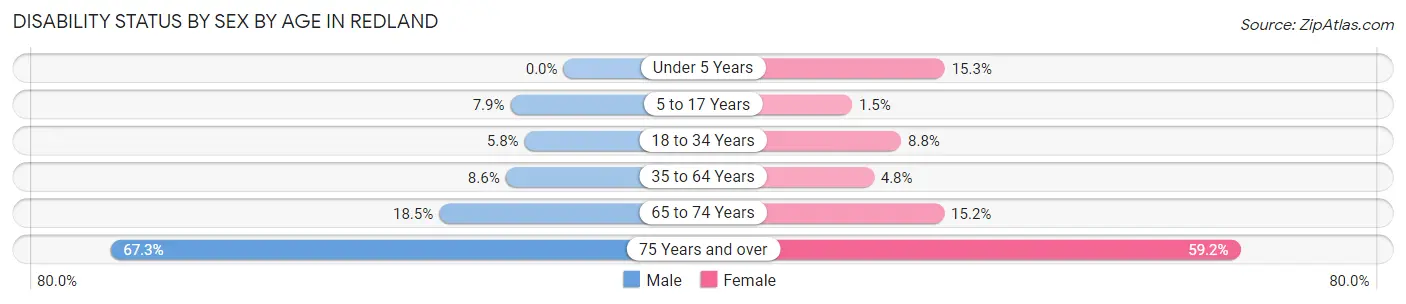
| Age Bracket | Male | Female |
| Under 5 Years | 0 (0.0%) | 65 (15.3%) |
| 5 to 17 Years | 108 (7.9%) | 23 (1.5%) |
| 18 to 34 Years | 113 (5.8%) | 140 (8.8%) |
| 35 to 64 Years | 295 (8.6%) | 195 (4.8%) |
| 65 to 74 Years | 163 (18.5%) | 149 (15.2%) |
| 75 Years and over | 337 (67.3%) | 397 (59.2%) |
Disability Class by Sex by Age in Redland
Disability Class: Hearing Difficulty
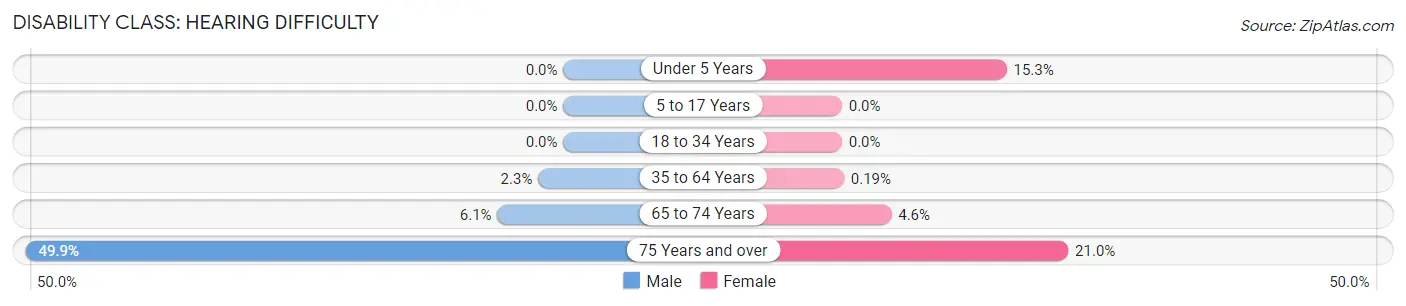
| Age Bracket | Male | Female |
| Under 5 Years | 0 (0.0%) | 65 (15.3%) |
| 5 to 17 Years | 0 (0.0%) | 0 (0.0%) |
| 18 to 34 Years | 0 (0.0%) | 0 (0.0%) |
| 35 to 64 Years | 80 (2.3%) | 8 (0.2%) |
| 65 to 74 Years | 54 (6.1%) | 45 (4.6%) |
| 75 Years and over | 250 (49.9%) | 141 (21.0%) |
Disability Class: Vision Difficulty
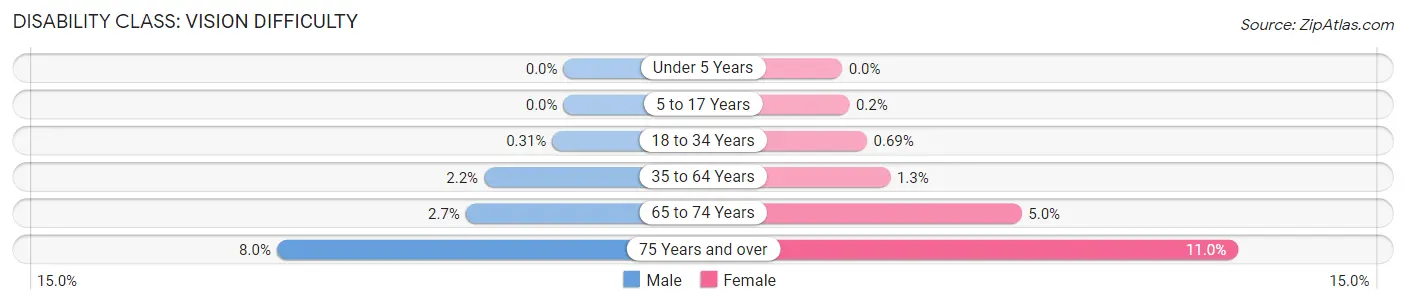
| Age Bracket | Male | Female |
| Under 5 Years | 0 (0.0%) | 0 (0.0%) |
| 5 to 17 Years | 0 (0.0%) | 3 (0.2%) |
| 18 to 34 Years | 6 (0.3%) | 11 (0.7%) |
| 35 to 64 Years | 76 (2.2%) | 55 (1.3%) |
| 65 to 74 Years | 24 (2.7%) | 49 (5.0%) |
| 75 Years and over | 40 (8.0%) | 74 (11.0%) |
Disability Class: Cognitive Difficulty
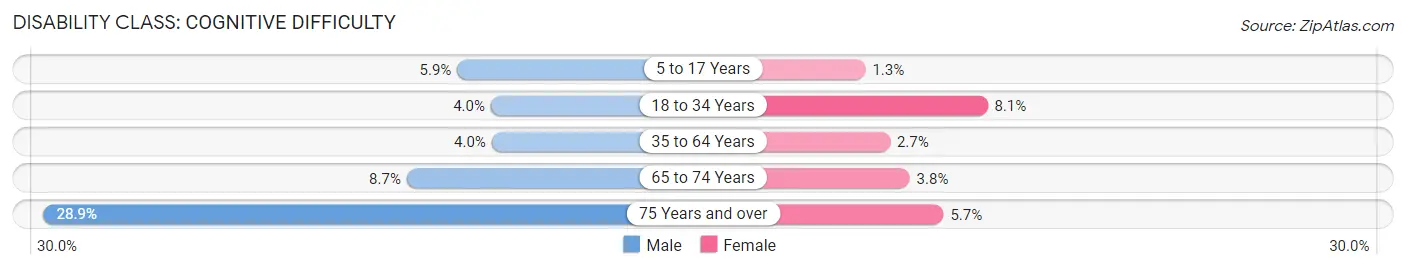
| Age Bracket | Male | Female |
| 5 to 17 Years | 81 (5.9%) | 20 (1.3%) |
| 18 to 34 Years | 79 (4.0%) | 129 (8.1%) |
| 35 to 64 Years | 137 (4.0%) | 110 (2.7%) |
| 65 to 74 Years | 77 (8.7%) | 37 (3.8%) |
| 75 Years and over | 145 (28.9%) | 38 (5.7%) |
Disability Class: Ambulatory Difficulty
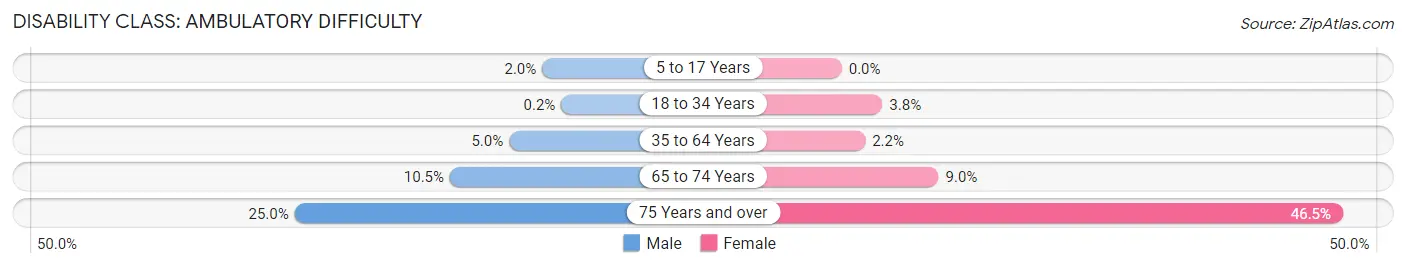
| Age Bracket | Male | Female |
| 5 to 17 Years | 27 (2.0%) | 0 (0.0%) |
| 18 to 34 Years | 4 (0.2%) | 60 (3.8%) |
| 35 to 64 Years | 173 (5.0%) | 89 (2.2%) |
| 65 to 74 Years | 93 (10.5%) | 88 (9.0%) |
| 75 Years and over | 125 (24.9%) | 312 (46.5%) |
Disability Class: Self-Care Difficulty
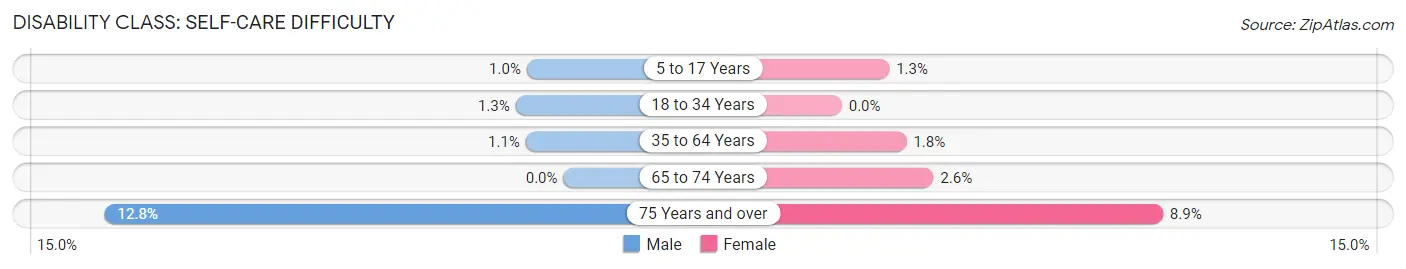
| Age Bracket | Male | Female |
| 5 to 17 Years | 14 (1.0%) | 20 (1.3%) |
| 18 to 34 Years | 26 (1.3%) | 0 (0.0%) |
| 35 to 64 Years | 36 (1.1%) | 74 (1.8%) |
| 65 to 74 Years | 0 (0.0%) | 25 (2.5%) |
| 75 Years and over | 64 (12.8%) | 60 (8.9%) |
Technology Access in Redland
Computing Device Access in Redland
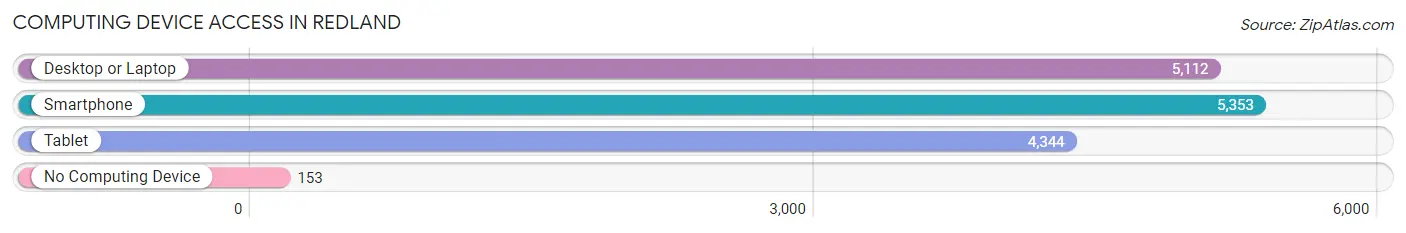
| Device Type | # Households | % Households |
| Desktop or Laptop | 5,112 | 89.4% |
| Smartphone | 5,353 | 93.6% |
| Tablet | 4,344 | 76.0% |
| No Computing Device | 153 | 2.7% |
| Total | 5,719 | 100.0% |
Internet Access in Redland
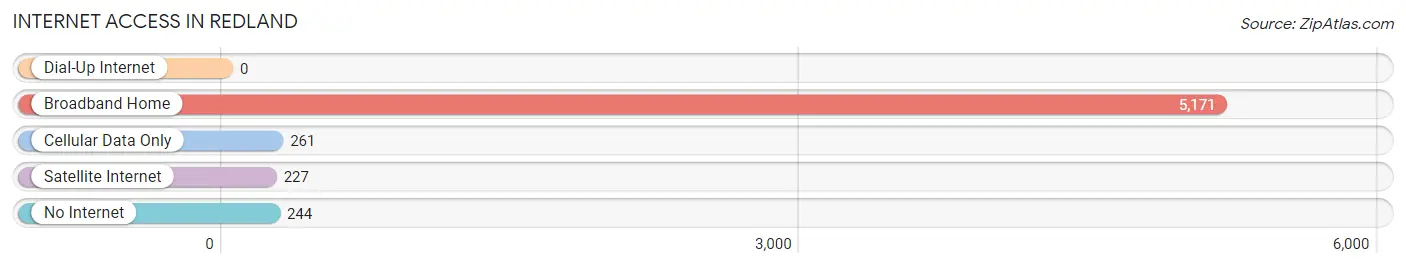
| Internet Type | # Households | % Households |
| Dial-Up Internet | 0 | 0.0% |
| Broadband Home | 5,171 | 90.4% |
| Cellular Data Only | 261 | 4.6% |
| Satellite Internet | 227 | 4.0% |
| No Internet | 244 | 4.3% |
| Total | 5,719 | 100.0% |
Redland Summary
Redland, Maryland is a small unincorporated community located in Montgomery County, Maryland. It is situated in the northern part of the county, just south of the city of Rockville. Redland is a rural area with a population of approximately 2,000 people.
History
The area now known as Redland was first settled in the late 1700s by German immigrants. The area was originally known as “Redland” due to the red clay soil found in the area. The area was primarily used for farming and the production of tobacco. In the early 1900s, the area began to develop into a residential community. The first post office was established in Redland in 1908.
Geography
Redland is located in the northern part of Montgomery County, Maryland. It is situated between the cities of Rockville and Gaithersburg. The area is primarily rural, with rolling hills and farmland. The area is also home to several small streams and creeks, including the Redland Run and the Redland Branch.
Economy
The economy of Redland is primarily based on agriculture. The area is home to several farms, which produce a variety of crops, including corn, soybeans, and hay. The area is also home to several small businesses, including a few restaurants, a gas station, and a few convenience stores.
Demographics
As of the 2010 census, the population of Redland was 2,000. The population is primarily white (90.2%), with a small percentage of African Americans (4.2%) and Hispanics (3.2%). The median household income in Redland is $90,000, and the median home value is $400,000.
Redland is a small, rural community with a rich history and a strong sense of community. The area is home to several farms and small businesses, and the population is primarily white. The area is a great place to live and work, and it is a great place to raise a family.
Common Questions
What is Per Capita Income in Redland?
Per Capita income in Redland is $47,640.
What is the Median Family Income in Redland?
Median Family Income in Redland is $130,273.
What is the Median Household income in Redland?
Median Household Income in Redland is $125,480.
What is Income or Wage Gap in Redland?
Income or Wage Gap in Redland is 19.4%.
Women in Redland earn 80.6 cents for every dollar earned by a man.
What is Family Income Deficit in Redland?
Family Income Deficit in Redland is $8,185.
Families that are below poverty line in Redland earn $8,185 less on average than the poverty threshold level.
What is Inequality or Gini Index in Redland?
Inequality or Gini Index in Redland is 0.38.
What is the Total Population of Redland?
Total Population of Redland is 18,346.
What is the Total Male Population of Redland?
Total Male Population of Redland is 9,045.
What is the Total Female Population of Redland?
Total Female Population of Redland is 9,301.
What is the Ratio of Males per 100 Females in Redland?
There are 97.25 Males per 100 Females in Redland.
What is the Ratio of Females per 100 Males in Redland?
There are 102.83 Females per 100 Males in Redland.
What is the Median Population Age in Redland?
Median Population Age in Redland is 40.4 Years.
What is the Average Family Size in Redland
Average Family Size in Redland is 3.5 People.
What is the Average Household Size in Redland
Average Household Size in Redland is 3.2 People.
How Large is the Labor Force in Redland?
There are 10,126 People in the Labor Forcein in Redland.
What is the Percentage of People in the Labor Force in Redland?
69.0% of People are in the Labor Force in Redland.
What is the Unemployment Rate in Redland?
Unemployment Rate in Redland is 4.0%.