Cities with the Youngest Population in the United States
RELATED REPORTS & OPTIONS
Youngest Population
United States
Compare Cities
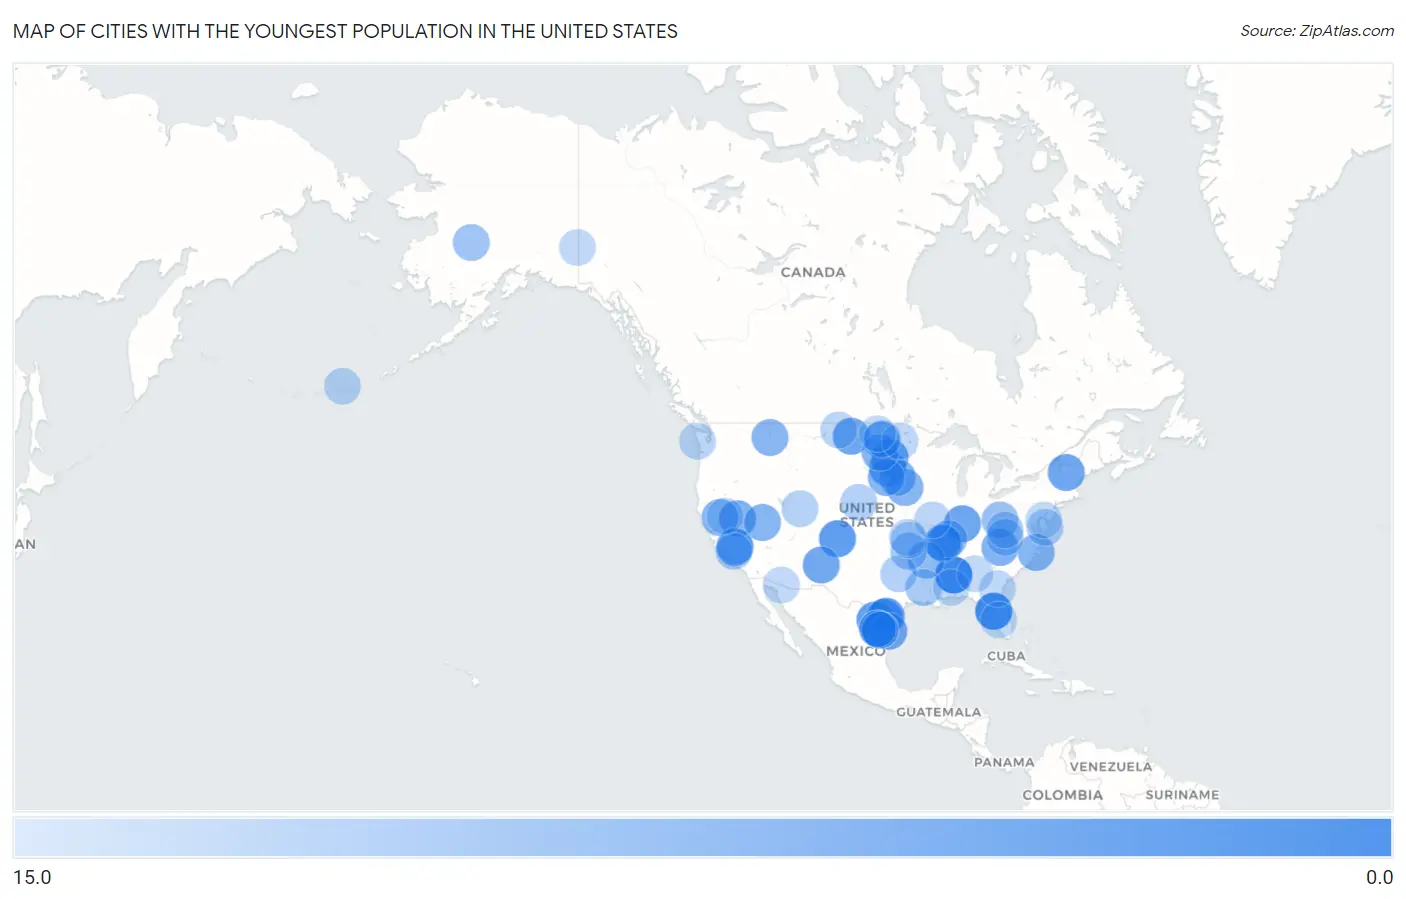
Map of Cities with the Youngest Population in the United States
15.0
0.0
Cities with the Youngest Population in the United States
| City | Median Age | vs State | vs National | |
| 1. | Panola | 3.8 | 39.3(-35.5)#1 | 38.5(-34.7)#1 |
| 2. | Ranchitos Del Norte | 4.0 | 35.2(-31.2)#1 | 38.5(-34.5)#2 |
| 3. | Bayport | 4.4 | 42.4(-38.0)#1 | 38.5(-34.1)#3 |
| 4. | Bethlehem | 4.6 | 38.1(-33.5)#1 | 38.5(-33.9)#4 |
| 5. | Prairie Hill | 5.0 | 38.8(-33.8)#1 | 38.5(-33.5)#5 |
| 6. | Shamrock Colony | 5.7 | 37.5(-31.8)#1 | 38.5(-32.8)#6 |
| 7. | Harding | 5.8 | 38.7(-32.9)#1 | 38.5(-32.7)#7 |
| 8. | North Lilbourn | 6.0 | 38.8(-32.8)#2 | 38.5(-32.5)#8 |
| 9. | Millbrook Colony | 6.5 | 37.5(-31.0)#2 | 38.5(-32.0)#9 |
| 10. | Valdez | 6.5 | 37.3(-30.8)#1 | 38.5(-32.0)#10 |
| 11. | Ranchitos East | 7.0 | 35.2(-28.2)#2 | 38.5(-31.5)#11 |
| 12. | Long Hollow | 7.2 | 37.5(-30.3)#3 | 38.5(-31.3)#12 |
| 13. | Owl Ranch | 7.2 | 35.2(-28.0)#3 | 38.5(-31.3)#13 |
| 14. | Mandaree | 7.6 | 35.4(-27.8)#1 | 38.5(-30.9)#14 |
| 15. | Raglesville | 7.6 | 38.0(-30.4)#1 | 38.5(-30.9)#15 |
| 16. | Sandy Hollow Escondidas | 7.7 | 35.2(-27.5)#4 | 38.5(-30.8)#16 |
| 17. | East Montpelier | 7.8 | 42.9(-35.1)#1 | 38.5(-30.7)#17 |
| 18. | Del Mar Heights | 7.9 | 35.2(-27.3)#5 | 38.5(-30.6)#18 |
| 19. | Polvadera | 8.0 | 38.6(-30.6)#1 | 38.5(-30.5)#19 |
| 20. | Depauw | 8.4 | 38.0(-29.6)#2 | 38.5(-30.1)#20 |
| 21. | Vienna | 8.5 | 37.5(-29.0)#4 | 38.5(-30.0)#21 |
| 22. | El Rancho | 8.5 | 37.3(-28.8)#1 | 38.5(-30.0)#22 |
| 23. | Fallon Station | 8.6 | 38.5(-29.9)#1 | 38.5(-29.9)#23 |
| 24. | Coffee Creek | 8.8 | 40.1(-31.3)#1 | 38.5(-29.7)#24 |
| 25. | Raymond | 8.9 | 42.6(-33.7)#1 | 38.5(-29.6)#25 |
| 26. | Valle Crucis | 9.0 | 39.1(-30.1)#1 | 38.5(-29.5)#26 |
| 27. | Sutton | 9.1 | 35.4(-26.3)#2 | 38.5(-29.4)#27 |
| 28. | Preston | 9.3 | 38.5(-29.2)#2 | 38.5(-29.2)#28 |
| 29. | Bloomfield | 9.3 | 38.7(-29.4)#2 | 38.5(-29.2)#29 |
| 30. | Pantego | 9.4 | 39.1(-29.7)#2 | 38.5(-29.1)#30 |
| 31. | Millwood | 9.4 | 37.2(-27.8)#1 | 38.5(-29.1)#31 |
| 32. | Truesdale | 9.5 | 38.4(-28.9)#1 | 38.5(-29.0)#32 |
| 33. | Kenneth | 9.5 | 38.5(-29.0)#1 | 38.5(-29.0)#33 |
| 34. | Farmer | 9.5 | 37.5(-28.0)#5 | 38.5(-29.0)#34 |
| 35. | Peppertown | 9.5 | 38.0(-28.5)#3 | 38.5(-29.0)#35 |
| 36. | Boggstown | 9.6 | 38.0(-28.4)#4 | 38.5(-28.9)#36 |
| 37. | Clipper Mills | 9.6 | 37.3(-27.7)#2 | 38.5(-28.9)#37 |
| 38. | Turtle Lake | 9.7 | 40.1(-30.4)#2 | 38.5(-28.8)#38 |
| 39. | Olmito And Olmito | 9.8 | 35.2(-25.4)#6 | 38.5(-28.7)#39 |
| 40. | Meacham | 9.8 | 39.9(-30.1)#1 | 38.5(-28.7)#40 |
| 41. | Monango | 9.8 | 35.4(-25.6)#3 | 38.5(-28.7)#41 |
| 42. | El Morro Valley | 9.9 | 38.6(-28.7)#2 | 38.5(-28.6)#42 |
| 43. | Bandana | 10.0 | 39.1(-29.1)#1 | 38.5(-28.5)#43 |
| 44. | Mcalmont | 10.1 | 38.4(-28.3)#1 | 38.5(-28.4)#44 |
| 45. | Lacey | 10.1 | 38.4(-28.3)#2 | 38.5(-28.4)#45 |
| 46. | Homer C Jones | 10.2 | 38.6(-28.4)#3 | 38.5(-28.3)#46 |
| 47. | Rimrock Colony | 10.5 | 40.1(-29.6)#3 | 38.5(-28.0)#47 |
| 48. | Brazos | 10.5 | 35.2(-24.7)#7 | 38.5(-28.0)#48 |
| 49. | Green Hills Borough | 10.5 | 40.8(-30.3)#1 | 38.5(-28.0)#49 |
| 50. | Hockingport | 10.9 | 39.6(-28.7)#1 | 38.5(-27.6)#50 |
| 51. | Roots | 11.1 | 40.8(-29.7)#2 | 38.5(-27.4)#51 |
| 52. | Canehill | 11.2 | 38.4(-27.2)#3 | 38.5(-27.3)#52 |
| 53. | North Escobares | 11.3 | 35.2(-23.9)#8 | 38.5(-27.2)#53 |
| 54. | Penermon | 11.5 | 38.8(-27.3)#3 | 38.5(-27.0)#54 |
| 55. | Grovespring | 11.5 | 38.8(-27.3)#4 | 38.5(-27.0)#55 |
| 56. | Takotna | 11.5 | 35.3(-23.8)#1 | 38.5(-27.0)#56 |
| 57. | Avard | 11.5 | 36.9(-25.4)#1 | 38.5(-27.0)#57 |
| 58. | Elm Grove | 11.6 | 36.9(-25.3)#2 | 38.5(-26.9)#58 |
| 59. | Oakvale | 11.8 | 42.6(-30.8)#2 | 38.5(-26.7)#59 |
| 60. | Umbarger | 11.8 | 35.2(-23.4)#9 | 38.5(-26.7)#60 |
| 61. | Tonyville | 11.9 | 37.3(-25.4)#3 | 38.5(-26.6)#61 |
| 62. | Creola | 11.9 | 37.6(-25.7)#1 | 38.5(-26.6)#62 |
| 63. | Mormon Lake | 11.9 | 38.4(-26.5)#1 | 38.5(-26.6)#63 |
| 64. | Cliftondale Park | 12.0 | 38.7(-26.7)#1 | 38.5(-26.5)#64 |
| 65. | Chesapeake Landing | 12.2 | 39.1(-26.9)#1 | 38.5(-26.3)#65 |
| 66. | Grayson | 12.3 | 38.8(-26.5)#5 | 38.5(-26.2)#66 |
| 67. | Parsonsburg | 12.4 | 39.1(-26.7)#2 | 38.5(-26.1)#67 |
| 68. | Rodriguez Camp | 12.5 | 37.3(-24.8)#4 | 38.5(-26.0)#68 |
| 69. | Lyons | 12.6 | 35.2(-22.6)#10 | 38.5(-25.9)#69 |
| 70. | Canon | 12.6 | 38.6(-26.0)#4 | 38.5(-25.9)#70 |
| 71. | Hico | 12.7 | 42.6(-29.9)#3 | 38.5(-25.8)#71 |
| 72. | Neylandville | 12.8 | 35.2(-22.4)#11 | 38.5(-25.7)#72 |
| 73. | Roscoe | 12.9 | 36.9(-24.0)#1 | 38.5(-25.6)#73 |
| 74. | Whiterocks | 13.0 | 31.4(-18.4)#1 | 38.5(-25.5)#74 |
| 75. | Alden | 13.2 | 38.7(-25.5)#3 | 38.5(-25.3)#75 |
| 76. | Weir | 13.3 | 37.1(-23.8)#1 | 38.5(-25.2)#76 |
| 77. | Twelve Mile | 13.3 | 38.0(-24.7)#5 | 38.5(-25.2)#77 |
| 78. | Jessie | 13.4 | 35.4(-22.0)#4 | 38.5(-25.1)#78 |
| 79. | Froid | 13.5 | 40.1(-26.6)#4 | 38.5(-25.0)#79 |
| 80. | Swift Bird | 13.5 | 37.5(-24.0)#6 | 38.5(-25.0)#80 |
| 81. | Shoal Creek Estates | 13.5 | 38.8(-25.3)#6 | 38.5(-25.0)#81 |
| 82. | St Clement | 13.5 | 38.8(-25.3)#7 | 38.5(-25.0)#82 |
| 83. | Qui Nai Elt Village | 13.5 | 38.0(-24.5)#1 | 38.5(-25.0)#83 |
| 84. | Atka | 13.5 | 35.3(-21.8)#2 | 38.5(-25.0)#84 |
| 85. | Offerman | 13.6 | 37.2(-23.6)#2 | 38.5(-24.9)#85 |
| 86. | Rio | 13.6 | 37.6(-24.0)#2 | 38.5(-24.9)#86 |
| 87. | Barrera | 13.7 | 35.2(-21.5)#12 | 38.5(-24.8)#87 |
| 88. | Quesada | 13.7 | 35.2(-21.5)#13 | 38.5(-24.8)#88 |
| 89. | Midway | 13.7 | 38.5(-24.8)#2 | 38.5(-24.8)#89 |
| 90. | Buckatunna | 13.8 | 38.1(-24.3)#2 | 38.5(-24.7)#90 |
| 91. | Ali Chuk | 13.8 | 38.4(-24.6)#2 | 38.5(-24.7)#91 |
| 92. | Calpine | 13.8 | 37.3(-23.5)#5 | 38.5(-24.7)#92 |
| 93. | Standing Rock | 13.8 | 39.3(-25.5)#2 | 38.5(-24.7)#93 |
| 94. | Sicangu | 13.9 | 37.5(-23.6)#7 | 38.5(-24.6)#94 |
| 95. | Alcan Border | 13.9 | 35.3(-21.4)#3 | 38.5(-24.6)#95 |
| 96. | Lamington | 14.0 | 40.0(-26.0)#1 | 38.5(-24.5)#96 |
| 97. | Fort Totten | 14.1 | 35.4(-21.3)#5 | 38.5(-24.4)#97 |
| 98. | Fort Green Springs | 14.1 | 42.4(-28.3)#2 | 38.5(-24.4)#98 |
| 99. | Kenton | 14.1 | 41.4(-27.3)#1 | 38.5(-24.4)#99 |
| 100. | Hilltop Cdp Starr County | 14.2 | 35.2(-21.0)#14 | 38.5(-24.3)#100 |
Common Questions
What are the Top 10 Cities with the Youngest Population in the United States?
Top 10 Cities with the Youngest Population in the United States are:
#1
3.8
#2
4.0
#3
4.4
#4
6.0
#5
6.5
#6
7.0
#7
7.2
#8
7.2
#9
7.6
#10
7.6
What city has the Youngest Population in the United States?
Panola has the Youngest Population in the United States with 3.8.
What is the Median Age in the United States?
Median Age in the United States is 38.5.