Cities with the Largest Assyrian / Chaldean / Syriac Community in the United States
RELATED REPORTS & OPTIONS
Assyrian / Chaldean / Syriac
United States
Compare Cities
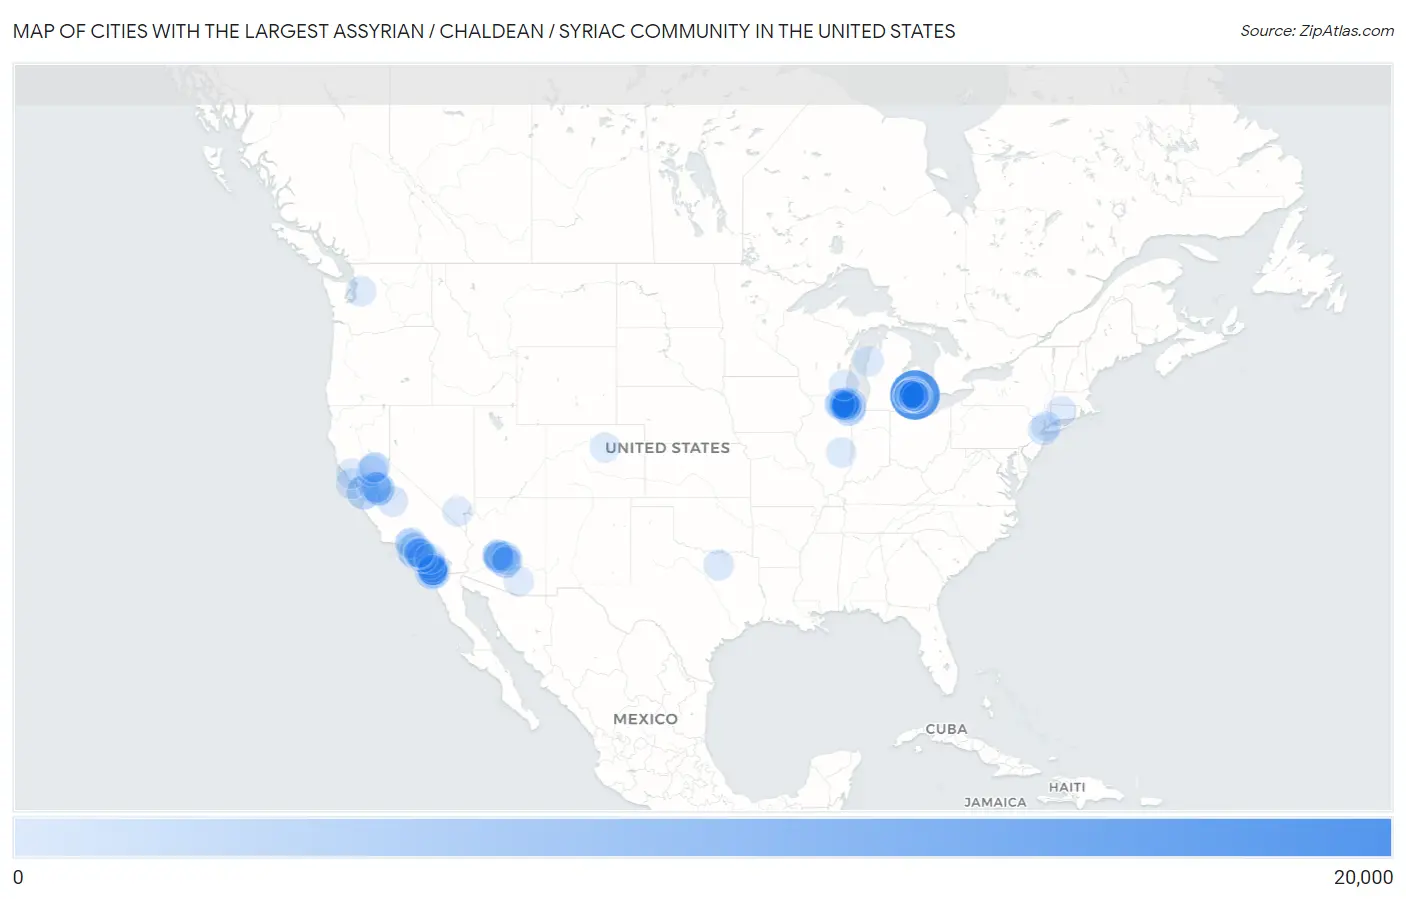
Map of Cities with the Largest Assyrian / Chaldean / Syriac Community in the United States
0
20,000
Cities with the Largest Assyrian / Chaldean / Syriac Community in the United States
| City | Assyrian / Chaldean / Syriac | vs State | vs National | |
| 1. | Sterling Heights | 15,378 | 42,050(36.57%)#1 | 96,423(15.95%)#1 |
| 2. | El Cajon | 4,542 | 26,497(17.14%)#1 | 96,423(4.71%)#2 |
| 3. | Skokie | 3,674 | 14,802(24.82%)#1 | 96,423(3.81%)#3 |
| 4. | Turlock | 3,191 | 26,497(12.04%)#2 | 96,423(3.31%)#4 |
| 5. | San Jose | 3,018 | 26,497(11.39%)#3 | 96,423(3.13%)#5 |
| 6. | Chicago | 3,009 | 14,802(20.33%)#2 | 96,423(3.12%)#6 |
| 7. | Warren | 2,593 | 42,050(6.17%)#2 | 96,423(2.69%)#7 |
| 8. | Modesto | 1,977 | 26,497(7.46%)#4 | 96,423(2.05%)#8 |
| 9. | Farmington Hills | 1,821 | 42,050(4.33%)#3 | 96,423(1.89%)#9 |
| 10. | Los Angeles | 1,593 | 26,497(6.01%)#5 | 96,423(1.65%)#10 |
| 11. | Phoenix | 1,481 | 4,862(30.46%)#1 | 96,423(1.54%)#11 |
| 12. | Rochester Hills | 1,018 | 42,050(2.42%)#4 | 96,423(1.06%)#12 |
| 13. | Rancho San Diego | 960 | 26,497(3.62%)#6 | 96,423(1.00%)#13 |
| 14. | Novi | 955 | 42,050(2.27%)#5 | 96,423(0.99%)#14 |
| 15. | Glendale | 809 | 4,862(16.64%)#2 | 96,423(0.84%)#15 |
| 16. | Niles | 785 | 14,802(5.30%)#3 | 96,423(0.81%)#16 |
| 17. | Troy | 714 | 42,050(1.70%)#6 | 96,423(0.74%)#17 |
| 18. | Madison Heights | 701 | 42,050(1.67%)#7 | 96,423(0.73%)#18 |
| 19. | San Diego | 671 | 26,497(2.53%)#7 | 96,423(0.70%)#19 |
| 20. | Morton Grove | 667 | 14,802(4.51%)#4 | 96,423(0.69%)#20 |
| 21. | Jamul | 662 | 26,497(2.50%)#8 | 96,423(0.69%)#21 |
| 22. | Lincolnwood | 658 | 14,802(4.45%)#5 | 96,423(0.68%)#22 |
| 23. | Peoria | 629 | 4,862(12.94%)#3 | 96,423(0.65%)#23 |
| 24. | Mount Prospect | 518 | 14,802(3.50%)#6 | 96,423(0.54%)#24 |
| 25. | Fresno | 497 | 26,497(1.88%)#9 | 96,423(0.52%)#25 |
| 26. | Southfield | 473 | 42,050(1.12%)#8 | 96,423(0.49%)#26 |
| 27. | Chandler | 470 | 4,862(9.67%)#4 | 96,423(0.49%)#27 |
| 28. | San Francisco | 463 | 26,497(1.75%)#10 | 96,423(0.48%)#28 |
| 29. | Hoffman Estates | 450 | 14,802(3.04%)#7 | 96,423(0.47%)#29 |
| 30. | Granite Hills | 401 | 26,497(1.51%)#11 | 96,423(0.42%)#30 |
| 31. | Glenview | 365 | 14,802(2.47%)#8 | 96,423(0.38%)#31 |
| 32. | Santa Clarita | 307 | 26,497(1.16%)#12 | 96,423(0.32%)#32 |
| 33. | Roselle | 299 | 14,802(2.02%)#9 | 96,423(0.31%)#33 |
| 34. | Frisco | 297 | 1,029(28.86%)#1 | 96,423(0.31%)#34 |
| 35. | Lakeside | 295 | 26,497(1.11%)#13 | 96,423(0.31%)#35 |
| 36. | Bostonia | 284 | 26,497(1.07%)#14 | 96,423(0.29%)#36 |
| 37. | La Presa | 279 | 26,497(1.05%)#15 | 96,423(0.29%)#37 |
| 38. | Gilbert | 274 | 4,862(5.64%)#5 | 96,423(0.28%)#38 |
| 39. | Surprise | 263 | 4,862(5.41%)#6 | 96,423(0.27%)#39 |
| 40. | Des Plaines | 256 | 14,802(1.73%)#10 | 96,423(0.27%)#40 |
| 41. | Fraser | 239 | 42,050(0.57%)#9 | 96,423(0.25%)#41 |
| 42. | Bloomfield Hills | 227 | 42,050(0.54%)#10 | 96,423(0.24%)#42 |
| 43. | Arlington Heights | 218 | 14,802(1.47%)#11 | 96,423(0.23%)#43 |
| 44. | Scottsdale | 216 | 4,862(4.44%)#7 | 96,423(0.22%)#44 |
| 45. | New York | 209 | 590(35.42%)#1 | 96,423(0.22%)#45 |
| 46. | Oak Park | 208 | 42,050(0.49%)#11 | 96,423(0.22%)#46 |
| 47. | Lomita | 208 | 26,497(0.78%)#16 | 96,423(0.22%)#47 |
| 48. | Park Ridge | 206 | 14,802(1.39%)#12 | 96,423(0.21%)#48 |
| 49. | Spring Valley Cdp San Diego County | 205 | 26,497(0.77%)#17 | 96,423(0.21%)#49 |
| 50. | Union Hill Novelty Hill | 200 | 420(47.62%)#1 | 96,423(0.21%)#50 |
| 51. | Delhi | 192 | 26,497(0.72%)#18 | 96,423(0.20%)#51 |
| 52. | Rohnert Park | 187 | 26,497(0.71%)#19 | 96,423(0.19%)#52 |
| 53. | Augusta-Richmond County Consolidated Government (Balance) | 173 | 360(48.06%)#1 | 96,423(0.18%)#53 |
| 54. | Hazel Park | 173 | 42,050(0.41%)#12 | 96,423(0.18%)#54 |
| 55. | Casa De Oro Mount Helix | 167 | 26,497(0.63%)#20 | 96,423(0.17%)#55 |
| 56. | Hidden Meadows | 160 | 26,497(0.60%)#21 | 96,423(0.17%)#56 |
| 57. | Elgin | 158 | 14,802(1.07%)#13 | 96,423(0.16%)#57 |
| 58. | Tucson | 153 | 4,862(3.15%)#8 | 96,423(0.16%)#58 |
| 59. | Royal Oak | 149 | 42,050(0.35%)#13 | 96,423(0.15%)#59 |
| 60. | El Mirage | 149 | 4,862(3.06%)#9 | 96,423(0.15%)#60 |
| 61. | Orchard Lake Village | 148 | 42,050(0.35%)#14 | 96,423(0.15%)#61 |
| 62. | Elk Grove Village | 147 | 14,802(0.99%)#14 | 96,423(0.15%)#62 |
| 63. | Vineyard | 143 | 26,497(0.54%)#22 | 96,423(0.15%)#63 |
| 64. | New Britain | 142 | 394(36.04%)#1 | 96,423(0.15%)#64 |
| 65. | Las Vegas | 137 | 427(32.08%)#1 | 96,423(0.14%)#65 |
| 66. | Glendale | 137 | 26,497(0.52%)#23 | 96,423(0.14%)#66 |
| 67. | Walled Lake | 137 | 42,050(0.33%)#15 | 96,423(0.14%)#67 |
| 68. | Manistee | 137 | 42,050(0.33%)#16 | 96,423(0.14%)#68 |
| 69. | Yonkers | 133 | 590(22.54%)#2 | 96,423(0.14%)#69 |
| 70. | Northbrook | 127 | 14,802(0.86%)#15 | 96,423(0.13%)#70 |
| 71. | Auburn Hills | 125 | 42,050(0.30%)#17 | 96,423(0.13%)#71 |
| 72. | Franklin Park | 119 | 14,802(0.80%)#16 | 96,423(0.12%)#72 |
| 73. | El Dorado Hills | 118 | 26,497(0.45%)#24 | 96,423(0.12%)#73 |
| 74. | Folsom | 117 | 26,497(0.44%)#25 | 96,423(0.12%)#74 |
| 75. | Buffalo Grove | 115 | 14,802(0.78%)#17 | 96,423(0.12%)#75 |
| 76. | Aliso Viejo | 113 | 26,497(0.43%)#26 | 96,423(0.12%)#76 |
| 77. | Poway | 113 | 26,497(0.43%)#27 | 96,423(0.12%)#77 |
| 78. | Gilberts | 111 | 14,802(0.75%)#18 | 96,423(0.12%)#78 |
| 79. | Rosemont | 110 | 14,802(0.74%)#19 | 96,423(0.11%)#79 |
| 80. | Mesa | 108 | 4,862(2.22%)#10 | 96,423(0.11%)#80 |
| 81. | Mission Viejo | 106 | 26,497(0.40%)#28 | 96,423(0.11%)#81 |
| 82. | Villa Park | 106 | 26,497(0.40%)#29 | 96,423(0.11%)#82 |
| 83. | Keego Harbor | 105 | 42,050(0.25%)#18 | 96,423(0.11%)#83 |
| 84. | Anaheim | 104 | 26,497(0.39%)#30 | 96,423(0.11%)#84 |
| 85. | Stevenson Ranch | 103 | 26,497(0.39%)#31 | 96,423(0.11%)#85 |
| 86. | Steiner Ranch | 101 | 1,029(9.82%)#2 | 96,423(0.10%)#86 |
| 87. | Garden Grove | 98 | 26,497(0.37%)#32 | 96,423(0.10%)#87 |
| 88. | Schaumburg | 98 | 14,802(0.66%)#20 | 96,423(0.10%)#88 |
| 89. | Wixom | 98 | 42,050(0.23%)#19 | 96,423(0.10%)#89 |
| 90. | Grosse Pointe Woods | 98 | 42,050(0.23%)#20 | 96,423(0.10%)#90 |
| 91. | Denver | 96 | 214(44.86%)#1 | 96,423(0.10%)#91 |
| 92. | Fullerton | 96 | 26,497(0.36%)#33 | 96,423(0.10%)#92 |
| 93. | Santee | 94 | 26,497(0.35%)#34 | 96,423(0.10%)#93 |
| 94. | Ferndale | 94 | 42,050(0.22%)#21 | 96,423(0.10%)#94 |
| 95. | Utica | 94 | 42,050(0.22%)#22 | 96,423(0.10%)#95 |
| 96. | Charleston | 93 | 14,802(0.63%)#21 | 96,423(0.10%)#96 |
| 97. | New Milford Borough | 93 | 658(14.13%)#1 | 96,423(0.10%)#97 |
| 98. | Ceres | 92 | 26,497(0.35%)#35 | 96,423(0.10%)#98 |
| 99. | Temecula | 91 | 26,497(0.34%)#36 | 96,423(0.09%)#99 |
| 100. | Wauwatosa | 91 | 203(44.83%)#1 | 96,423(0.09%)#100 |
Common Questions
What are the Top 10 Cities with the Largest Assyrian / Chaldean / Syriac Community in the United States?
Top 10 Cities with the Largest Assyrian / Chaldean / Syriac Community in the United States are:
What city has the Largest Assyrian / Chaldean / Syriac Community in the United States?
Sterling Heights has the Largest Assyrian / Chaldean / Syriac Community in the United States with 15,378.
What is the Total Assyrian / Chaldean / Syriac Population in the United States?
Total Assyrian / Chaldean / Syriac Population in the United States is 96,423.