Cities with the Largest Nigerian Community in the United States
RELATED REPORTS & OPTIONS
Nigerian
United States
Compare Cities
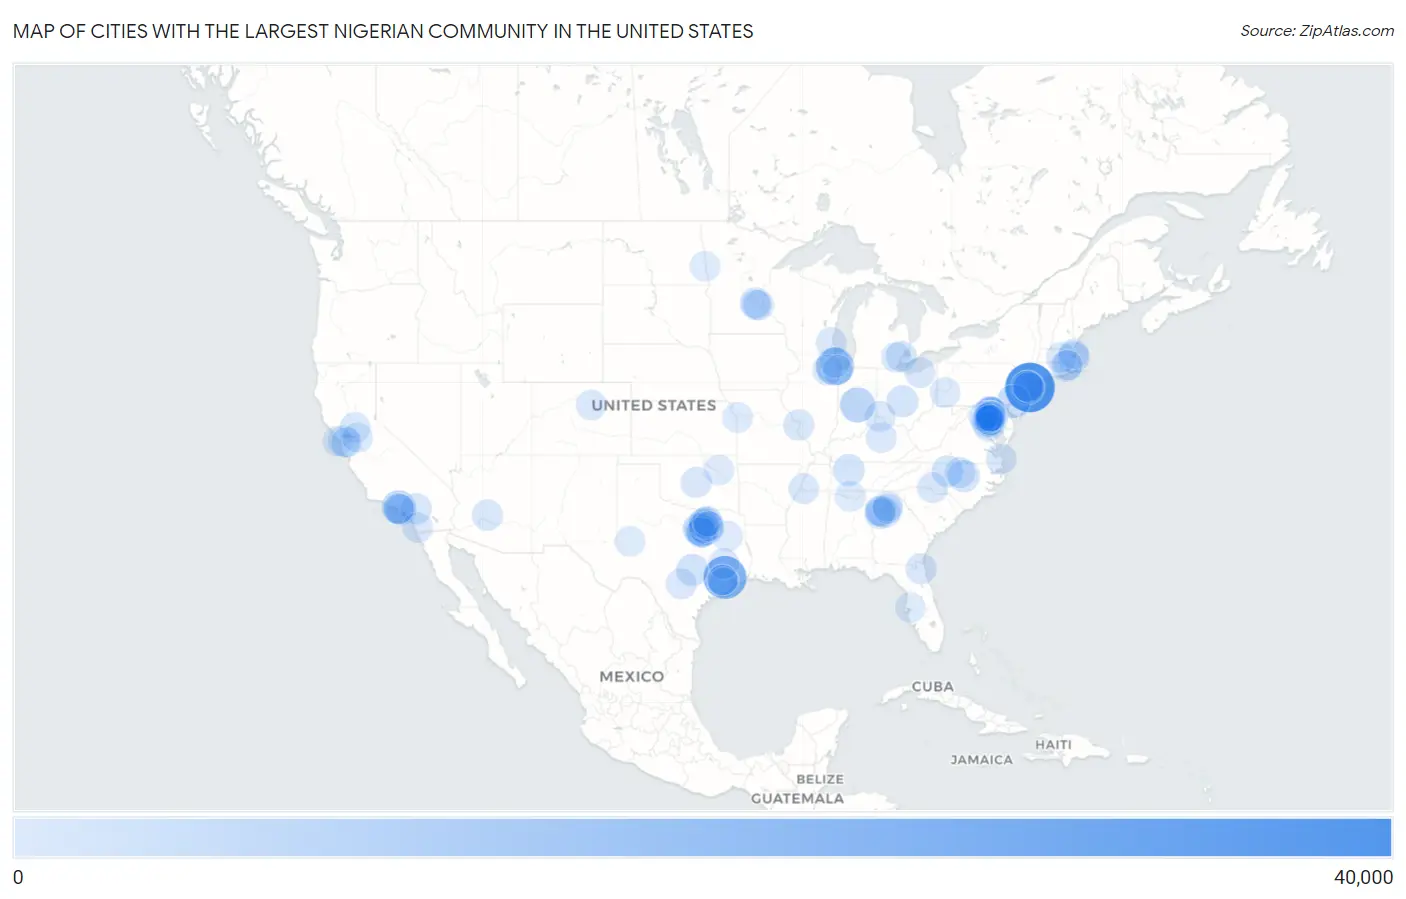
Map of Cities with the Largest Nigerian Community in the United States
0
40,000
Cities with the Largest Nigerian Community in the United States
| City | Nigerian | vs State | vs National | |
| 1. | New York | 32,338 | 45,698(70.76%)#1 | 581,853(5.56%)#1 |
| 2. | Houston | 21,167 | 113,765(18.61%)#1 | 581,853(3.64%)#2 |
| 3. | Chicago | 13,009 | 28,390(45.82%)#1 | 581,853(2.24%)#3 |
| 4. | Indianapolis | 7,885 | 13,662(57.71%)#1 | 581,853(1.36%)#4 |
| 5. | Dallas | 7,230 | 113,765(6.36%)#2 | 581,853(1.24%)#5 |
| 6. | Los Angeles | 6,804 | 53,027(12.83%)#1 | 581,853(1.17%)#6 |
| 7. | Newark | 6,672 | 32,837(20.32%)#1 | 581,853(1.15%)#7 |
| 8. | Philadelphia | 5,746 | 15,202(37.80%)#1 | 581,853(0.99%)#8 |
| 9. | Arlington | 4,521 | 113,765(3.97%)#3 | 581,853(0.78%)#9 |
| 10. | Baltimore | 4,512 | 56,370(8.00%)#1 | 581,853(0.78%)#10 |
| 11. | Washington | 4,069 | 4,069(100.00%)#1 | 581,853(0.70%)#11 |
| 12. | Austin | 3,233 | 113,765(2.84%)#4 | 581,853(0.56%)#12 |
| 13. | Boston | 3,193 | 13,473(23.70%)#1 | 581,853(0.55%)#13 |
| 14. | Fort Worth | 3,169 | 113,765(2.79%)#5 | 581,853(0.54%)#14 |
| 15. | Columbus | 3,090 | 12,972(23.82%)#1 | 581,853(0.53%)#15 |
| 16. | Raleigh | 3,017 | 15,875(19.00%)#1 | 581,853(0.52%)#16 |
| 17. | Grand Prairie | 2,996 | 113,765(2.63%)#6 | 581,853(0.51%)#17 |
| 18. | Nashville | 2,896 | 8,481(34.15%)#1 | 581,853(0.50%)#18 |
| 19. | Greensboro | 2,684 | 15,875(16.91%)#2 | 581,853(0.46%)#19 |
| 20. | Oakland | 2,513 | 53,027(4.74%)#2 | 581,853(0.43%)#20 |
| 21. | Providence | 2,303 | 4,462(51.61%)#1 | 581,853(0.40%)#21 |
| 22. | Bowie | 2,159 | 56,370(3.83%)#2 | 581,853(0.37%)#22 |
| 23. | Mission Bend | 2,108 | 113,765(1.85%)#7 | 581,853(0.36%)#23 |
| 24. | Moreno Valley | 2,011 | 53,027(3.79%)#3 | 581,853(0.35%)#24 |
| 25. | Frisco | 1,990 | 113,765(1.75%)#8 | 581,853(0.34%)#25 |
| 26. | Redan | 1,826 | 39,468(4.63%)#1 | 581,853(0.31%)#26 |
| 27. | Jacksonville | 1,819 | 18,263(9.96%)#1 | 581,853(0.31%)#27 |
| 28. | East Orange | 1,805 | 32,837(5.50%)#2 | 581,853(0.31%)#28 |
| 29. | Detroit | 1,776 | 10,457(16.98%)#1 | 581,853(0.31%)#29 |
| 30. | Phoenix | 1,767 | 5,848(30.22%)#1 | 581,853(0.30%)#30 |
| 31. | St Louis | 1,763 | 6,478(27.22%)#1 | 581,853(0.30%)#31 |
| 32. | Milford Mill | 1,697 | 56,370(3.01%)#3 | 581,853(0.29%)#32 |
| 33. | Carson | 1,686 | 53,027(3.18%)#4 | 581,853(0.29%)#33 |
| 34. | Atlanta | 1,629 | 39,468(4.13%)#2 | 581,853(0.28%)#34 |
| 35. | Largo | 1,628 | 56,370(2.89%)#4 | 581,853(0.28%)#35 |
| 36. | Oklahoma City | 1,622 | 4,215(38.48%)#1 | 581,853(0.28%)#36 |
| 37. | Charlotte | 1,606 | 15,875(10.12%)#3 | 581,853(0.28%)#37 |
| 38. | Randallstown | 1,581 | 56,370(2.80%)#5 | 581,853(0.27%)#38 |
| 39. | Durham | 1,541 | 15,875(9.71%)#4 | 581,853(0.26%)#39 |
| 40. | San Antonio | 1,513 | 113,765(1.33%)#9 | 581,853(0.26%)#40 |
| 41. | Huntsville | 1,470 | 113,765(1.29%)#10 | 581,853(0.25%)#41 |
| 42. | Columbia | 1,454 | 56,370(2.58%)#6 | 581,853(0.25%)#42 |
| 43. | Irving | 1,434 | 113,765(1.26%)#11 | 581,853(0.25%)#43 |
| 44. | Milwaukee | 1,368 | 3,945(34.68%)#1 | 581,853(0.24%)#44 |
| 45. | Hawthorne | 1,239 | 53,027(2.34%)#5 | 581,853(0.21%)#45 |
| 46. | San Diego | 1,223 | 53,027(2.31%)#6 | 581,853(0.21%)#46 |
| 47. | Owings Mills | 1,220 | 56,370(2.16%)#7 | 581,853(0.21%)#47 |
| 48. | Landover | 1,206 | 56,370(2.14%)#8 | 581,853(0.21%)#48 |
| 49. | Brooklyn Park | 1,181 | 9,917(11.91%)#1 | 581,853(0.20%)#49 |
| 50. | Denver | 1,158 | 4,338(26.69%)#1 | 581,853(0.20%)#50 |
| 51. | Inglewood | 1,147 | 53,027(2.16%)#7 | 581,853(0.20%)#51 |
| 52. | Elkridge | 1,130 | 56,370(2.00%)#9 | 581,853(0.19%)#52 |
| 53. | Virginia Beach | 1,124 | 11,631(9.66%)#1 | 581,853(0.19%)#53 |
| 54. | Cincinnati | 1,124 | 12,972(8.66%)#2 | 581,853(0.19%)#54 |
| 55. | Plainfield | 1,115 | 28,390(3.93%)#2 | 581,853(0.19%)#55 |
| 56. | Jersey City | 1,113 | 32,837(3.39%)#3 | 581,853(0.19%)#56 |
| 57. | Lexington | 1,107 | 2,503(44.23%)#1 | 581,853(0.19%)#57 |
| 58. | Memphis | 1,071 | 8,481(12.63%)#2 | 581,853(0.18%)#58 |
| 59. | Lewisville | 1,069 | 113,765(0.94%)#12 | 581,853(0.18%)#59 |
| 60. | St Paul | 1,067 | 9,917(10.76%)#2 | 581,853(0.18%)#60 |
| 61. | South Fulton | 1,062 | 39,468(2.69%)#3 | 581,853(0.18%)#61 |
| 62. | Waldorf | 1,060 | 56,370(1.88%)#10 | 581,853(0.18%)#62 |
| 63. | Summerfield | 1,054 | 56,370(1.87%)#11 | 581,853(0.18%)#63 |
| 64. | Cleveland | 1,045 | 12,972(8.06%)#3 | 581,853(0.18%)#64 |
| 65. | Sacramento | 1,038 | 53,027(1.96%)#8 | 581,853(0.18%)#65 |
| 66. | South Laurel | 1,034 | 56,370(1.83%)#12 | 581,853(0.18%)#66 |
| 67. | Worcester | 1,026 | 13,473(7.62%)#2 | 581,853(0.18%)#67 |
| 68. | Vauxhall | 1,008 | 32,837(3.07%)#4 | 581,853(0.17%)#68 |
| 69. | San Francisco | 1,007 | 53,027(1.90%)#9 | 581,853(0.17%)#69 |
| 70. | Missouri City | 1,004 | 113,765(0.88%)#13 | 581,853(0.17%)#70 |
| 71. | Pittsburgh | 973 | 15,202(6.40%)#2 | 581,853(0.17%)#71 |
| 72. | Mansfield | 968 | 113,765(0.85%)#14 | 581,853(0.17%)#72 |
| 73. | Midland | 964 | 113,765(0.85%)#15 | 581,853(0.17%)#73 |
| 74. | Severn | 950 | 56,370(1.69%)#13 | 581,853(0.16%)#74 |
| 75. | Tyler | 948 | 113,765(0.83%)#16 | 581,853(0.16%)#75 |
| 76. | Tulsa | 937 | 4,215(22.23%)#2 | 581,853(0.16%)#76 |
| 77. | Castro Valley | 934 | 53,027(1.76%)#10 | 581,853(0.16%)#77 |
| 78. | Stockton | 923 | 53,027(1.74%)#11 | 581,853(0.16%)#78 |
| 79. | Kansas City | 921 | 6,478(14.22%)#2 | 581,853(0.16%)#79 |
| 80. | Germantown | 918 | 56,370(1.63%)#14 | 581,853(0.16%)#80 |
| 81. | Huntsville | 888 | 4,075(21.79%)#1 | 581,853(0.15%)#81 |
| 82. | Mckinney | 887 | 113,765(0.78%)#17 | 581,853(0.15%)#82 |
| 83. | Westland | 878 | 10,457(8.40%)#2 | 581,853(0.15%)#83 |
| 84. | Skokie | 867 | 28,390(3.05%)#3 | 581,853(0.15%)#84 |
| 85. | Lynn | 857 | 13,473(6.36%)#3 | 581,853(0.15%)#85 |
| 86. | Minneapolis | 852 | 9,917(8.59%)#3 | 581,853(0.15%)#86 |
| 87. | Calumet City | 845 | 28,390(2.98%)#4 | 581,853(0.15%)#87 |
| 88. | Pawtucket | 834 | 4,462(18.69%)#2 | 581,853(0.14%)#88 |
| 89. | Garland | 828 | 113,765(0.73%)#18 | 581,853(0.14%)#89 |
| 90. | Tampa | 824 | 18,263(4.51%)#2 | 581,853(0.14%)#90 |
| 91. | Laurel | 823 | 56,370(1.46%)#15 | 581,853(0.14%)#91 |
| 92. | Sugar Hill | 819 | 39,468(2.08%)#4 | 581,853(0.14%)#92 |
| 93. | Fargo | 817 | 1,322(61.80%)#1 | 581,853(0.14%)#93 |
| 94. | Silver Spring | 800 | 56,370(1.42%)#16 | 581,853(0.14%)#94 |
| 95. | Mableton | 787 | 39,468(1.99%)#5 | 581,853(0.14%)#95 |
| 96. | Four Corners | 777 | 113,765(0.68%)#19 | 581,853(0.13%)#96 |
| 97. | North Laurel | 763 | 56,370(1.35%)#17 | 581,853(0.13%)#97 |
| 98. | Lawrenceville | 755 | 39,468(1.91%)#6 | 581,853(0.13%)#98 |
| 99. | Glenn Dale | 753 | 56,370(1.34%)#18 | 581,853(0.13%)#99 |
| 100. | Sicklerville | 748 | 32,837(2.28%)#5 | 581,853(0.13%)#100 |
Common Questions
What are the Top 10 Cities with the Largest Nigerian Community in the United States?
Top 10 Cities with the Largest Nigerian Community in the United States are:
What city has the Largest Nigerian Community in the United States?
New York has the Largest Nigerian Community in the United States with 32,338.
What is the Total Nigerian Population in the United States?
Total Nigerian Population in the United States is 581,853.