Cities with the Highest Percentage of Yakama Population in the United States
RELATED REPORTS & OPTIONS
Yakama
United States
Compare Cities
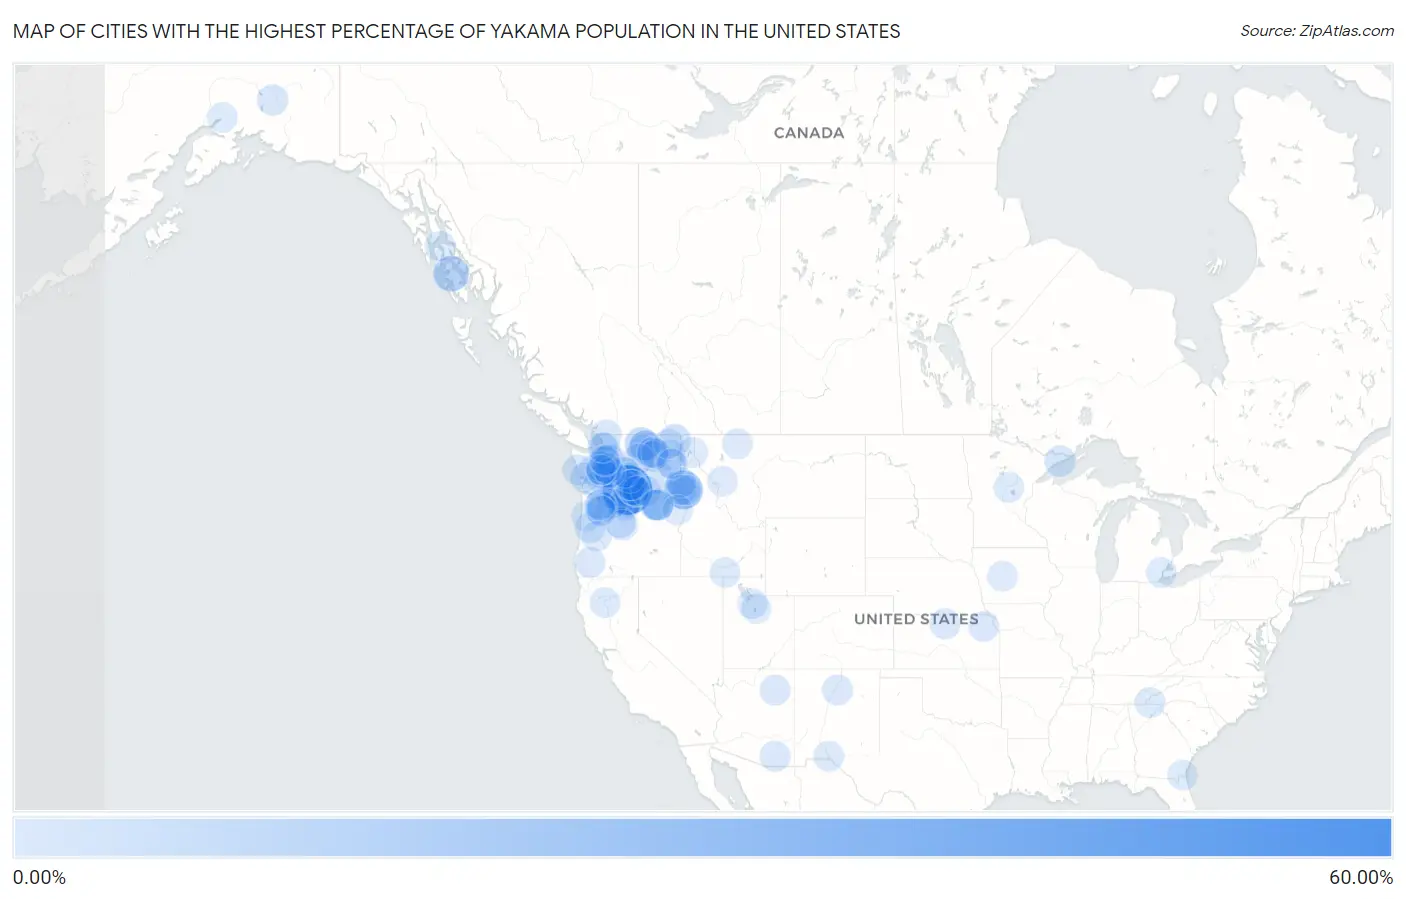
Map of Cities with the Highest Percentage of Yakama Population in the United States
0.00%
60.00%
Cities with the Highest Percentage of Yakama Population in the United States
| City | Yakama | vs State | vs National | |
| 1. | White Swan | 56.51% | 0.11%(+56.4)#1 | 0.0034%(+56.5)#1 |
| 2. | Sweetwater | 22.67% | 0.013%(+22.7)#1 | 0.0034%(+22.7)#2 |
| 3. | Naukati Bay | 15.00% | 0.019%(+15.0)#1 | 0.0034%(+15.0)#3 |
| 4. | Harrah | 11.87% | 0.11%(+11.8)#2 | 0.0034%(+11.9)#4 |
| 5. | Glenwood | 8.64% | 0.11%(+8.52)#3 | 0.0034%(+8.63)#5 |
| 6. | Conconully | 7.54% | 0.11%(+7.42)#4 | 0.0034%(+7.53)#6 |
| 7. | Union Gap | 5.61% | 0.11%(+5.49)#5 | 0.0034%(+5.60)#7 |
| 8. | Wapato | 5.54% | 0.11%(+5.43)#6 | 0.0034%(+5.54)#8 |
| 9. | Zillah | 4.60% | 0.11%(+4.49)#7 | 0.0034%(+4.60)#9 |
| 10. | Lind | 4.39% | 0.11%(+4.28)#8 | 0.0034%(+4.39)#10 |
| 11. | Ione | 3.51% | 0.11%(+3.40)#9 | 0.0034%(+3.51)#11 |
| 12. | Kirkpatrick | 3.31% | 0.020%(+3.29)#1 | 0.0034%(+3.30)#12 |
| 13. | Roslyn | 3.14% | 0.11%(+3.03)#10 | 0.0034%(+3.14)#13 |
| 14. | Mission | 3.12% | 0.020%(+3.11)#2 | 0.0034%(+3.12)#14 |
| 15. | Grand Marais | 2.71% | 0.0016%(+2.71)#1 | 0.0034%(+2.71)#15 |
| 16. | Goldendale | 2.41% | 0.11%(+2.29)#11 | 0.0034%(+2.40)#16 |
| 17. | Glennallen | 2.30% | 0.019%(+2.28)#2 | 0.0034%(+2.30)#17 |
| 18. | Tutuilla | 2.03% | 0.020%(+2.01)#3 | 0.0034%(+2.02)#18 |
| 19. | Wishram | 1.99% | 0.11%(+1.88)#12 | 0.0034%(+1.99)#19 |
| 20. | Nespelem Community | 1.94% | 0.11%(+1.83)#13 | 0.0034%(+1.94)#20 |
| 21. | Toppenish | 1.79% | 0.11%(+1.68)#14 | 0.0034%(+1.79)#21 |
| 22. | Omak | 1.78% | 0.11%(+1.67)#15 | 0.0034%(+1.78)#22 |
| 23. | Lapwai | 1.60% | 0.013%(+1.59)#2 | 0.0034%(+1.60)#23 |
| 24. | Sumas | 1.43% | 0.11%(+1.32)#16 | 0.0034%(+1.43)#24 |
| 25. | Nisqually Indian Community | 1.35% | 0.11%(+1.24)#17 | 0.0034%(+1.35)#25 |
| 26. | Weitchpec | 1.27% | 0.00066%(+1.27)#1 | 0.0034%(+1.26)#26 |
| 27. | Warm Springs | 1.22% | 0.020%(+1.20)#4 | 0.0034%(+1.22)#27 |
| 28. | Cawker City | 1.18% | 0.00041%(+1.18)#1 | 0.0034%(+1.17)#28 |
| 29. | Mescal | 1.16% | 0.0015%(+1.16)#1 | 0.0034%(+1.15)#29 |
| 30. | Orting | 1.12% | 0.11%(+1.01)#18 | 0.0034%(+1.12)#30 |
| 31. | Malott | 1.08% | 0.11%(+0.965)#19 | 0.0034%(+1.08)#31 |
| 32. | Selah | 1.07% | 0.11%(+0.959)#20 | 0.0034%(+1.07)#32 |
| 33. | Tesuque Pueblo | 1.04% | 0.00043%(+1.04)#1 | 0.0034%(+1.04)#33 |
| 34. | Madras | 1.03% | 0.020%(+1.01)#5 | 0.0034%(+1.02)#34 |
| 35. | Monroe North | 1.01% | 0.11%(+0.897)#21 | 0.0034%(+1.01)#35 |
| 36. | Springdale | 0.97% | 0.11%(+0.861)#22 | 0.0034%(+0.971)#36 |
| 37. | Coulee Dam | 0.97% | 0.11%(+0.861)#23 | 0.0034%(+0.971)#37 |
| 38. | First Mesa | 0.96% | 0.0015%(+0.961)#2 | 0.0034%(+0.959)#38 |
| 39. | Riverside | 0.94% | 0.11%(+0.830)#24 | 0.0034%(+0.940)#39 |
| 40. | Mayetta | 0.93% | 0.00041%(+0.926)#2 | 0.0034%(+0.923)#40 |
| 41. | Stevenson | 0.88% | 0.11%(+0.770)#25 | 0.0034%(+0.881)#41 |
| 42. | Maltby | 0.87% | 0.11%(+0.759)#26 | 0.0034%(+0.869)#42 |
| 43. | Terrace Heights | 0.82% | 0.11%(+0.704)#27 | 0.0034%(+0.815)#43 |
| 44. | Skokomish | 0.78% | 0.11%(+0.663)#28 | 0.0034%(+0.773)#44 |
| 45. | Taholah | 0.73% | 0.11%(+0.616)#29 | 0.0034%(+0.726)#45 |
| 46. | Glendale | 0.73% | 0.020%(+0.706)#6 | 0.0034%(+0.722)#46 |
| 47. | Chelan | 0.68% | 0.11%(+0.566)#30 | 0.0034%(+0.676)#47 |
| 48. | Nespelem | 0.65% | 0.11%(+0.532)#31 | 0.0034%(+0.642)#48 |
| 49. | Tukwila | 0.60% | 0.11%(+0.485)#32 | 0.0034%(+0.595)#49 |
| 50. | South Browning | 0.54% | 0.0018%(+0.542)#1 | 0.0034%(+0.541)#50 |
| 51. | Clark Fork | 0.52% | 0.013%(+0.506)#3 | 0.0034%(+0.516)#51 |
| 52. | Culdesac | 0.51% | 0.013%(+0.497)#4 | 0.0034%(+0.507)#52 |
| 53. | Vinton | 0.48% | 0.00069%(+0.482)#1 | 0.0034%(+0.480)#53 |
| 54. | Elk Plain | 0.44% | 0.11%(+0.329)#33 | 0.0034%(+0.440)#54 |
| 55. | Jefferson | 0.43% | 0.00056%(+0.429)#1 | 0.0034%(+0.426)#55 |
| 56. | Kake | 0.42% | 0.019%(+0.404)#3 | 0.0034%(+0.419)#56 |
| 57. | Keller | 0.39% | 0.11%(+0.277)#34 | 0.0034%(+0.387)#57 |
| 58. | Granger | 0.36% | 0.11%(+0.245)#35 | 0.0034%(+0.355)#58 |
| 59. | Grand Ronde | 0.35% | 0.020%(+0.335)#7 | 0.0034%(+0.351)#59 |
| 60. | Napavine | 0.35% | 0.11%(+0.240)#36 | 0.0034%(+0.350)#60 |
| 61. | Philomath | 0.35% | 0.020%(+0.330)#8 | 0.0034%(+0.347)#61 |
| 62. | Yakima | 0.31% | 0.11%(+0.197)#37 | 0.0034%(+0.307)#62 |
| 63. | Ellensburg | 0.29% | 0.11%(+0.176)#38 | 0.0034%(+0.286)#63 |
| 64. | Cle Elum | 0.28% | 0.11%(+0.170)#39 | 0.0034%(+0.280)#64 |
| 65. | West Richland | 0.28% | 0.11%(+0.165)#40 | 0.0034%(+0.275)#65 |
| 66. | Airway Heights | 0.27% | 0.11%(+0.161)#41 | 0.0034%(+0.271)#66 |
| 67. | Mount Vernon | 0.27% | 0.11%(+0.160)#42 | 0.0034%(+0.270)#67 |
| 68. | Lolo | 0.24% | 0.0018%(+0.239)#2 | 0.0034%(+0.237)#68 |
| 69. | Gateway | 0.24% | 0.019%(+0.222)#4 | 0.0034%(+0.237)#69 |
| 70. | Barberton | 0.23% | 0.11%(+0.113)#43 | 0.0034%(+0.223)#70 |
| 71. | Pendleton | 0.22% | 0.020%(+0.198)#9 | 0.0034%(+0.214)#71 |
| 72. | Port Orchard | 0.21% | 0.11%(+0.095)#44 | 0.0034%(+0.205)#72 |
| 73. | Maywood Park | 0.19% | 0.020%(+0.172)#10 | 0.0034%(+0.188)#73 |
| 74. | Fairchild Afb | 0.19% | 0.11%(+0.075)#45 | 0.0034%(+0.185)#74 |
| 75. | Sunnyside | 0.18% | 0.11%(+0.070)#46 | 0.0034%(+0.180)#75 |
| 76. | Colville | 0.18% | 0.11%(+0.069)#47 | 0.0034%(+0.179)#76 |
| 77. | Ironton | 0.18% | 0.0016%(+0.177)#2 | 0.0034%(+0.175)#77 |
| 78. | Canonsburg Borough | 0.18% | 0.00034%(+0.175)#1 | 0.0034%(+0.172)#78 |
| 79. | Lake Oswego | 0.17% | 0.020%(+0.148)#11 | 0.0034%(+0.165)#79 |
| 80. | Shasta Lake | 0.16% | 0.00066%(+0.163)#2 | 0.0034%(+0.161)#80 |
| 81. | Lewiston | 0.16% | 0.013%(+0.144)#5 | 0.0034%(+0.154)#81 |
| 82. | Aberdeen | 0.15% | 0.11%(+0.040)#48 | 0.0034%(+0.150)#82 |
| 83. | Moscow | 0.15% | 0.013%(+0.139)#6 | 0.0034%(+0.149)#83 |
| 84. | Hazel Dell | 0.14% | 0.11%(+0.027)#49 | 0.0034%(+0.137)#84 |
| 85. | Enterprise | 0.14% | 0.020%(+0.118)#12 | 0.0034%(+0.135)#85 |
| 86. | Kingsland | 0.13% | 0.00046%(+0.134)#1 | 0.0034%(+0.131)#86 |
| 87. | Gig Harbor | 0.13% | 0.11%(+0.021)#50 | 0.0034%(+0.131)#87 |
| 88. | Oregon City | 0.13% | 0.020%(+0.114)#13 | 0.0034%(+0.130)#88 |
| 89. | Murphy | 0.13% | 0.00020%(+0.129)#1 | 0.0034%(+0.126)#89 |
| 90. | Enumclaw | 0.13% | 0.11%(+0.013)#51 | 0.0034%(+0.123)#90 |
| 91. | Vineyard | 0.13% | 0.0033%(+0.123)#1 | 0.0034%(+0.123)#91 |
| 92. | Oakley | 0.13% | 0.013%(+0.112)#7 | 0.0034%(+0.122)#92 |
| 93. | Kent | 0.12% | 0.11%(+0.004)#52 | 0.0034%(+0.114)#93 |
| 94. | Rosedale | 0.12% | 0.11%(+0.004)#53 | 0.0034%(+0.114)#94 |
| 95. | South Jordan | 0.11% | 0.0033%(+0.107)#2 | 0.0034%(+0.107)#95 |
| 96. | Shoreline | 0.11% | 0.11%(-0.004)#54 | 0.0034%(+0.106)#96 |
| 97. | Southgate | 0.11% | 0.00032%(+0.107)#1 | 0.0034%(+0.103)#97 |
| 98. | Mountlake Terrace | 0.10% | 0.11%(-0.010)#55 | 0.0034%(+0.100)#98 |
| 99. | Springfield | 0.10% | 0.020%(+0.082)#14 | 0.0034%(+0.099)#99 |
| 100. | La Conner | 0.10% | 0.11%(-0.013)#56 | 0.0034%(+0.097)#100 |
Common Questions
What are the Top 10 Cities with the Highest Percentage of Yakama Population in the United States?
Top 10 Cities with the Highest Percentage of Yakama Population in the United States are:
#1
56.51%
#2
22.67%
#3
15.00%
#4
11.87%
#5
8.64%
#6
7.54%
#7
5.61%
#8
5.54%
#9
4.60%
#10
4.39%
What city has the Highest Percentage of Yakama Population in the United States?
White Swan has the Highest Percentage of Yakama Population in the United States with 56.51%.
What is the Percentage of Yakama Population in the United States?
Percentage of Yakama Population in the United States is 0.0034%.