Cities with the Highest Percentage of Spanish American Indian Population in the United States
RELATED REPORTS & OPTIONS
Spanish American Indian
United States
Compare Cities
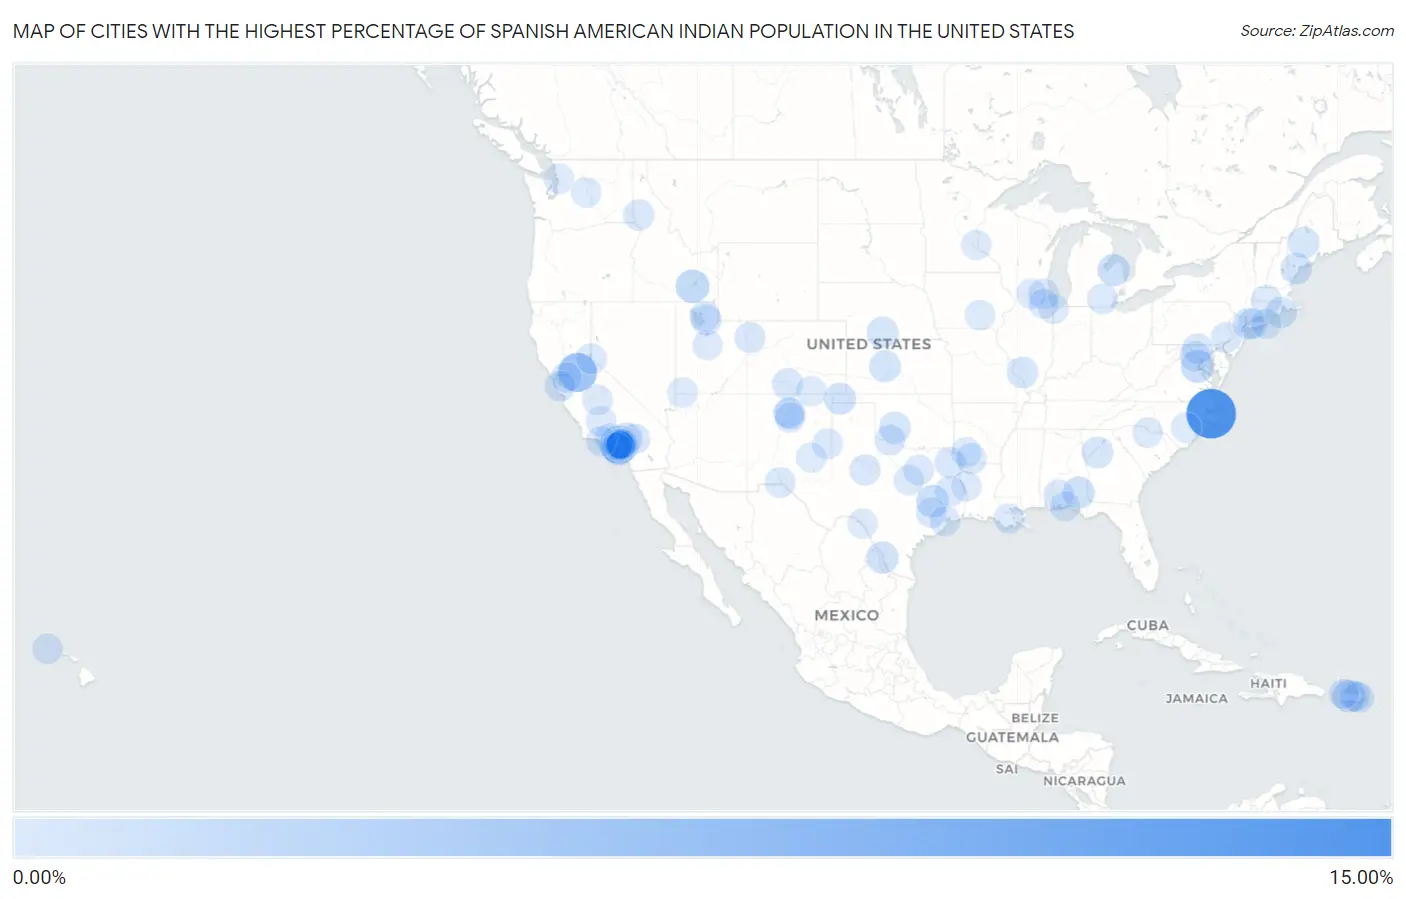
Map of Cities with the Highest Percentage of Spanish American Indian Population in the United States
0.00%
15.00%
Cities with the Highest Percentage of Spanish American Indian Population in the United States
| City | Spanish American Indian | vs State | vs National | |
| 1. | Creswell | 12.50% | 0.00019%(+12.5)#1 | 0.0056%(+12.5)#1 |
| 2. | Wallace | 5.43% | 0.026%(+5.40)#1 | 0.0056%(+5.42)#2 |
| 3. | South Monrovia Island | 4.83% | 0.026%(+4.80)#2 | 0.0056%(+4.82)#3 |
| 4. | Baldwin Park | 3.44% | 0.026%(+3.42)#3 | 0.0056%(+3.44)#4 |
| 5. | Citrus | 2.15% | 0.026%(+2.12)#4 | 0.0056%(+2.14)#5 |
| 6. | American Falls | 2.14% | 0.014%(+2.13)#1 | 0.0056%(+2.14)#6 |
| 7. | El Monte | 1.81% | 0.026%(+1.79)#5 | 0.0056%(+1.81)#7 |
| 8. | Artesia | 1.79% | 0.026%(+1.76)#6 | 0.0056%(+1.78)#8 |
| 9. | Oahe Acres | 1.77% | 0.00079%(+1.77)#1 | 0.0056%(+1.77)#9 |
| 10. | Dumfries | 1.72% | 0.0040%(+1.72)#1 | 0.0056%(+1.71)#10 |
| 11. | Utuado | 1.68% | 0.017%(+1.66)#1 | 0.0056%(+1.68)#11 |
| 12. | Azusa | 1.52% | 0.026%(+1.49)#7 | 0.0056%(+1.51)#12 |
| 13. | Bedias | 1.43% | 0.0036%(+1.42)#1 | 0.0056%(+1.42)#13 |
| 14. | Gagetown | 1.25% | 0.00035%(+1.25)#1 | 0.0056%(+1.24)#14 |
| 15. | El Cenizo | 1.21% | 0.0036%(+1.21)#2 | 0.0056%(+1.21)#15 |
| 16. | Daleville | 1.12% | 0.0022%(+1.12)#1 | 0.0056%(+1.12)#16 |
| 17. | Phelan | 1.07% | 0.026%(+1.04)#8 | 0.0056%(+1.06)#17 |
| 18. | Boise City | 1.05% | 0.0092%(+1.04)#1 | 0.0056%(+1.05)#18 |
| 19. | La Crosse | 0.95% | 0.0010%(+0.946)#1 | 0.0056%(+0.941)#19 |
| 20. | Duarte | 0.89% | 0.026%(+0.869)#9 | 0.0056%(+0.889)#20 |
| 21. | Manorhaven | 0.87% | 0.0052%(+0.861)#1 | 0.0056%(+0.860)#21 |
| 22. | South Windham | 0.84% | 0.00088%(+0.838)#1 | 0.0056%(+0.834)#22 |
| 23. | Carnegie | 0.82% | 0.0092%(+0.811)#2 | 0.0056%(+0.815)#23 |
| 24. | Vincent | 0.82% | 0.026%(+0.793)#10 | 0.0056%(+0.813)#24 |
| 25. | Atlanta | 0.81% | 0.00097%(+0.805)#1 | 0.0056%(+0.801)#25 |
| 26. | Bingham | 0.80% | 0.00088%(+0.799)#2 | 0.0056%(+0.794)#26 |
| 27. | Hapeville | 0.79% | 0.00048%(+0.791)#1 | 0.0056%(+0.786)#27 |
| 28. | Tilden | 0.73% | 0.00060%(+0.728)#1 | 0.0056%(+0.723)#28 |
| 29. | Narragansett Pier | 0.64% | 0.0024%(+0.639)#1 | 0.0056%(+0.636)#29 |
| 30. | Corazon | 0.61% | 0.017%(+0.597)#2 | 0.0056%(+0.608)#30 |
| 31. | Monte Vista | 0.52% | 0.015%(+0.509)#1 | 0.0056%(+0.518)#31 |
| 32. | Culdesac | 0.51% | 0.014%(+0.496)#2 | 0.0056%(+0.505)#32 |
| 33. | Daingerfield | 0.48% | 0.0036%(+0.476)#3 | 0.0056%(+0.474)#33 |
| 34. | Hermleigh | 0.47% | 0.0036%(+0.463)#4 | 0.0056%(+0.461)#34 |
| 35. | Gurabo | 0.43% | 0.017%(+0.414)#3 | 0.0056%(+0.425)#35 |
| 36. | Gettysburg Borough | 0.43% | 0.0016%(+0.426)#1 | 0.0056%(+0.422)#36 |
| 37. | Rangely | 0.42% | 0.015%(+0.405)#2 | 0.0056%(+0.414)#37 |
| 38. | Hanover Borough | 0.41% | 0.0016%(+0.407)#2 | 0.0056%(+0.403)#38 |
| 39. | Magnolia | 0.40% | 0.0019%(+0.397)#1 | 0.0056%(+0.393)#39 |
| 40. | Nambe | 0.37% | 0.026%(+0.344)#1 | 0.0056%(+0.364)#40 |
| 41. | La Mesilla | 0.37% | 0.026%(+0.341)#2 | 0.0056%(+0.361)#41 |
| 42. | Fox Lake Hills | 0.33% | 0.00060%(+0.333)#2 | 0.0056%(+0.328)#42 |
| 43. | Walkersville | 0.32% | 0.0017%(+0.319)#1 | 0.0056%(+0.315)#43 |
| 44. | Leesburg | 0.32% | 0.0040%(+0.316)#2 | 0.0056%(+0.314)#44 |
| 45. | Atherton | 0.31% | 0.026%(+0.283)#11 | 0.0056%(+0.303)#45 |
| 46. | Castaic | 0.29% | 0.026%(+0.264)#12 | 0.0056%(+0.284)#46 |
| 47. | Maili | 0.29% | 0.0043%(+0.285)#1 | 0.0056%(+0.283)#47 |
| 48. | Temple City | 0.29% | 0.026%(+0.262)#13 | 0.0056%(+0.282)#48 |
| 49. | Frederick | 0.29% | 0.0092%(+0.278)#3 | 0.0056%(+0.281)#49 |
| 50. | Brewton | 0.29% | 0.0022%(+0.283)#2 | 0.0056%(+0.280)#50 |
| 51. | Lufkin | 0.28% | 0.0036%(+0.280)#5 | 0.0056%(+0.278)#51 |
| 52. | Fruit Heights | 0.28% | 0.013%(+0.270)#1 | 0.0056%(+0.277)#52 |
| 53. | Syosset | 0.28% | 0.0052%(+0.277)#2 | 0.0056%(+0.276)#53 |
| 54. | Santa Teresa | 0.28% | 0.026%(+0.256)#3 | 0.0056%(+0.276)#54 |
| 55. | South Lake Tahoe | 0.28% | 0.026%(+0.251)#14 | 0.0056%(+0.271)#55 |
| 56. | Plymouth Meeting | 0.27% | 0.0016%(+0.265)#3 | 0.0056%(+0.261)#56 |
| 57. | Monrovia | 0.25% | 0.026%(+0.227)#15 | 0.0056%(+0.247)#57 |
| 58. | Hempstead | 0.23% | 0.0036%(+0.225)#6 | 0.0056%(+0.223)#58 |
| 59. | Pomona | 0.22% | 0.026%(+0.197)#16 | 0.0056%(+0.217)#59 |
| 60. | Brentwood | 0.22% | 0.026%(+0.196)#17 | 0.0056%(+0.216)#60 |
| 61. | Manchester | 0.22% | 0.00035%(+0.221)#2 | 0.0056%(+0.216)#61 |
| 62. | Rosemead | 0.22% | 0.026%(+0.194)#18 | 0.0056%(+0.214)#62 |
| 63. | Portales | 0.22% | 0.026%(+0.189)#4 | 0.0056%(+0.210)#63 |
| 64. | Cedar Hill | 0.21% | 0.0036%(+0.208)#7 | 0.0056%(+0.206)#64 |
| 65. | Corozal | 0.21% | 0.017%(+0.193)#4 | 0.0056%(+0.204)#65 |
| 66. | Lucerne Valley | 0.21% | 0.026%(+0.184)#19 | 0.0056%(+0.204)#66 |
| 67. | Wenatchee | 0.20% | 0.0016%(+0.193)#1 | 0.0056%(+0.189)#67 |
| 68. | Morgan | 0.19% | 0.0036%(+0.185)#8 | 0.0056%(+0.183)#68 |
| 69. | East Pasadena | 0.18% | 0.026%(+0.157)#20 | 0.0056%(+0.177)#69 |
| 70. | Trinidad | 0.18% | 0.015%(+0.165)#3 | 0.0056%(+0.174)#70 |
| 71. | Shafter | 0.18% | 0.026%(+0.153)#21 | 0.0056%(+0.173)#71 |
| 72. | Sanger | 0.18% | 0.026%(+0.151)#22 | 0.0056%(+0.171)#72 |
| 73. | Ogden | 0.17% | 0.013%(+0.155)#2 | 0.0056%(+0.163)#73 |
| 74. | Hope | 0.15% | 0.0019%(+0.144)#2 | 0.0056%(+0.140)#74 |
| 75. | Raceland | 0.14% | 0.0051%(+0.139)#1 | 0.0056%(+0.139)#75 |
| 76. | Lake Goodwin | 0.14% | 0.0016%(+0.142)#2 | 0.0056%(+0.138)#76 |
| 77. | Charter Oak | 0.14% | 0.026%(+0.114)#23 | 0.0056%(+0.134)#77 |
| 78. | South Gate | 0.14% | 0.026%(+0.113)#24 | 0.0056%(+0.133)#78 |
| 79. | North Charleroi Borough | 0.13% | 0.0016%(+0.130)#4 | 0.0056%(+0.126)#79 |
| 80. | Webster | 0.13% | 0.0036%(+0.127)#9 | 0.0056%(+0.124)#80 |
| 81. | Mary Esther | 0.12% | 0.0035%(+0.121)#1 | 0.0056%(+0.119)#81 |
| 82. | Springfield | 0.12% | 0.0034%(+0.120)#1 | 0.0056%(+0.118)#82 |
| 83. | East Chicago | 0.12% | 0.0015%(+0.120)#1 | 0.0056%(+0.116)#83 |
| 84. | Roswell | 0.12% | 0.026%(+0.095)#5 | 0.0056%(+0.115)#84 |
| 85. | Isabela | 0.12% | 0.017%(+0.102)#5 | 0.0056%(+0.113)#85 |
| 86. | Del Rio | 0.12% | 0.0036%(+0.112)#10 | 0.0056%(+0.110)#86 |
| 87. | Van Wyck | 0.11% | 0.00010%(+0.114)#1 | 0.0056%(+0.109)#87 |
| 88. | San Buenaventura Ventura | 0.11% | 0.026%(+0.088)#25 | 0.0056%(+0.109)#88 |
| 89. | St George | 0.11% | 0.013%(+0.100)#3 | 0.0056%(+0.108)#89 |
| 90. | Roscoe | 0.11% | 0.00060%(+0.107)#3 | 0.0056%(+0.102)#90 |
| 91. | Nephi | 0.11% | 0.013%(+0.095)#4 | 0.0056%(+0.102)#91 |
| 92. | Zwolle | 0.11% | 0.0051%(+0.102)#2 | 0.0056%(+0.102)#92 |
| 93. | Glendora | 0.11% | 0.026%(+0.082)#26 | 0.0056%(+0.102)#93 |
| 94. | West Covina | 0.11% | 0.026%(+0.080)#27 | 0.0056%(+0.100)#94 |
| 95. | Faison | 0.11% | 0.00019%(+0.105)#2 | 0.0056%(+0.100)#95 |
| 96. | Winfield | 0.10% | 0.00060%(+0.100)#4 | 0.0056%(+0.095)#96 |
| 97. | Hampton Bays | 0.10% | 0.0052%(+0.095)#3 | 0.0056%(+0.095)#97 |
| 98. | Santa Fe | 0.098% | 0.026%(+0.072)#6 | 0.0056%(+0.093)#98 |
| 99. | Oskaloosa | 0.096% | 0.0013%(+0.094)#1 | 0.0056%(+0.090)#99 |
| 100. | Woodbury | 0.093% | 0.0013%(+0.091)#1 | 0.0056%(+0.087)#100 |
Common Questions
What are the Top 10 Cities with the Highest Percentage of Spanish American Indian Population in the United States?
Top 10 Cities with the Highest Percentage of Spanish American Indian Population in the United States are:
What city has the Highest Percentage of Spanish American Indian Population in the United States?
Creswell has the Highest Percentage of Spanish American Indian Population in the United States with 12.50%.
What is the Percentage of Spanish American Indian Population in the United States?
Percentage of Spanish American Indian Population in the United States is 0.0056%.