Cities with the Largest Ecuadorian Community in the United States
RELATED REPORTS & OPTIONS
Ecuadorian
United States
Compare Cities
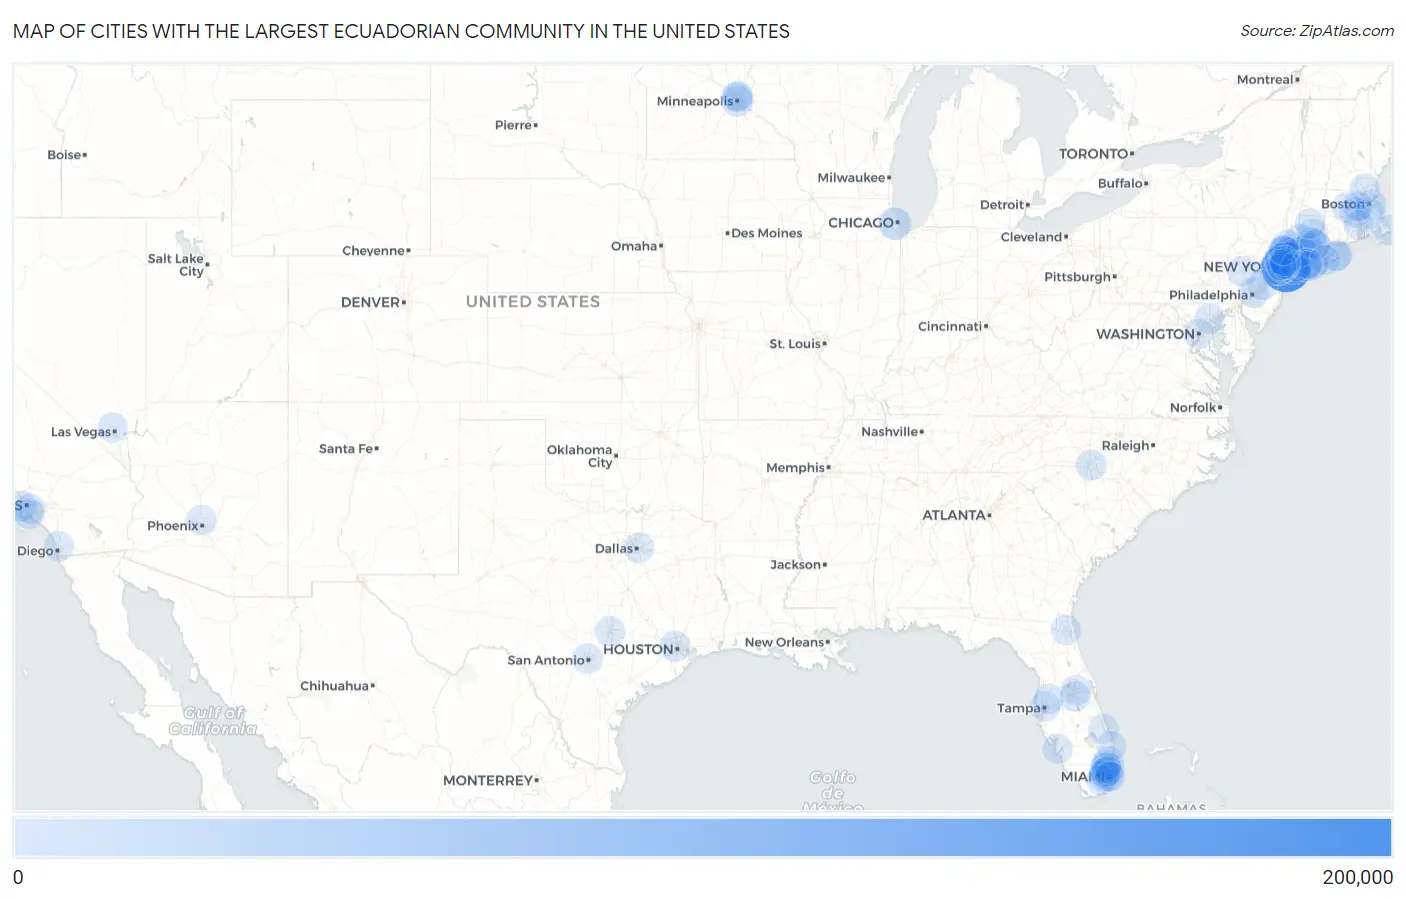
Map of Cities with the Largest Ecuadorian Community in the United States
0
200,000
Cities with the Largest Ecuadorian Community in the United States
| City | Ecuadorian | vs State | vs National | |
| 1. | New York | 198,467 | 285,331(69.56%)#1 | 803,854(24.69%)#1 |
| 2. | Newark | 26,803 | 148,122(18.10%)#1 | 803,854(3.33%)#2 |
| 3. | Chicago | 21,358 | 32,118(66.50%)#1 | 803,854(2.66%)#3 |
| 4. | Elizabeth | 9,827 | 148,122(6.63%)#2 | 803,854(1.22%)#4 |
| 5. | Danbury | 9,319 | 40,028(23.28%)#1 | 803,854(1.16%)#5 |
| 6. | Los Angeles | 7,850 | 45,661(17.19%)#1 | 803,854(0.98%)#6 |
| 7. | Yonkers | 6,841 | 285,331(2.40%)#2 | 803,854(0.85%)#7 |
| 8. | Minneapolis | 6,798 | 14,276(47.62%)#1 | 803,854(0.85%)#8 |
| 9. | Union City | 6,715 | 148,122(4.53%)#3 | 803,854(0.84%)#9 |
| 10. | Jersey City | 5,285 | 148,122(3.57%)#4 | 803,854(0.66%)#10 |
| 11. | Hackensack | 4,843 | 148,122(3.27%)#5 | 803,854(0.60%)#11 |
| 12. | Charlotte | 4,721 | 13,087(36.07%)#1 | 803,854(0.59%)#12 |
| 13. | Kearny | 4,083 | 148,122(2.76%)#6 | 803,854(0.51%)#13 |
| 14. | Ossining | 4,030 | 285,331(1.41%)#3 | 803,854(0.50%)#14 |
| 15. | Stamford | 4,014 | 40,028(10.03%)#2 | 803,854(0.50%)#15 |
| 16. | Houston | 3,931 | 21,592(18.21%)#1 | 803,854(0.49%)#16 |
| 17. | West New York | 3,812 | 148,122(2.57%)#7 | 803,854(0.47%)#17 |
| 18. | Bridgeport | 3,565 | 40,028(8.91%)#3 | 803,854(0.44%)#18 |
| 19. | Peekskill | 3,527 | 285,331(1.24%)#4 | 803,854(0.44%)#19 |
| 20. | Spring Valley | 3,361 | 285,331(1.18%)#5 | 803,854(0.42%)#20 |
| 21. | Miami | 3,163 | 85,299(3.71%)#1 | 803,854(0.39%)#21 |
| 22. | Medford | 2,919 | 285,331(1.02%)#6 | 803,854(0.36%)#22 |
| 23. | Philadelphia | 2,896 | 19,521(14.84%)#1 | 803,854(0.36%)#23 |
| 24. | Plainfield | 2,767 | 148,122(1.87%)#8 | 803,854(0.34%)#24 |
| 25. | Paterson | 2,530 | 148,122(1.71%)#9 | 803,854(0.31%)#25 |
| 26. | Port Chester | 2,328 | 285,331(0.82%)#7 | 803,854(0.29%)#26 |
| 27. | Springs | 2,281 | 285,331(0.80%)#8 | 803,854(0.28%)#27 |
| 28. | Orlando | 2,118 | 85,299(2.48%)#2 | 803,854(0.26%)#28 |
| 29. | Brentwood | 2,041 | 285,331(0.72%)#9 | 803,854(0.25%)#29 |
| 30. | Nanuet | 2,002 | 285,331(0.70%)#10 | 803,854(0.25%)#30 |
| 31. | New Haven | 1,950 | 40,028(4.87%)#4 | 803,854(0.24%)#31 |
| 32. | Doral | 1,875 | 85,299(2.20%)#3 | 803,854(0.23%)#32 |
| 33. | Trenton | 1,827 | 148,122(1.23%)#10 | 803,854(0.23%)#33 |
| 34. | Norwalk | 1,819 | 40,028(4.54%)#5 | 803,854(0.23%)#34 |
| 35. | Sleepy Hollow | 1,814 | 285,331(0.64%)#11 | 803,854(0.23%)#35 |
| 36. | Boston | 1,803 | 18,363(9.82%)#1 | 803,854(0.22%)#36 |
| 37. | Allentown | 1,768 | 19,521(9.06%)#2 | 803,854(0.22%)#37 |
| 38. | Worcester | 1,728 | 18,363(9.41%)#2 | 803,854(0.21%)#38 |
| 39. | Waterbury | 1,630 | 40,028(4.07%)#6 | 803,854(0.20%)#39 |
| 40. | Ansonia | 1,589 | 40,028(3.97%)#7 | 803,854(0.20%)#40 |
| 41. | Hialeah | 1,581 | 85,299(1.85%)#4 | 803,854(0.20%)#41 |
| 42. | Port St Lucie | 1,558 | 85,299(1.83%)#5 | 803,854(0.19%)#42 |
| 43. | Clifton | 1,508 | 148,122(1.02%)#11 | 803,854(0.19%)#43 |
| 44. | Linden | 1,485 | 148,122(1.00%)#12 | 803,854(0.18%)#44 |
| 45. | Tampa | 1,473 | 85,299(1.73%)#6 | 803,854(0.18%)#45 |
| 46. | Coconut Creek | 1,435 | 85,299(1.68%)#7 | 803,854(0.18%)#46 |
| 47. | West Haven | 1,432 | 40,028(3.58%)#8 | 803,854(0.18%)#47 |
| 48. | Brockton | 1,403 | 18,363(7.64%)#3 | 803,854(0.17%)#48 |
| 49. | Hollywood | 1,371 | 85,299(1.61%)#8 | 803,854(0.17%)#49 |
| 50. | Milford | 1,358 | 18,363(7.40%)#4 | 803,854(0.17%)#50 |
| 51. | North Plainfield Borough | 1,355 | 148,122(0.91%)#13 | 803,854(0.17%)#51 |
| 52. | Barnstable Town | 1,339 | 18,363(7.29%)#5 | 803,854(0.17%)#52 |
| 53. | Kissimmee | 1,331 | 85,299(1.56%)#9 | 803,854(0.17%)#53 |
| 54. | Valley Stream | 1,328 | 285,331(0.47%)#12 | 803,854(0.17%)#54 |
| 55. | Pembroke Pines | 1,326 | 85,299(1.55%)#10 | 803,854(0.16%)#55 |
| 56. | Sunrise | 1,314 | 85,299(1.54%)#11 | 803,854(0.16%)#56 |
| 57. | Cliffside Park Borough | 1,293 | 148,122(0.87%)#14 | 803,854(0.16%)#57 |
| 58. | Long Beach | 1,274 | 45,661(2.79%)#2 | 803,854(0.16%)#58 |
| 59. | San Diego | 1,267 | 45,661(2.77%)#3 | 803,854(0.16%)#59 |
| 60. | East Hampton North | 1,267 | 285,331(0.44%)#13 | 803,854(0.16%)#60 |
| 61. | The Hammocks | 1,259 | 85,299(1.48%)#12 | 803,854(0.16%)#61 |
| 62. | Hempstead | 1,254 | 285,331(0.44%)#14 | 803,854(0.16%)#62 |
| 63. | Bayonne | 1,233 | 148,122(0.83%)#15 | 803,854(0.15%)#63 |
| 64. | Davie | 1,188 | 85,299(1.39%)#13 | 803,854(0.15%)#64 |
| 65. | Silver Lake Cdp Essex County | 1,172 | 148,122(0.79%)#16 | 803,854(0.15%)#65 |
| 66. | Phoenix | 1,167 | 4,240(27.52%)#1 | 803,854(0.15%)#66 |
| 67. | Patchogue | 1,153 | 285,331(0.40%)#15 | 803,854(0.14%)#67 |
| 68. | Ampere North | 1,149 | 148,122(0.78%)#17 | 803,854(0.14%)#68 |
| 69. | Columbia Heights | 1,130 | 14,276(7.92%)#2 | 803,854(0.14%)#69 |
| 70. | Austin | 1,117 | 21,592(5.17%)#2 | 803,854(0.14%)#70 |
| 71. | Lodi Borough | 1,115 | 148,122(0.75%)#18 | 803,854(0.14%)#71 |
| 72. | North Arlington Borough | 1,093 | 148,122(0.74%)#19 | 803,854(0.14%)#72 |
| 73. | Jacksonville | 1,092 | 85,299(1.28%)#14 | 803,854(0.14%)#73 |
| 74. | Cape Coral | 1,078 | 85,299(1.26%)#15 | 803,854(0.13%)#74 |
| 75. | Fridley | 1,071 | 14,276(7.50%)#3 | 803,854(0.13%)#75 |
| 76. | Central Islip | 1,060 | 285,331(0.37%)#16 | 803,854(0.13%)#76 |
| 77. | San Antonio | 1,052 | 21,592(4.87%)#3 | 803,854(0.13%)#77 |
| 78. | Providence | 1,041 | 1,750(59.49%)#1 | 803,854(0.13%)#78 |
| 79. | Bay Shore | 1,030 | 285,331(0.36%)#17 | 803,854(0.13%)#79 |
| 80. | Dallas | 1,010 | 21,592(4.68%)#4 | 803,854(0.13%)#80 |
| 81. | Miami Lakes | 1,000 | 85,299(1.17%)#16 | 803,854(0.12%)#81 |
| 82. | West Palm Beach | 997 | 85,299(1.17%)#17 | 803,854(0.12%)#82 |
| 83. | Miami Gardens | 991 | 85,299(1.16%)#18 | 803,854(0.12%)#83 |
| 84. | Baltimore | 974 | 10,475(9.30%)#1 | 803,854(0.12%)#84 |
| 85. | East Newark Borough | 972 | 148,122(0.66%)#20 | 803,854(0.12%)#85 |
| 86. | Guttenberg | 971 | 148,122(0.66%)#21 | 803,854(0.12%)#86 |
| 87. | Torrington | 958 | 40,028(2.39%)#9 | 803,854(0.12%)#87 |
| 88. | Harrison | 948 | 148,122(0.64%)#22 | 803,854(0.12%)#88 |
| 89. | Washington | 946 | 946(100.00%)#1 | 803,854(0.12%)#89 |
| 90. | Miami Beach | 946 | 85,299(1.11%)#19 | 803,854(0.12%)#90 |
| 91. | Downey | 944 | 45,661(2.07%)#4 | 803,854(0.12%)#91 |
| 92. | Framingham | 938 | 18,363(5.11%)#6 | 803,854(0.12%)#92 |
| 93. | Hillcrest | 929 | 285,331(0.33%)#18 | 803,854(0.12%)#93 |
| 94. | Ridgefield Park | 919 | 148,122(0.62%)#23 | 803,854(0.11%)#94 |
| 95. | Hightstown Borough | 914 | 148,122(0.62%)#24 | 803,854(0.11%)#95 |
| 96. | Roselle Borough | 907 | 148,122(0.61%)#25 | 803,854(0.11%)#96 |
| 97. | Methuen Town | 893 | 18,363(4.86%)#7 | 803,854(0.11%)#97 |
| 98. | Wesley Chapel | 890 | 85,299(1.04%)#20 | 803,854(0.11%)#98 |
| 99. | Las Vegas | 864 | 2,965(29.14%)#1 | 803,854(0.11%)#99 |
| 100. | Flanders | 841 | 285,331(0.29%)#19 | 803,854(0.10%)#100 |
Common Questions
What are the Top 10 Cities with the Largest Ecuadorian Community in the United States?
Top 10 Cities with the Largest Ecuadorian Community in the United States are:
#1
198,467
#2
26,803
#3
21,358
#4
9,827
#5
9,319
#6
7,850
#7
6,841
#8
6,798
#9
6,715
#10
5,285
What city has the Largest Ecuadorian Community in the United States?
New York has the Largest Ecuadorian Community in the United States with 198,467.
What is the Total Ecuadorian Population in the United States?
Total Ecuadorian Population in the United States is 803,854.