Cities with the Highest Percentage of Paraguayan Population in the United States
RELATED REPORTS & OPTIONS
Paraguayan
United States
Compare Cities
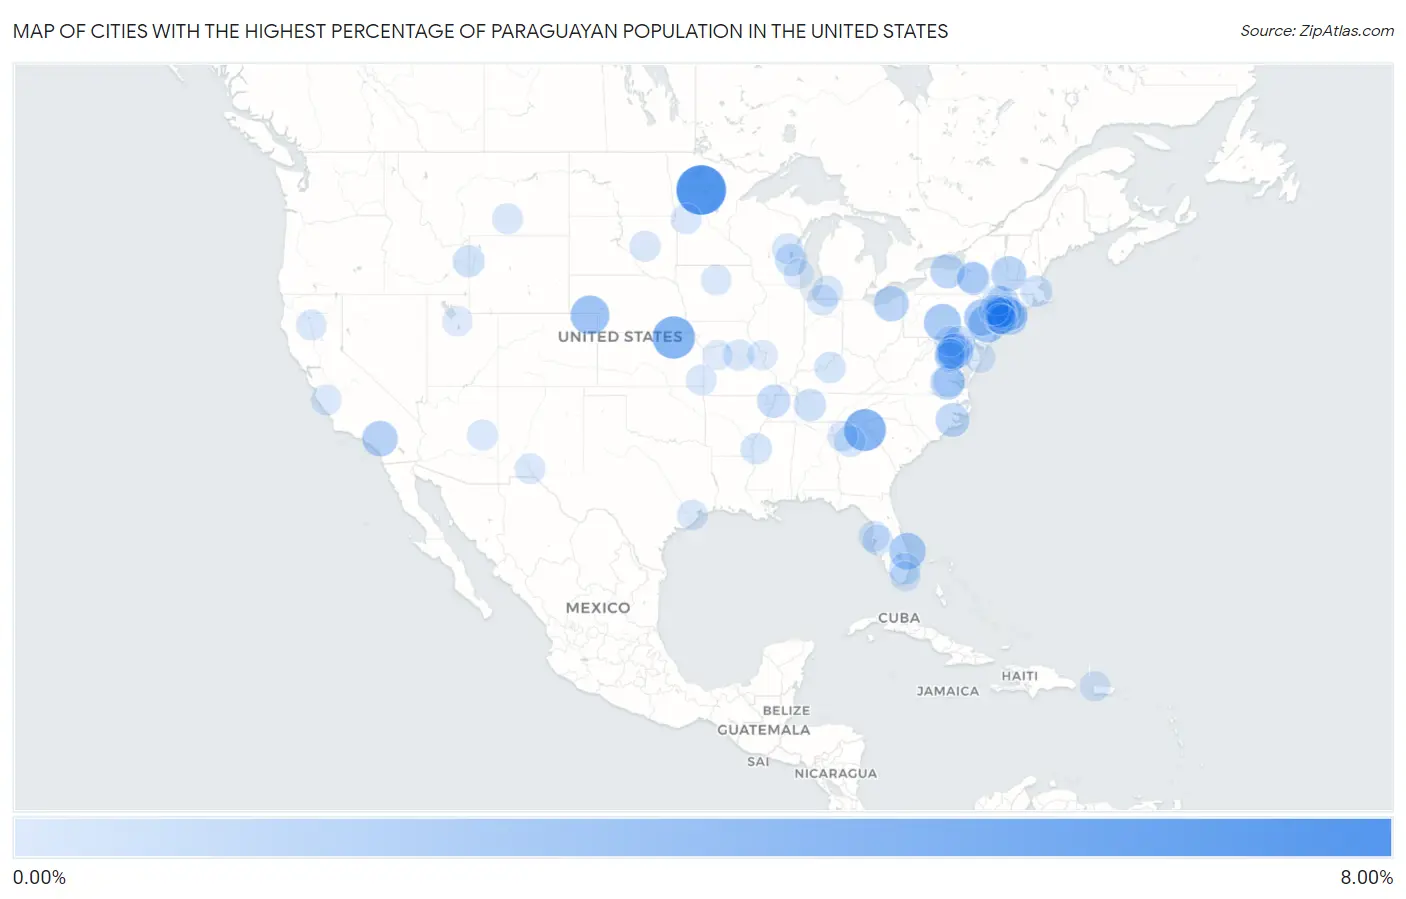
Map of Cities with the Highest Percentage of Paraguayan Population in the United States
0.00%
8.00%
Cities with the Highest Percentage of Paraguayan Population in the United States
| City | Paraguayan | vs State | vs National | |
| 1. | Laporte | 6.90% | 0.0062%(+6.89)#1 | 0.0083%(+6.89)#1 |
| 2. | Raritan Borough | 6.08% | 0.029%(+6.06)#1 | 0.0083%(+6.08)#2 |
| 3. | Far Hills Borough | 5.92% | 0.029%(+5.89)#2 | 0.0083%(+5.91)#3 |
| 4. | Blue Rapids | 4.37% | 0.014%(+4.35)#1 | 0.0083%(+4.36)#4 |
| 5. | Bernardsville Borough | 4.27% | 0.029%(+4.24)#3 | 0.0083%(+4.26)#5 |
| 6. | Avalon | 4.21% | 0.0041%(+4.21)#1 | 0.0083%(+4.20)#6 |
| 7. | Sedgwick | 3.12% | 0.0060%(+3.12)#1 | 0.0083%(+3.12)#7 |
| 8. | Belle Mead | 2.81% | 0.029%(+2.78)#4 | 0.0083%(+2.80)#8 |
| 9. | Allensville | 2.55% | 0.0065%(+2.54)#1 | 0.0083%(+2.54)#9 |
| 10. | Anderson | 2.41% | 0.029%(+2.38)#5 | 0.0083%(+2.40)#10 |
| 11. | Jensen Beach | 2.36% | 0.018%(+2.34)#1 | 0.0083%(+2.35)#11 |
| 12. | Bridgeport Borough | 2.30% | 0.0065%(+2.29)#2 | 0.0083%(+2.29)#12 |
| 13. | Colmar Manor | 2.11% | 0.019%(+2.09)#1 | 0.0083%(+2.10)#13 |
| 14. | Grand Terrace | 2.04% | 0.0038%(+2.03)#1 | 0.0083%(+2.03)#14 |
| 15. | Hunting Valley | 1.87% | 0.0025%(+1.87)#1 | 0.0083%(+1.87)#15 |
| 16. | Arlington | 1.85% | 0.0070%(+1.85)#1 | 0.0083%(+1.84)#16 |
| 17. | North Patchogue | 1.85% | 0.033%(+1.81)#1 | 0.0083%(+1.84)#17 |
| 18. | Swedeland | 1.67% | 0.0065%(+1.66)#3 | 0.0083%(+1.66)#18 |
| 19. | Ettrick | 1.65% | 0.018%(+1.63)#1 | 0.0083%(+1.64)#19 |
| 20. | Webster | 1.61% | 0.033%(+1.57)#2 | 0.0083%(+1.60)#20 |
| 21. | The Hills | 1.55% | 0.029%(+1.52)#6 | 0.0083%(+1.54)#21 |
| 22. | Elmsford | 1.50% | 0.033%(+1.47)#3 | 0.0083%(+1.49)#22 |
| 23. | East Williston | 1.48% | 0.033%(+1.45)#4 | 0.0083%(+1.47)#23 |
| 24. | Trent Woods | 1.44% | 0.0043%(+1.44)#1 | 0.0083%(+1.44)#24 |
| 25. | Frenchtown Borough | 1.22% | 0.029%(+1.19)#7 | 0.0083%(+1.21)#25 |
| 26. | Caruthersville | 1.20% | 0.0024%(+1.20)#1 | 0.0083%(+1.19)#26 |
| 27. | Pawling | 1.19% | 0.033%(+1.15)#5 | 0.0083%(+1.18)#27 |
| 28. | Lutherville | 1.12% | 0.019%(+1.10)#2 | 0.0083%(+1.11)#28 |
| 29. | Scarsdale | 1.11% | 0.033%(+1.07)#6 | 0.0083%(+1.10)#29 |
| 30. | Sound Beach | 1.08% | 0.033%(+1.04)#7 | 0.0083%(+1.07)#30 |
| 31. | Byram | 1.06% | 0.019%(+1.04)#1 | 0.0083%(+1.05)#31 |
| 32. | Hamilton | 1.06% | 0.033%(+1.02)#8 | 0.0083%(+1.05)#32 |
| 33. | Peapack And Gladstone Borough | 1.05% | 0.029%(+1.03)#8 | 0.0083%(+1.05)#33 |
| 34. | Kemp Mill | 1.00% | 0.019%(+0.981)#3 | 0.0083%(+0.992)#34 |
| 35. | Ramsey Borough | 0.95% | 0.029%(+0.921)#9 | 0.0083%(+0.942)#35 |
| 36. | St James | 0.95% | 0.033%(+0.913)#9 | 0.0083%(+0.938)#36 |
| 37. | Fond Du Lac | 0.93% | 0.0097%(+0.918)#1 | 0.0083%(+0.919)#37 |
| 38. | Fairview Cdp Westchester County | 0.92% | 0.033%(+0.886)#10 | 0.0083%(+0.911)#38 |
| 39. | Armonk | 0.91% | 0.033%(+0.880)#11 | 0.0083%(+0.905)#39 |
| 40. | Fairview | 0.89% | 0.0024%(+0.891)#1 | 0.0083%(+0.885)#40 |
| 41. | Ave Maria | 0.88% | 0.018%(+0.864)#2 | 0.0083%(+0.874)#41 |
| 42. | Lakehurst Borough | 0.87% | 0.029%(+0.838)#10 | 0.0083%(+0.859)#42 |
| 43. | Enon | 0.86% | 0.018%(+0.839)#2 | 0.0083%(+0.848)#43 |
| 44. | Newington | 0.83% | 0.018%(+0.808)#3 | 0.0083%(+0.818)#44 |
| 45. | Driggs | 0.82% | 0.0078%(+0.816)#1 | 0.0083%(+0.816)#45 |
| 46. | Parryville Borough | 0.81% | 0.0065%(+0.804)#4 | 0.0083%(+0.802)#46 |
| 47. | Fanwood Borough | 0.80% | 0.029%(+0.774)#11 | 0.0083%(+0.794)#47 |
| 48. | Morrisville | 0.72% | 0.033%(+0.688)#12 | 0.0083%(+0.713)#48 |
| 49. | Irvington | 0.70% | 0.033%(+0.665)#13 | 0.0083%(+0.690)#49 |
| 50. | Norwood | 0.69% | 0.010%(+0.676)#1 | 0.0083%(+0.678)#50 |
| 51. | Weston | 0.67% | 0.018%(+0.648)#3 | 0.0083%(+0.658)#51 |
| 52. | Leland | 0.66% | 0.0029%(+0.657)#1 | 0.0083%(+0.652)#52 |
| 53. | Southport | 0.66% | 0.019%(+0.641)#2 | 0.0083%(+0.652)#53 |
| 54. | National Harbor | 0.63% | 0.019%(+0.614)#4 | 0.0083%(+0.624)#54 |
| 55. | Doraville | 0.63% | 0.0041%(+0.623)#2 | 0.0083%(+0.618)#55 |
| 56. | New Stanton Borough | 0.62% | 0.0065%(+0.610)#5 | 0.0083%(+0.608)#56 |
| 57. | Pioneer Village | 0.60% | 0.0014%(+0.594)#1 | 0.0083%(+0.587)#57 |
| 58. | Doylestown Borough | 0.57% | 0.0065%(+0.559)#6 | 0.0083%(+0.558)#58 |
| 59. | South Bound Brook Borough | 0.56% | 0.029%(+0.530)#12 | 0.0083%(+0.550)#59 |
| 60. | New Bloomfield | 0.55% | 0.0024%(+0.548)#2 | 0.0083%(+0.542)#60 |
| 61. | Lawton | 0.54% | 0.0024%(+0.533)#1 | 0.0083%(+0.527)#61 |
| 62. | Hortonville | 0.51% | 0.0097%(+0.505)#2 | 0.0083%(+0.506)#62 |
| 63. | Roseland | 0.50% | 0.0011%(+0.503)#1 | 0.0083%(+0.495)#63 |
| 64. | Wessington | 0.49% | 0.00011%(+0.492)#1 | 0.0083%(+0.484)#64 |
| 65. | Allenhurst Borough | 0.49% | 0.029%(+0.457)#13 | 0.0083%(+0.477)#65 |
| 66. | Keystone | 0.47% | 0.018%(+0.454)#4 | 0.0083%(+0.464)#66 |
| 67. | Lockwood | 0.46% | 0.0060%(+0.454)#1 | 0.0083%(+0.452)#67 |
| 68. | Linden | 0.45% | 0.0032%(+0.445)#1 | 0.0083%(+0.440)#68 |
| 69. | Ridgefield Park | 0.45% | 0.029%(+0.420)#14 | 0.0083%(+0.440)#69 |
| 70. | Hoffman | 0.44% | 0.0062%(+0.435)#2 | 0.0083%(+0.433)#70 |
| 71. | University Park | 0.44% | 0.0023%(+0.435)#1 | 0.0083%(+0.429)#71 |
| 72. | Long Neck | 0.44% | 0.0044%(+0.431)#1 | 0.0083%(+0.427)#72 |
| 73. | Clarion | 0.43% | 0.0011%(+0.428)#1 | 0.0083%(+0.420)#73 |
| 74. | Port Chester | 0.43% | 0.033%(+0.392)#14 | 0.0083%(+0.417)#74 |
| 75. | Manville Borough | 0.42% | 0.029%(+0.394)#15 | 0.0083%(+0.414)#75 |
| 76. | Woodbridge | 0.41% | 0.018%(+0.395)#4 | 0.0083%(+0.405)#76 |
| 77. | Manvel | 0.41% | 0.0054%(+0.403)#1 | 0.0083%(+0.400)#77 |
| 78. | Palm River Clair Mel | 0.41% | 0.018%(+0.390)#5 | 0.0083%(+0.400)#78 |
| 79. | Pittsburg | 0.41% | 0.014%(+0.394)#2 | 0.0083%(+0.399)#79 |
| 80. | Brookhaven Borough | 0.40% | 0.0065%(+0.393)#7 | 0.0083%(+0.391)#80 |
| 81. | Libertytown | 0.39% | 0.019%(+0.373)#5 | 0.0083%(+0.384)#81 |
| 82. | River Edge Borough | 0.39% | 0.029%(+0.362)#16 | 0.0083%(+0.383)#82 |
| 83. | King City | 0.39% | 0.0038%(+0.382)#2 | 0.0083%(+0.378)#83 |
| 84. | Lake California | 0.38% | 0.0038%(+0.381)#3 | 0.0083%(+0.376)#84 |
| 85. | Cartersville | 0.38% | 0.0041%(+0.377)#3 | 0.0083%(+0.373)#85 |
| 86. | Floral Park | 0.38% | 0.033%(+0.344)#15 | 0.0083%(+0.369)#86 |
| 87. | Poughkeepsie | 0.35% | 0.033%(+0.320)#16 | 0.0083%(+0.345)#87 |
| 88. | Isabela | 0.35% | 0.0024%(+0.344)#1 | 0.0083%(+0.338)#88 |
| 89. | Woodburn | 0.34% | 0.018%(+0.324)#5 | 0.0083%(+0.333)#89 |
| 90. | Bound Brook Borough | 0.34% | 0.029%(+0.307)#17 | 0.0083%(+0.328)#90 |
| 91. | White Plains | 0.32% | 0.033%(+0.292)#17 | 0.0083%(+0.316)#91 |
| 92. | West Hempstead | 0.32% | 0.033%(+0.290)#18 | 0.0083%(+0.315)#92 |
| 93. | Shorewood | 0.31% | 0.0097%(+0.304)#3 | 0.0083%(+0.305)#93 |
| 94. | Merrick | 0.30% | 0.033%(+0.272)#19 | 0.0083%(+0.296)#94 |
| 95. | Three Lakes | 0.30% | 0.018%(+0.283)#6 | 0.0083%(+0.293)#95 |
| 96. | Southwest Greensburg Borough | 0.30% | 0.0065%(+0.292)#8 | 0.0083%(+0.290)#96 |
| 97. | Sandy | 0.30% | 0.016%(+0.280)#1 | 0.0083%(+0.288)#97 |
| 98. | Whiteman Afb | 0.29% | 0.0024%(+0.289)#3 | 0.0083%(+0.283)#98 |
| 99. | Bridgeton | 0.29% | 0.0024%(+0.286)#4 | 0.0083%(+0.281)#99 |
| 100. | Tuxedo Park | 0.29% | 0.033%(+0.253)#20 | 0.0083%(+0.277)#100 |
Common Questions
What are the Top 10 Cities with the Highest Percentage of Paraguayan Population in the United States?
Top 10 Cities with the Highest Percentage of Paraguayan Population in the United States are:
#1
6.90%
#2
4.37%
#3
4.21%
#4
3.12%
#5
2.81%
#6
2.55%
#7
2.41%
#8
2.36%
#9
2.11%
#10
2.04%
What city has the Highest Percentage of Paraguayan Population in the United States?
Laporte has the Highest Percentage of Paraguayan Population in the United States with 6.90%.
What is the Percentage of Paraguayan Population in the United States?
Percentage of Paraguayan Population in the United States is 0.0083%.