Travilah, MD Map & Demographics
Travilah Map
Travilah Overview
$115,651
PER CAPITA INCOME
$250,001
AVG FAMILY INCOME
$248,703
AVG HOUSEHOLD INCOME
44.2%
WAGE / INCOME GAP [ % ]
55.8¢/ $1
WAGE / INCOME GAP [ $ ]
0.44
INEQUALITY / GINI INDEX
10,846
TOTAL POPULATION
5,458
MALE POPULATION
5,388
FEMALE POPULATION
101.30
MALES / 100 FEMALES
98.72
FEMALES / 100 MALES
50.8
MEDIAN AGE
3.1
AVG FAMILY SIZE
2.9
AVG HOUSEHOLD SIZE
5,716
LABOR FORCE [ PEOPLE ]
62.9%
PERCENT IN LABOR FORCE
3.7%
UNEMPLOYMENT RATE
Income in Travilah
Income Overview in Travilah
Per Capita Income in Travilah is $115,651, while median incomes of families and households are $250,001 and $248,703 respectively.
| Characteristic | Number | Measure |
| Per Capita Income | 10,846 | $115,651 |
| Median Family Income | 3,308 | $250,001 |
| Mean Family Income | 3,308 | $357,083 |
| Median Household Income | 3,703 | $248,703 |
| Mean Household Income | 3,703 | $334,773 |
| Income Deficit | 3,308 | $0 |
| Wage / Income Gap (%) | 10,846 | 44.21% |
| Wage / Income Gap ($) | 10,846 | 55.79¢ per $1 |
| Gini / Inequality Index | 10,846 | 0.44 |
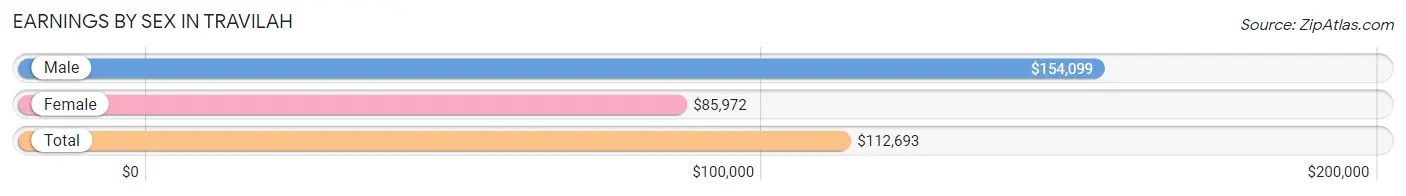
Earnings by Sex in Travilah
Average Earnings in Travilah are $112,693, $154,099 for men and $85,972 for women, a difference of 44.2%.
| Sex | Number | Average Earnings |
| Male | 3,309 (55.6%) | $154,099 |
| Female | 2,640 (44.4%) | $85,972 |
| Total | 5,949 (100.0%) | $112,693 |
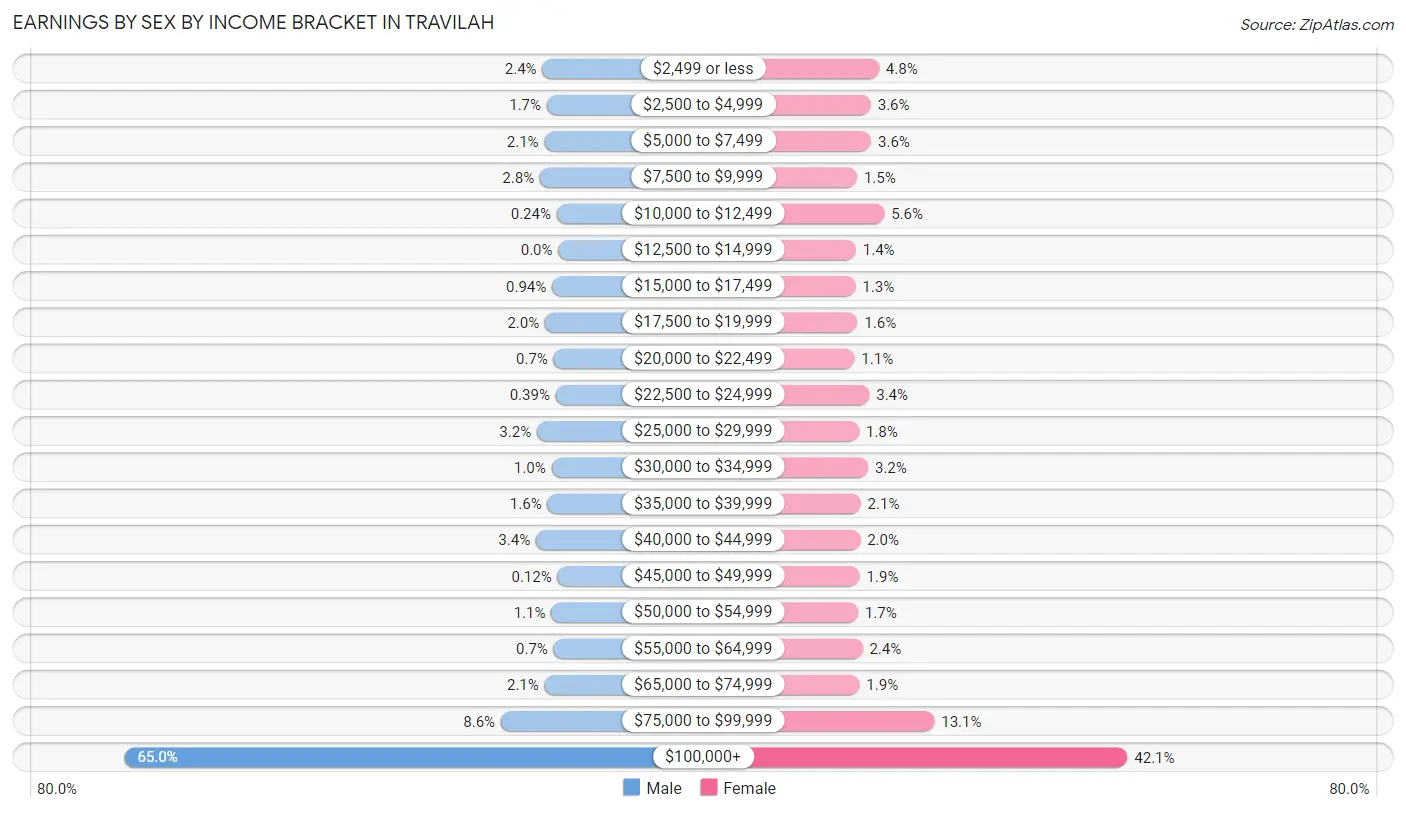
Earnings by Sex by Income Bracket in Travilah
The most common earnings brackets in Travilah are $100,000+ for men (2,152 | 65.0%) and $100,000+ for women (1,110 | 42.0%).
| Income | Male | Female |
| $2,499 or less | 79 (2.4%) | 127 (4.8%) |
| $2,500 to $4,999 | 57 (1.7%) | 95 (3.6%) |
| $5,000 to $7,499 | 69 (2.1%) | 96 (3.6%) |
| $7,500 to $9,999 | 91 (2.8%) | 40 (1.5%) |
| $10,000 to $12,499 | 8 (0.2%) | 148 (5.6%) |
| $12,500 to $14,999 | 0 (0.0%) | 36 (1.4%) |
| $15,000 to $17,499 | 31 (0.9%) | 34 (1.3%) |
| $17,500 to $19,999 | 66 (2.0%) | 42 (1.6%) |
| $20,000 to $22,499 | 23 (0.7%) | 30 (1.1%) |
| $22,500 to $24,999 | 13 (0.4%) | 89 (3.4%) |
| $25,000 to $29,999 | 106 (3.2%) | 48 (1.8%) |
| $30,000 to $34,999 | 34 (1.0%) | 84 (3.2%) |
| $35,000 to $39,999 | 54 (1.6%) | 55 (2.1%) |
| $40,000 to $44,999 | 111 (3.4%) | 53 (2.0%) |
| $45,000 to $49,999 | 4 (0.1%) | 51 (1.9%) |
| $50,000 to $54,999 | 35 (1.1%) | 44 (1.7%) |
| $55,000 to $64,999 | 23 (0.7%) | 62 (2.4%) |
| $65,000 to $74,999 | 68 (2.1%) | 50 (1.9%) |
| $75,000 to $99,999 | 285 (8.6%) | 346 (13.1%) |
| $100,000+ | 2,152 (65.0%) | 1,110 (42.0%) |
| Total | 3,309 (100.0%) | 2,640 (100.0%) |
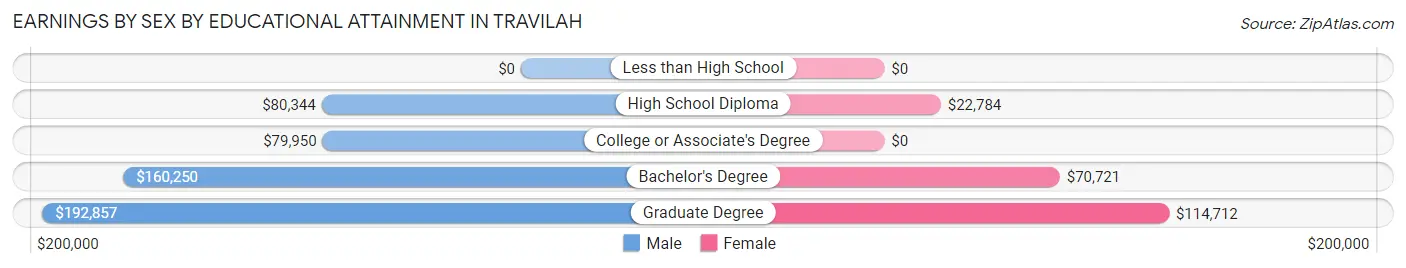
Earnings by Sex by Educational Attainment in Travilah
Average earnings in Travilah are $164,700 for men and $99,083 for women, a difference of 39.8%. Men with an educational attainment of graduate degree enjoy the highest average annual earnings of $192,857, while those with college or associate's degree education earn the least with $79,950. Women with an educational attainment of graduate degree earn the most with the average annual earnings of $114,712, while those with high school diploma education have the smallest earnings of $22,784.
| Educational Attainment | Male Income | Female Income |
| Less than High School | - | - |
| High School Diploma | $80,344 | $22,784 |
| College or Associate's Degree | $79,950 | $0 |
| Bachelor's Degree | $160,250 | $70,721 |
| Graduate Degree | $192,857 | $114,712 |
| Total | $164,700 | $99,083 |
Family Income in Travilah
Family Income Brackets in Travilah
According to the Travilah family income data, there are 2,154 families falling into the $200,000+ income range, which is the most common income bracket and makes up 65.1% of all families.
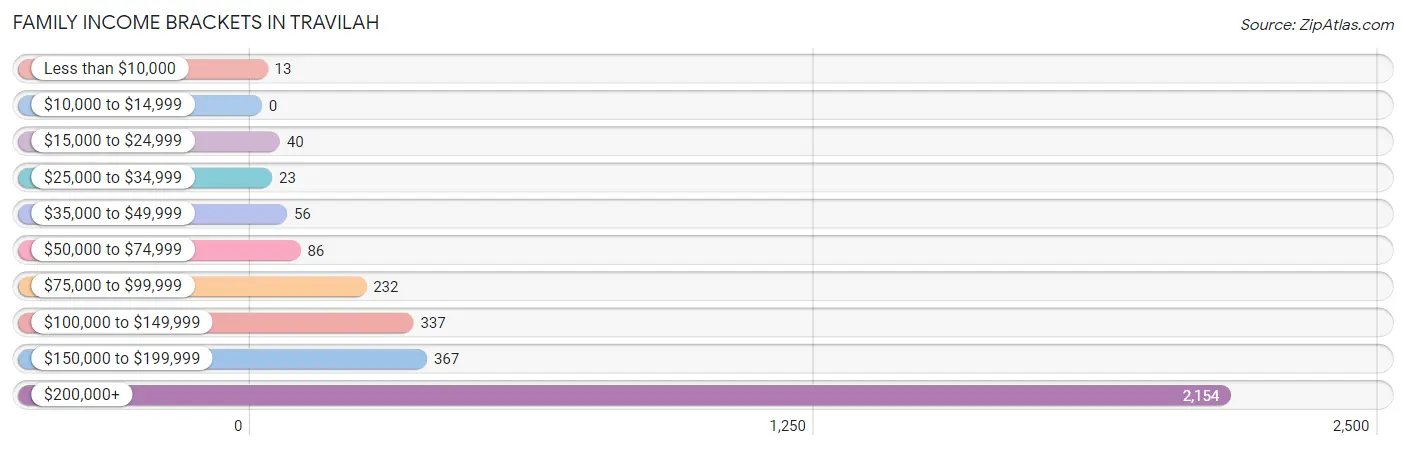
| Income Bracket | # Families | % Families |
| Less than $10,000 | 13 | 0.4% |
| $10,000 to $14,999 | 0 | 0.0% |
| $15,000 to $24,999 | 40 | 1.2% |
| $25,000 to $34,999 | 23 | 0.7% |
| $35,000 to $49,999 | 56 | 1.7% |
| $50,000 to $74,999 | 86 | 2.6% |
| $75,000 to $99,999 | 232 | 7.0% |
| $100,000 to $149,999 | 337 | 10.2% |
| $150,000 to $199,999 | 367 | 11.1% |
| $200,000+ | 2,154 | 65.1% |
Family Income by Famaliy Size in Travilah
3-person families (679 | 20.5%) account for the highest median family income in Travilah with $250,001 per family, while 2-person families (1,578 | 47.7%) have the highest median income of $109,231 per family member.
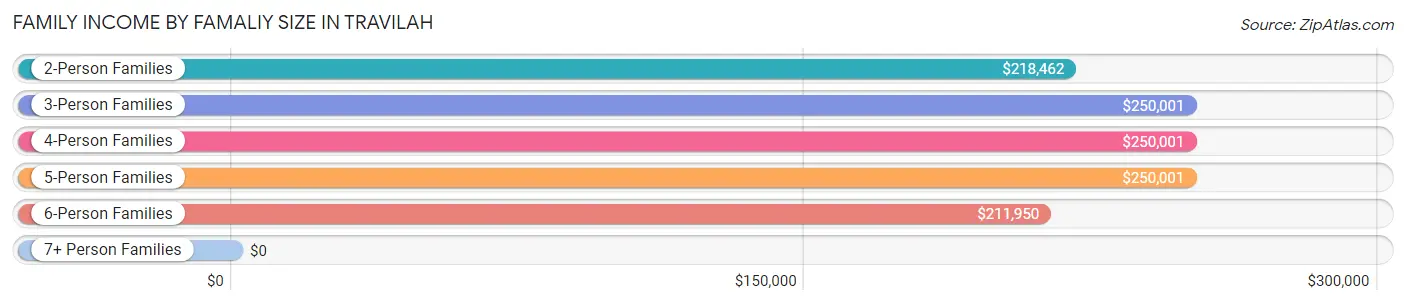
| Income Bracket | # Families | Median Income |
| 2-Person Families | 1,578 (47.7%) | $218,462 |
| 3-Person Families | 679 (20.5%) | $250,001 |
| 4-Person Families | 723 (21.9%) | $250,001 |
| 5-Person Families | 256 (7.7%) | $250,001 |
| 6-Person Families | 55 (1.7%) | $211,950 |
| 7+ Person Families | 17 (0.5%) | $0 |
| Total | 3,308 (100.0%) | $250,001 |
Family Income by Number of Earners in Travilah
The median family income in Travilah is $250,001, with families comprising 2 earners (1,622) having the highest median family income of $250,001, while families with no earners (304) have the lowest median family income of $120,400, accounting for 49.0% and 9.2% of families, respectively.
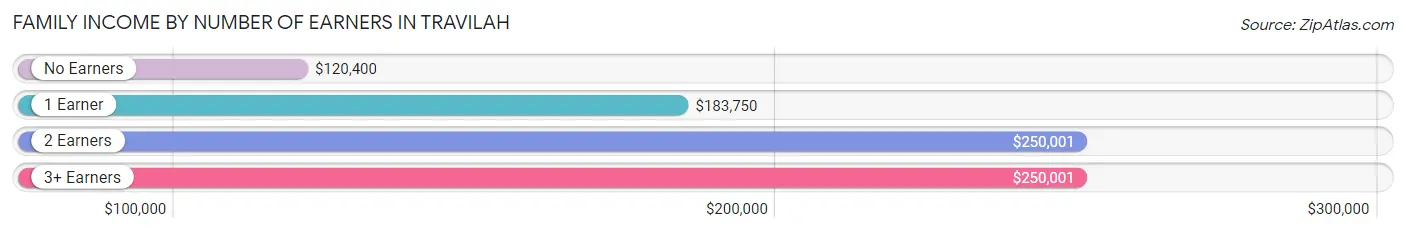
| Number of Earners | # Families | Median Income |
| No Earners | 304 (9.2%) | $120,400 |
| 1 Earner | 1,022 (30.9%) | $183,750 |
| 2 Earners | 1,622 (49.0%) | $250,001 |
| 3+ Earners | 360 (10.9%) | $250,001 |
| Total | 3,308 (100.0%) | $250,001 |
Household Income in Travilah
Household Income Brackets in Travilah
With 2,270 households falling in the category, the $200,000+ income range is the most frequent in Travilah, accounting for 61.3% of all households. In contrast, only 4 households (0.1%) fall into the $10,000 to $14,999 income bracket, making it the least populous group.
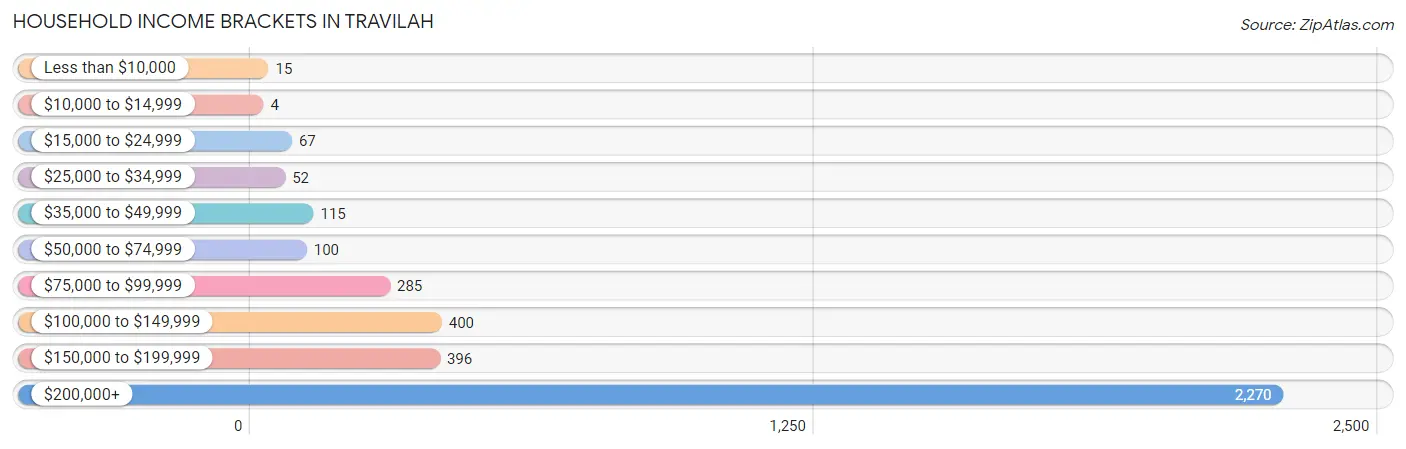
| Income Bracket | # Households | % Households |
| Less than $10,000 | 15 | 0.4% |
| $10,000 to $14,999 | 4 | 0.1% |
| $15,000 to $24,999 | 67 | 1.8% |
| $25,000 to $34,999 | 52 | 1.4% |
| $35,000 to $49,999 | 115 | 3.1% |
| $50,000 to $74,999 | 100 | 2.7% |
| $75,000 to $99,999 | 285 | 7.7% |
| $100,000 to $149,999 | 400 | 10.8% |
| $150,000 to $199,999 | 396 | 10.7% |
| $200,000+ | 2,270 | 61.3% |
Household Income by Householder Age in Travilah
The median household income in Travilah is $248,703, with the highest median household income of $250,001 found in the 25 to 44 years age bracket for the primary householder. A total of 453 households (12.2%) fall into this category. Meanwhile, the 65+ years age bracket for the primary householder has the lowest median household income of $170,227, with 1,142 households (30.8%) in this group.
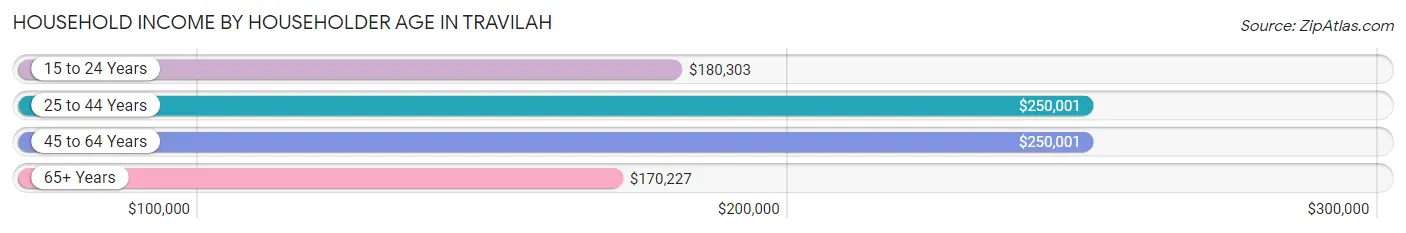
| Income Bracket | # Households | Median Income |
| 15 to 24 Years | 58 (1.6%) | $180,303 |
| 25 to 44 Years | 453 (12.2%) | $250,001 |
| 45 to 64 Years | 2,050 (55.4%) | $250,001 |
| 65+ Years | 1,142 (30.8%) | $170,227 |
| Total | 3,703 (100.0%) | $248,703 |
Poverty in Travilah
Income Below Poverty by Sex and Age in Travilah
With 0.9% poverty level for males and 1.9% for females among the residents of Travilah, 18 to 24 year old males and 55 to 64 year old females are the most vulnerable to poverty, with 31 males (9.3%) and 60 females (5.8%) in their respective age groups living below the poverty level.
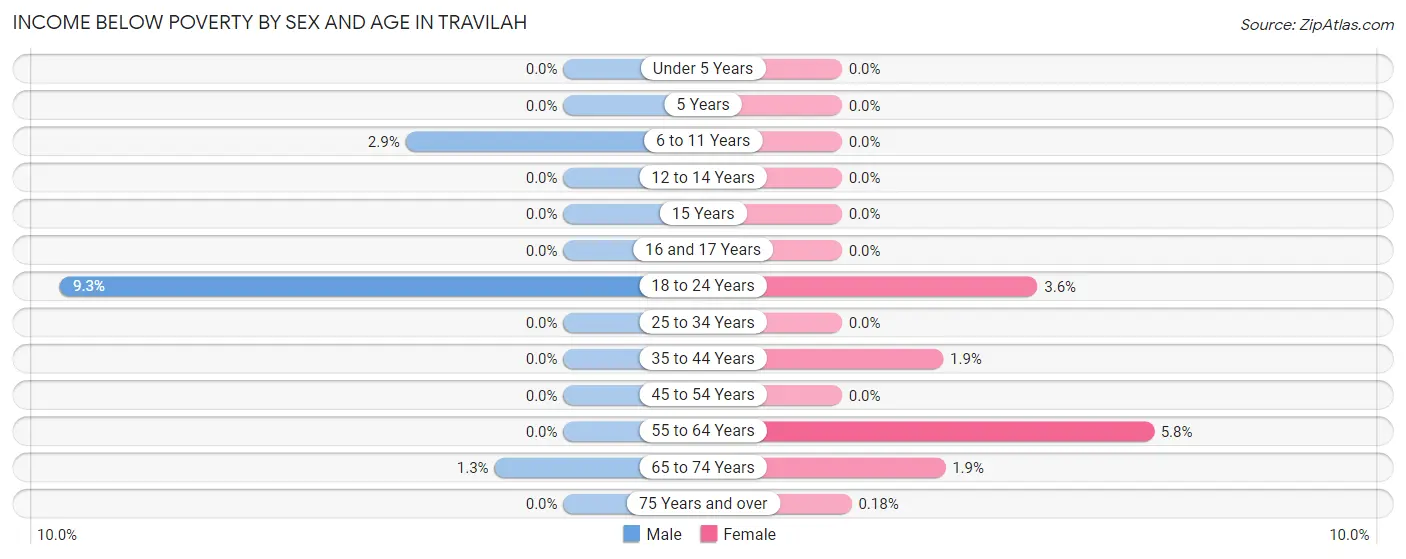
| Age Bracket | Male | Female |
| Under 5 Years | 0 (0.0%) | 0 (0.0%) |
| 5 Years | 0 (0.0%) | 0 (0.0%) |
| 6 to 11 Years | 10 (2.9%) | 0 (0.0%) |
| 12 to 14 Years | 0 (0.0%) | 0 (0.0%) |
| 15 Years | 0 (0.0%) | 0 (0.0%) |
| 16 and 17 Years | 0 (0.0%) | 0 (0.0%) |
| 18 to 24 Years | 31 (9.3%) | 20 (3.6%) |
| 25 to 34 Years | 0 (0.0%) | 0 (0.0%) |
| 35 to 44 Years | 0 (0.0%) | 8 (1.9%) |
| 45 to 54 Years | 0 (0.0%) | 0 (0.0%) |
| 55 to 64 Years | 0 (0.0%) | 60 (5.8%) |
| 65 to 74 Years | 9 (1.3%) | 12 (1.9%) |
| 75 Years and over | 0 (0.0%) | 1 (0.2%) |
| Total | 50 (0.9%) | 101 (1.9%) |
Income Above Poverty by Sex and Age in Travilah
According to the poverty statistics in Travilah, males aged under 5 years and females aged under 5 years are the age groups that are most secure financially, with 100.0% of males and 100.0% of females in these age groups living above the poverty line.
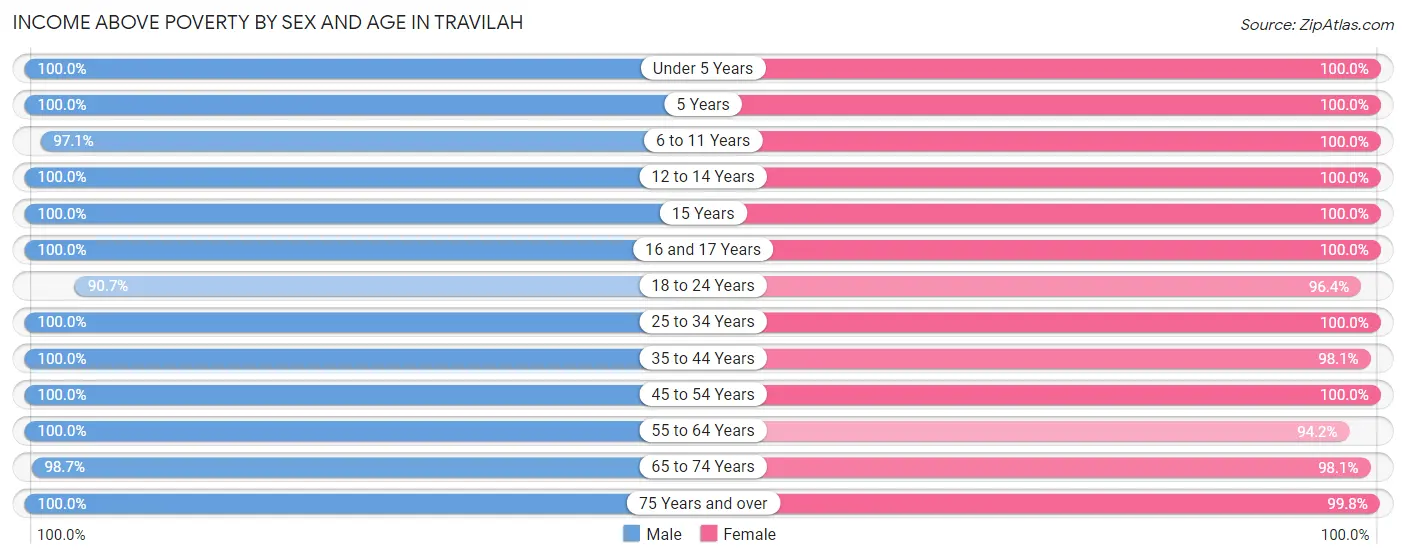
| Age Bracket | Male | Female |
| Under 5 Years | 289 (100.0%) | 167 (100.0%) |
| 5 Years | 33 (100.0%) | 16 (100.0%) |
| 6 to 11 Years | 331 (97.1%) | 295 (100.0%) |
| 12 to 14 Years | 239 (100.0%) | 253 (100.0%) |
| 15 Years | 71 (100.0%) | 44 (100.0%) |
| 16 and 17 Years | 201 (100.0%) | 228 (100.0%) |
| 18 to 24 Years | 301 (90.7%) | 531 (96.4%) |
| 25 to 34 Years | 243 (100.0%) | 196 (100.0%) |
| 35 to 44 Years | 430 (100.0%) | 417 (98.1%) |
| 45 to 54 Years | 1,043 (100.0%) | 990 (100.0%) |
| 55 to 64 Years | 1,059 (100.0%) | 976 (94.2%) |
| 65 to 74 Years | 694 (98.7%) | 612 (98.1%) |
| 75 Years and over | 464 (100.0%) | 562 (99.8%) |
| Total | 5,398 (99.1%) | 5,287 (98.1%) |
Income Below Poverty Among Married-Couple Families in Travilah
The poverty statistics for married-couple families in Travilah show that 0.4% or 13 of the total 2,937 families live below the poverty line. Families with no children have the highest poverty rate of 0.7%, comprising of 13 families. On the other hand, families with 1 or 2 children have the lowest poverty rate of 0.0%, which includes 0 families.
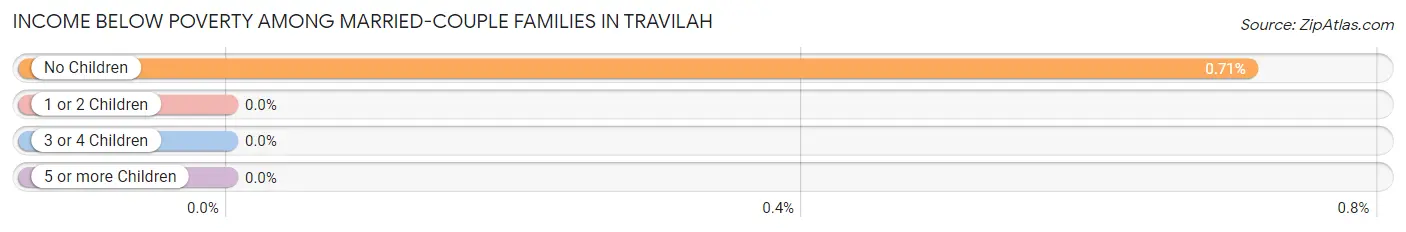
| Children | Above Poverty | Below Poverty |
| No Children | 1,812 (99.3%) | 13 (0.7%) |
| 1 or 2 Children | 953 (100.0%) | 0 (0.0%) |
| 3 or 4 Children | 152 (100.0%) | 0 (0.0%) |
| 5 or more Children | 7 (100.0%) | 0 (0.0%) |
| Total | 2,924 (99.6%) | 13 (0.4%) |
Income Below Poverty Among Single-Parent Households in Travilah
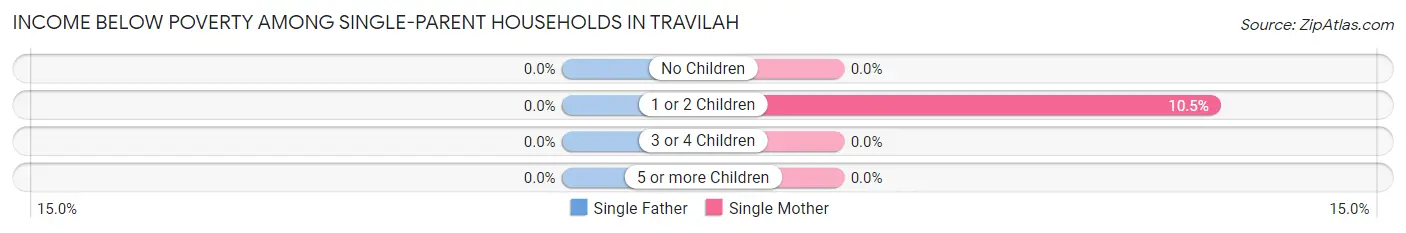
| Children | Single Father | Single Mother |
| No Children | 0 (0.0%) | 0 (0.0%) |
| 1 or 2 Children | 0 (0.0%) | 8 (10.5%) |
| 3 or 4 Children | 0 (0.0%) | 0 (0.0%) |
| 5 or more Children | 0 (0.0%) | 0 (0.0%) |
| Total | 0 (0.0%) | 8 (2.9%) |
Income Below Poverty Among Married-Couple vs Single-Parent Households in Travilah
The poverty data for Travilah shows that 13 of the married-couple family households (0.4%) and 8 of the single-parent households (2.2%) are living below the poverty level. Within the married-couple family households, those with no children have the highest poverty rate, with 13 households (0.7%) falling below the poverty line. Among the single-parent households, those with 1 or 2 children have the highest poverty rate, with 8 household (8.2%) living below poverty.
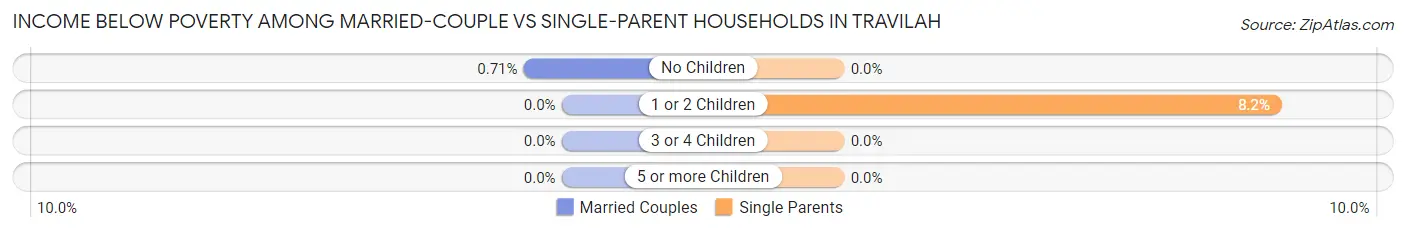
| Children | Married-Couple Families | Single-Parent Households |
| No Children | 13 (0.7%) | 0 (0.0%) |
| 1 or 2 Children | 0 (0.0%) | 8 (8.2%) |
| 3 or 4 Children | 0 (0.0%) | 0 (0.0%) |
| 5 or more Children | 0 (0.0%) | 0 (0.0%) |
| Total | 13 (0.4%) | 8 (2.2%) |
Race in Travilah
The most populous races in Travilah are White / Caucasian (6,106 | 56.3%), Asian (3,384 | 31.2%), and Black / African American (615 | 5.7%).
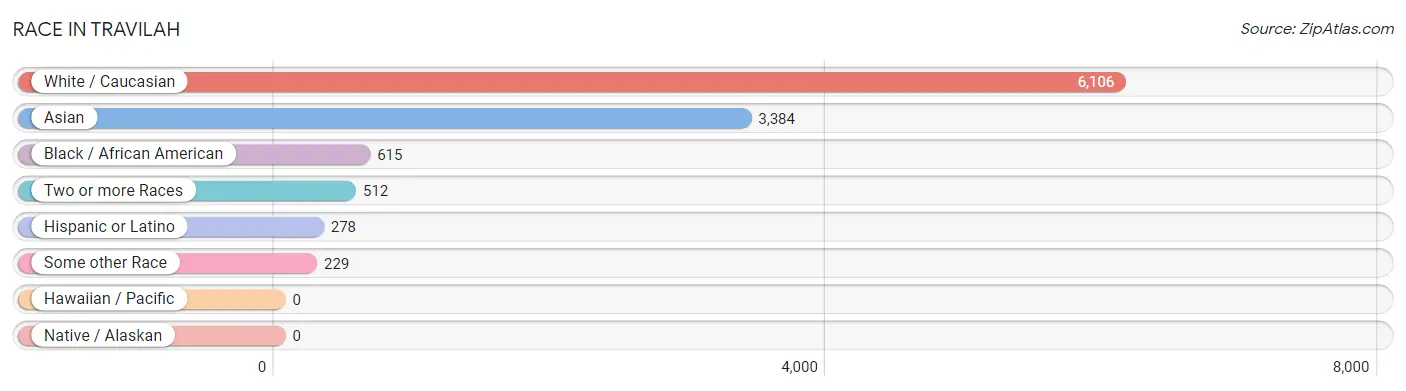
| Race | # Population | % Population |
| Asian | 3,384 | 31.2% |
| Black / African American | 615 | 5.7% |
| Hawaiian / Pacific | 0 | 0.0% |
| Hispanic or Latino | 278 | 2.6% |
| Native / Alaskan | 0 | 0.0% |
| White / Caucasian | 6,106 | 56.3% |
| Two or more Races | 512 | 4.7% |
| Some other Race | 229 | 2.1% |
| Total | 10,846 | 100.0% |
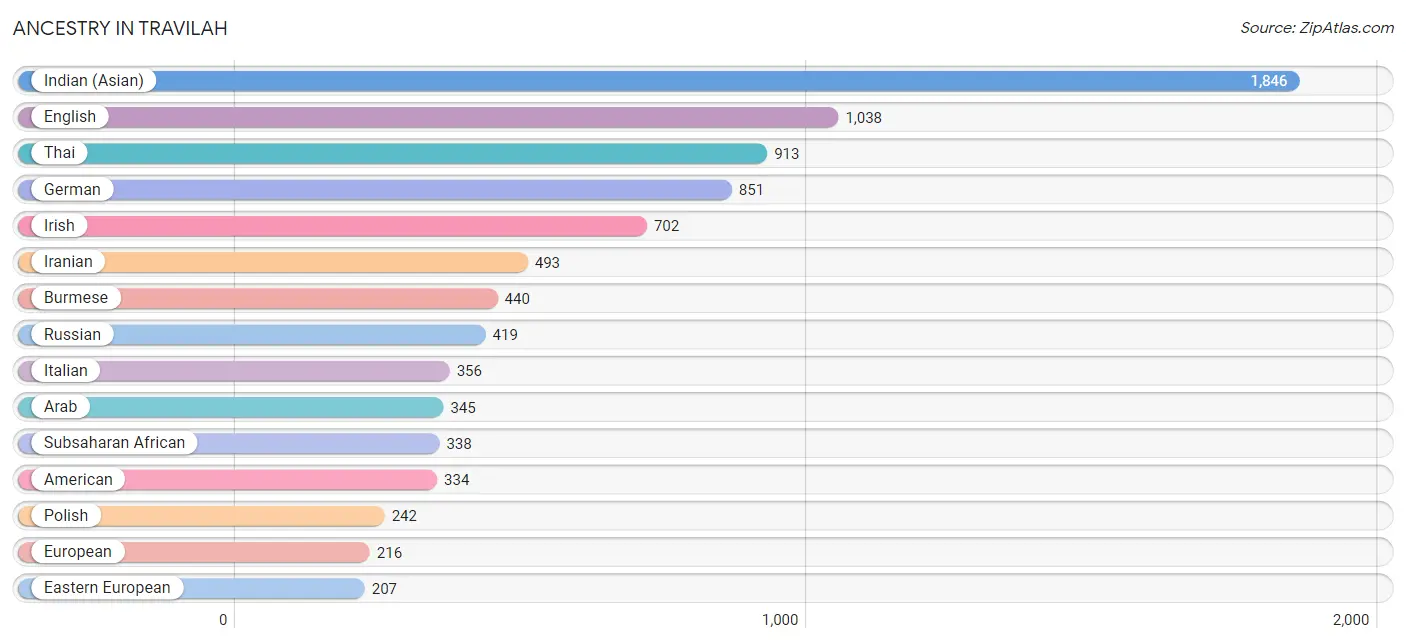
Ancestry in Travilah
The most populous ancestries reported in Travilah are Indian (Asian) (1,846 | 17.0%), English (1,038 | 9.6%), Thai (913 | 8.4%), German (851 | 7.9%), and Irish (702 | 6.5%), together accounting for 49.3% of all Travilah residents.
| Ancestry | # Population | % Population |
| African | 23 | 0.2% |
| American | 334 | 3.1% |
| Arab | 345 | 3.2% |
| Armenian | 60 | 0.5% |
| Bhutanese | 41 | 0.4% |
| Brazilian | 7 | 0.1% |
| British | 20 | 0.2% |
| Burmese | 440 | 4.1% |
| Canadian | 81 | 0.7% |
| Central American | 11 | 0.1% |
| Cherokee | 13 | 0.1% |
| Colombian | 37 | 0.3% |
| Cuban | 21 | 0.2% |
| Czech | 61 | 0.6% |
| Czechoslovakian | 36 | 0.3% |
| Dominican | 32 | 0.3% |
| Dutch | 139 | 1.3% |
| Eastern European | 207 | 1.9% |
| Ecuadorian | 10 | 0.1% |
| Egyptian | 49 | 0.4% |
| English | 1,038 | 9.6% |
| Ethiopian | 12 | 0.1% |
| European | 216 | 2.0% |
| Filipino | 59 | 0.5% |
| French | 65 | 0.6% |
| French Canadian | 94 | 0.9% |
| German | 851 | 7.9% |
| Ghanaian | 80 | 0.7% |
| Greek | 109 | 1.0% |
| Guamanian / Chamorro | 2 | 0.0% |
| Hungarian | 31 | 0.3% |
| Indian (Asian) | 1,846 | 17.0% |
| Indonesian | 27 | 0.3% |
| Iranian | 493 | 4.5% |
| Irish | 702 | 6.5% |
| Israeli | 9 | 0.1% |
| Italian | 356 | 3.3% |
| Jamaican | 96 | 0.9% |
| Korean | 43 | 0.4% |
| Latvian | 9 | 0.1% |
| Lebanese | 5 | 0.1% |
| Lithuanian | 28 | 0.3% |
| Mexican | 83 | 0.8% |
| Moroccan | 9 | 0.1% |
| Nigerian | 107 | 1.0% |
| Northern European | 20 | 0.2% |
| Norwegian | 100 | 0.9% |
| Pakistani | 45 | 0.4% |
| Panamanian | 11 | 0.1% |
| Peruvian | 31 | 0.3% |
| Polish | 242 | 2.2% |
| Portuguese | 37 | 0.3% |
| Puerto Rican | 36 | 0.3% |
| Romanian | 59 | 0.5% |
| Russian | 419 | 3.9% |
| Scotch-Irish | 72 | 0.7% |
| Scottish | 191 | 1.8% |
| Serbian | 10 | 0.1% |
| Sierra Leonean | 150 | 1.4% |
| South African | 9 | 0.1% |
| South American | 87 | 0.8% |
| Soviet Union | 8 | 0.1% |
| Spaniard | 8 | 0.1% |
| Sri Lankan | 192 | 1.8% |
| Subsaharan African | 338 | 3.1% |
| Sudanese | 37 | 0.3% |
| Swedish | 30 | 0.3% |
| Swiss | 27 | 0.3% |
| Thai | 913 | 8.4% |
| Turkish | 37 | 0.3% |
| Ukrainian | 113 | 1.0% |
| Venezuelan | 9 | 0.1% |
| Welsh | 41 | 0.4% |
| West Indian | 27 | 0.3% | View All 74 Rows |
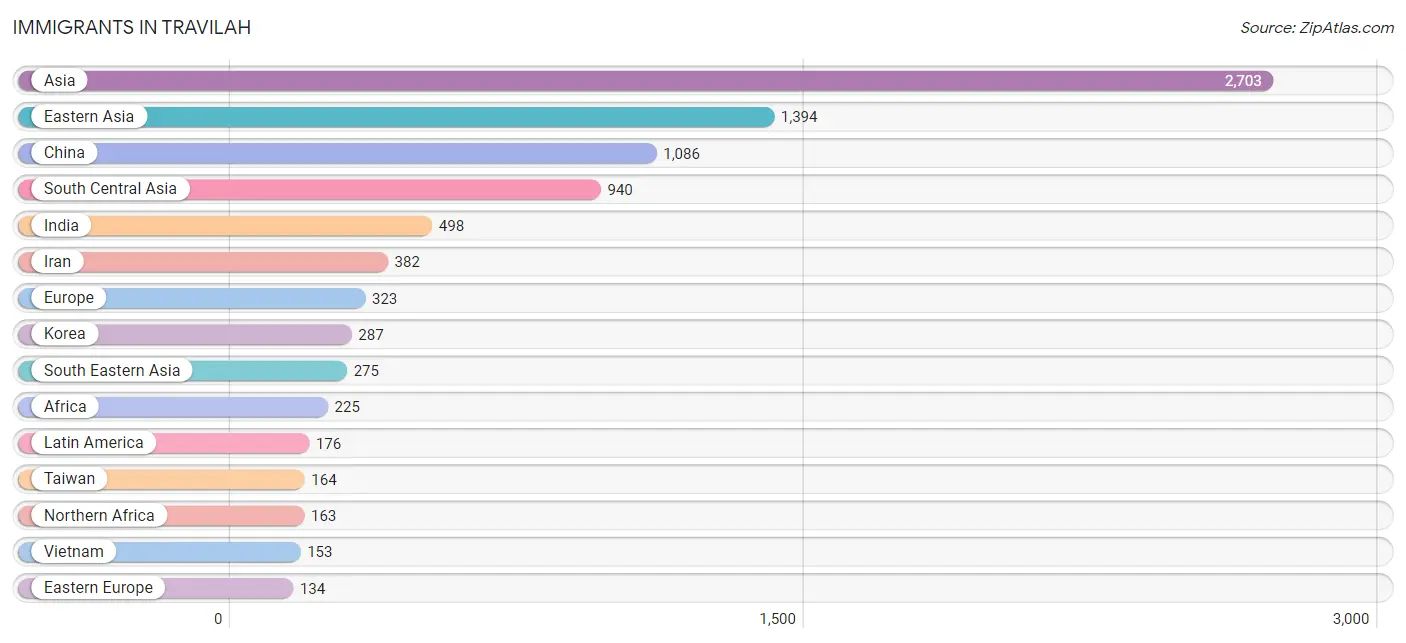
Immigrants in Travilah
The most numerous immigrant groups reported in Travilah came from Asia (2,703 | 24.9%), Eastern Asia (1,394 | 12.9%), China (1,086 | 10.0%), South Central Asia (940 | 8.7%), and India (498 | 4.6%), together accounting for 61.0% of all Travilah residents.
| Immigration Origin | # Population | % Population |
| Africa | 225 | 2.1% |
| Armenia | 19 | 0.2% |
| Asia | 2,703 | 24.9% |
| Bahamas | 9 | 0.1% |
| Belarus | 8 | 0.1% |
| Brazil | 28 | 0.3% |
| Canada | 98 | 0.9% |
| Caribbean | 39 | 0.4% |
| Central America | 45 | 0.4% |
| China | 1,086 | 10.0% |
| Colombia | 33 | 0.3% |
| Costa Rica | 12 | 0.1% |
| Cuba | 30 | 0.3% |
| Eastern Africa | 25 | 0.2% |
| Eastern Asia | 1,394 | 12.9% |
| Eastern Europe | 134 | 1.2% |
| Egypt | 117 | 1.1% |
| England | 11 | 0.1% |
| Eritrea | 12 | 0.1% |
| Europe | 323 | 3.0% |
| France | 51 | 0.5% |
| Germany | 9 | 0.1% |
| Hong Kong | 11 | 0.1% |
| India | 498 | 4.6% |
| Iran | 382 | 3.5% |
| Israel | 30 | 0.3% |
| Italy | 23 | 0.2% |
| Japan | 21 | 0.2% |
| Korea | 287 | 2.6% |
| Latin America | 176 | 1.6% |
| Malaysia | 30 | 0.3% |
| Mexico | 33 | 0.3% |
| Moldova | 17 | 0.2% |
| Morocco | 9 | 0.1% |
| Netherlands | 65 | 0.6% |
| Nigeria | 28 | 0.3% |
| Northern Africa | 163 | 1.5% |
| Northern Europe | 41 | 0.4% |
| Pakistan | 60 | 0.5% |
| Peru | 31 | 0.3% |
| Philippines | 20 | 0.2% |
| Russia | 71 | 0.6% |
| South Africa | 9 | 0.1% |
| South America | 92 | 0.9% |
| South Central Asia | 940 | 8.7% |
| South Eastern Asia | 275 | 2.5% |
| Southern Europe | 23 | 0.2% |
| Sudan | 37 | 0.3% |
| Taiwan | 164 | 1.5% |
| Thailand | 45 | 0.4% |
| Turkey | 24 | 0.2% |
| Ukraine | 38 | 0.4% |
| Vietnam | 153 | 1.4% |
| Western Africa | 28 | 0.3% |
| Western Asia | 94 | 0.9% |
| Western Europe | 125 | 1.1% | View All 56 Rows |
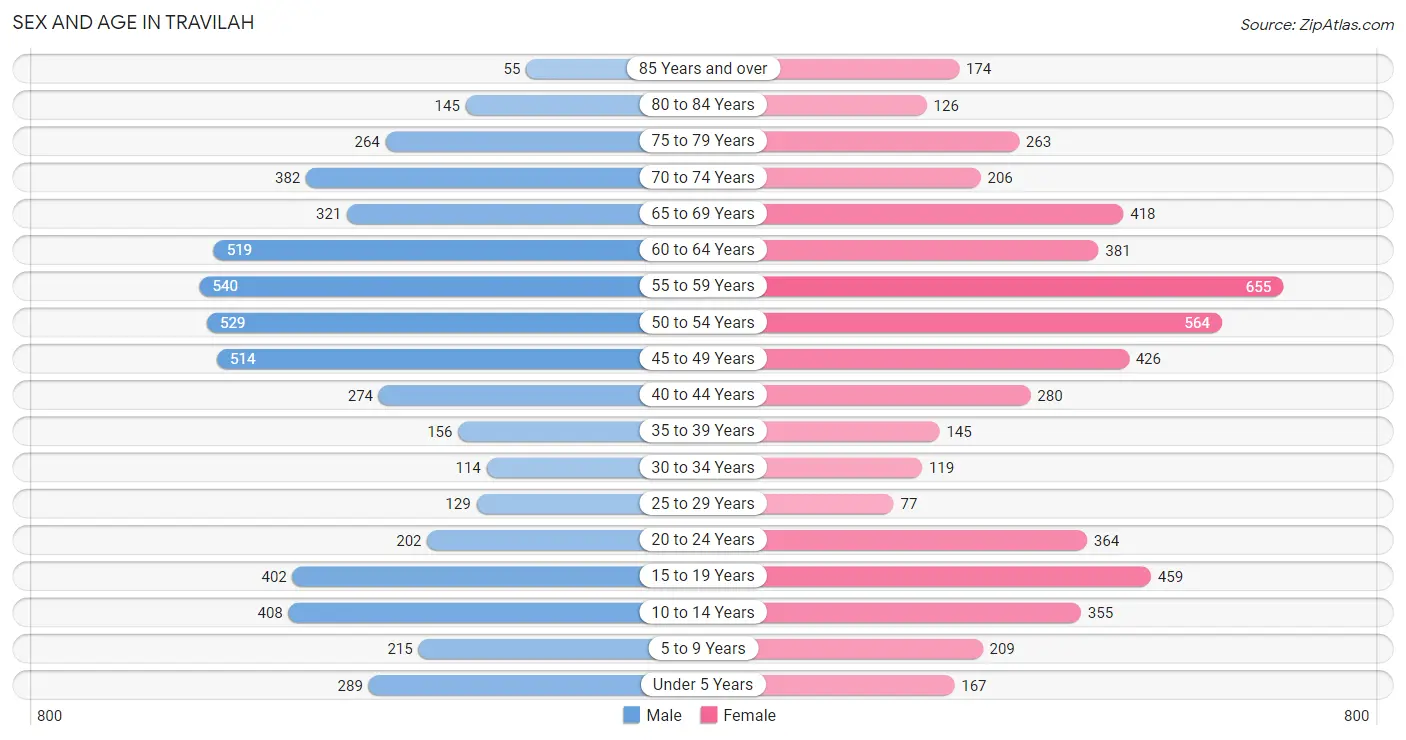
Sex and Age in Travilah
Sex and Age in Travilah
The most populous age groups in Travilah are 55 to 59 Years (540 | 9.9%) for men and 55 to 59 Years (655 | 12.2%) for women.
| Age Bracket | Male | Female |
| Under 5 Years | 289 (5.3%) | 167 (3.1%) |
| 5 to 9 Years | 215 (3.9%) | 209 (3.9%) |
| 10 to 14 Years | 408 (7.5%) | 355 (6.6%) |
| 15 to 19 Years | 402 (7.4%) | 459 (8.5%) |
| 20 to 24 Years | 202 (3.7%) | 364 (6.8%) |
| 25 to 29 Years | 129 (2.4%) | 77 (1.4%) |
| 30 to 34 Years | 114 (2.1%) | 119 (2.2%) |
| 35 to 39 Years | 156 (2.9%) | 145 (2.7%) |
| 40 to 44 Years | 274 (5.0%) | 280 (5.2%) |
| 45 to 49 Years | 514 (9.4%) | 426 (7.9%) |
| 50 to 54 Years | 529 (9.7%) | 564 (10.5%) |
| 55 to 59 Years | 540 (9.9%) | 655 (12.2%) |
| 60 to 64 Years | 519 (9.5%) | 381 (7.1%) |
| 65 to 69 Years | 321 (5.9%) | 418 (7.8%) |
| 70 to 74 Years | 382 (7.0%) | 206 (3.8%) |
| 75 to 79 Years | 264 (4.8%) | 263 (4.9%) |
| 80 to 84 Years | 145 (2.7%) | 126 (2.3%) |
| 85 Years and over | 55 (1.0%) | 174 (3.2%) |
| Total | 5,458 (100.0%) | 5,388 (100.0%) |
Families and Households in Travilah
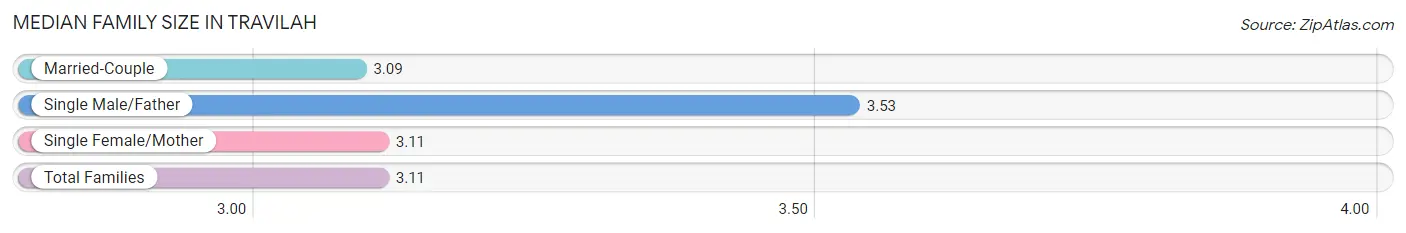
Median Family Size in Travilah
The median family size in Travilah is 3.11 persons per family, with single male/father families (90 | 2.7%) accounting for the largest median family size of 3.53 persons per family. On the other hand, married-couple families (2,937 | 88.8%) represent the smallest median family size with 3.09 persons per family.
| Family Type | # Families | Family Size |
| Married-Couple | 2,937 (88.8%) | 3.09 |
| Single Male/Father | 90 (2.7%) | 3.53 |
| Single Female/Mother | 281 (8.5%) | 3.11 |
| Total Families | 3,308 (100.0%) | 3.11 |
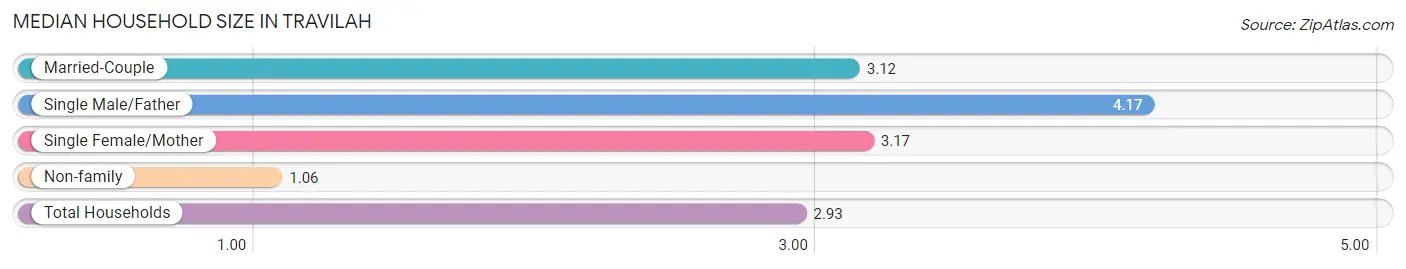
Median Household Size in Travilah
The median household size in Travilah is 2.93 persons per household, with single male/father households (90 | 2.4%) accounting for the largest median household size of 4.17 persons per household. non-family households (395 | 10.7%) represent the smallest median household size with 1.06 persons per household.
| Household Type | # Households | Household Size |
| Married-Couple | 2,937 (79.3%) | 3.12 |
| Single Male/Father | 90 (2.4%) | 4.17 |
| Single Female/Mother | 281 (7.6%) | 3.17 |
| Non-family | 395 (10.7%) | 1.06 |
| Total Households | 3,703 (100.0%) | 2.93 |
Household Size by Marriage Status in Travilah
Out of a total of 3,703 households in Travilah, 3,308 (89.3%) are family households, while 395 (10.7%) are nonfamily households. The most numerous type of family households are 2-person households, comprising 1,574, and the most common type of nonfamily households are 1-person households, comprising 373.
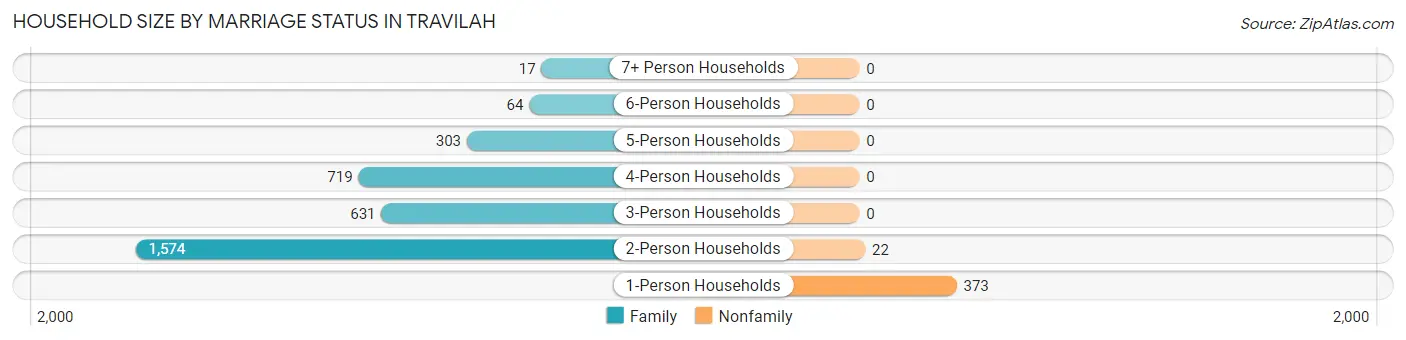
| Household Size | Family Households | Nonfamily Households |
| 1-Person Households | - | 373 (10.1%) |
| 2-Person Households | 1,574 (42.5%) | 22 (0.6%) |
| 3-Person Households | 631 (17.0%) | 0 (0.0%) |
| 4-Person Households | 719 (19.4%) | 0 (0.0%) |
| 5-Person Households | 303 (8.2%) | 0 (0.0%) |
| 6-Person Households | 64 (1.7%) | 0 (0.0%) |
| 7+ Person Households | 17 (0.5%) | 0 (0.0%) |
| Total | 3,308 (89.3%) | 395 (10.7%) |
Female Fertility in Travilah
Fertility by Age in Travilah
Average fertility rate in Travilah is 48.0 births per 1,000 women. Women in the age bracket of 20 to 34 years have the highest fertility rate with 105.0 births per 1,000 women. Women in the age bracket of 20 to 34 years acount for 62.8% of all women with births.
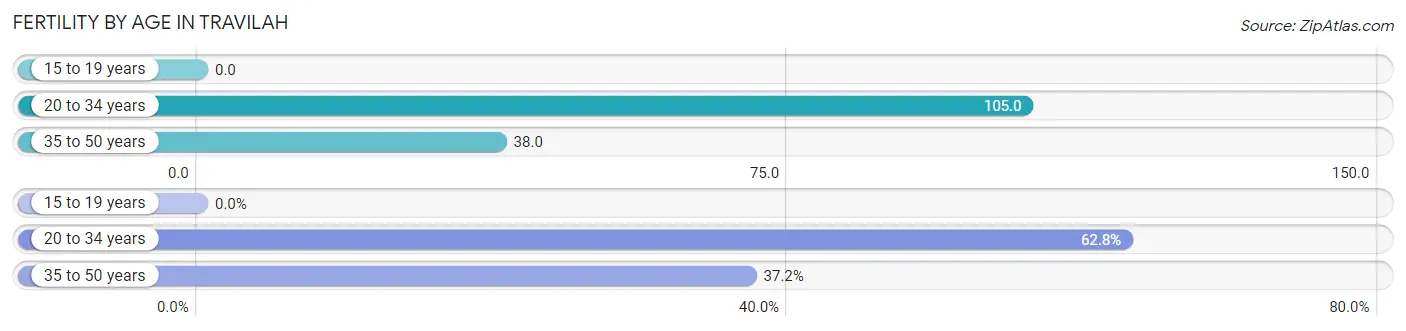
| Age Bracket | Women with Births | Births / 1,000 Women |
| 15 to 19 years | 0 (0.0%) | 0.0 |
| 20 to 34 years | 59 (62.8%) | 105.0 |
| 35 to 50 years | 35 (37.2%) | 38.0 |
| Total | 94 (100.0%) | 48.0 |
Fertility by Age by Marriage Status in Travilah
92.6% of women with births (94) in Travilah are married. The highest percentage of unmarried women with births falls into 20 to 34 years age bracket with 11.9% of them unmarried at the time of birth, while the lowest percentage of unmarried women with births belong to 35 to 50 years age bracket with 0.0% of them unmarried.
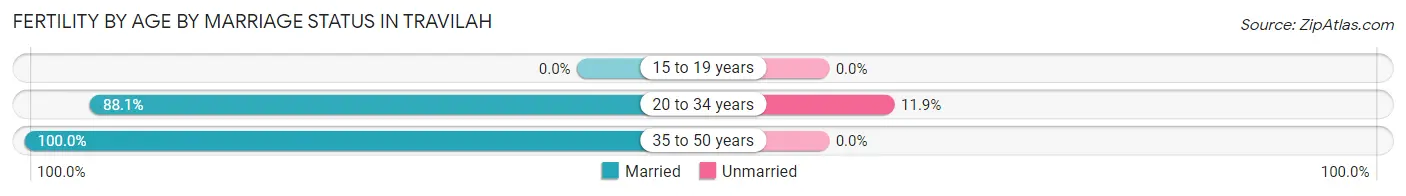
| Age Bracket | Married | Unmarried |
| 15 to 19 years | 0 (0.0%) | 0 (0.0%) |
| 20 to 34 years | 52 (88.1%) | 7 (11.9%) |
| 35 to 50 years | 35 (100.0%) | 0 (0.0%) |
| Total | 87 (92.5%) | 7 (7.4%) |
Fertility by Education in Travilah
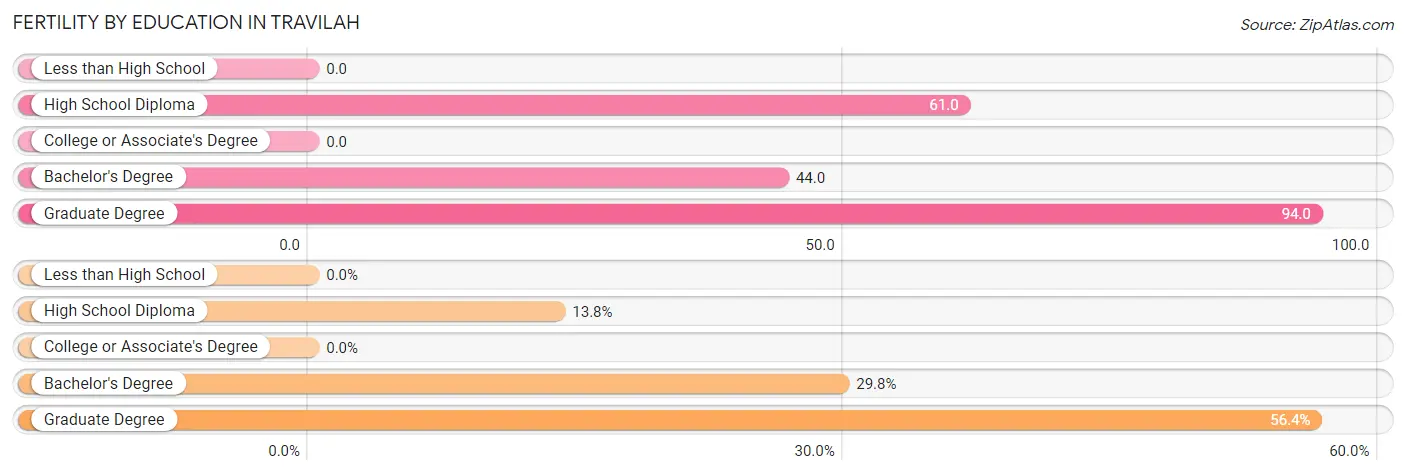
| Educational Attainment | Women with Births | Births / 1,000 Women |
| Less than High School | 0 (0.0%) | 0.0 |
| High School Diploma | 13 (13.8%) | 61.0 |
| College or Associate's Degree | 0 (0.0%) | 0.0 |
| Bachelor's Degree | 28 (29.8%) | 44.0 |
| Graduate Degree | 53 (56.4%) | 94.0 |
| Total | 94 (100.0%) | 48.0 |
Fertility by Education by Marriage Status in Travilah
7.4% of women with births in Travilah are unmarried. Women with the educational attainment of high school diploma are most likely to be married with 100.0% of them married at childbirth, while women with the educational attainment of bachelor's degree are least likely to be married with 25.0% of them unmarried at childbirth.
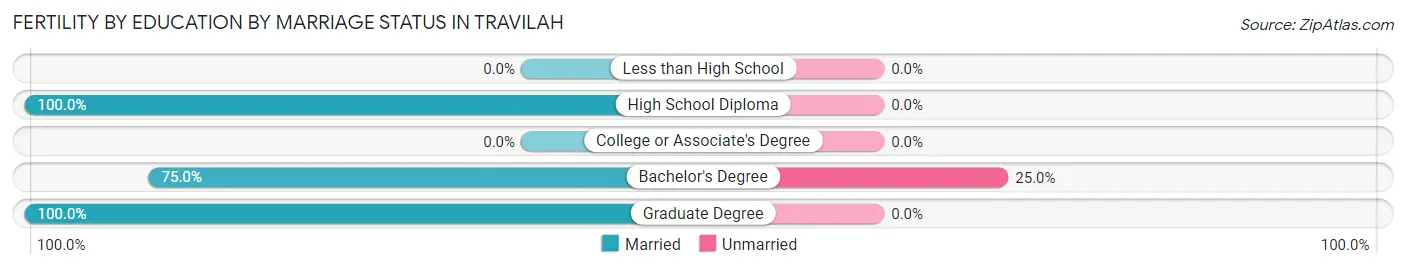
| Educational Attainment | Married | Unmarried |
| Less than High School | 0 (0.0%) | 0 (0.0%) |
| High School Diploma | 13 (100.0%) | 0 (0.0%) |
| College or Associate's Degree | 0 (0.0%) | 0 (0.0%) |
| Bachelor's Degree | 21 (75.0%) | 7 (25.0%) |
| Graduate Degree | 53 (100.0%) | 0 (0.0%) |
| Total | 87 (92.5%) | 7 (7.4%) |
Employment Characteristics in Travilah
Employment by Class of Employer in Travilah
Among the 5,427 employed individuals in Travilah, private company employees (2,596 | 47.8%), federal government employees (934 | 17.2%), and self-employed (incorporated) (667 | 12.3%) make up the most common classes of employment.
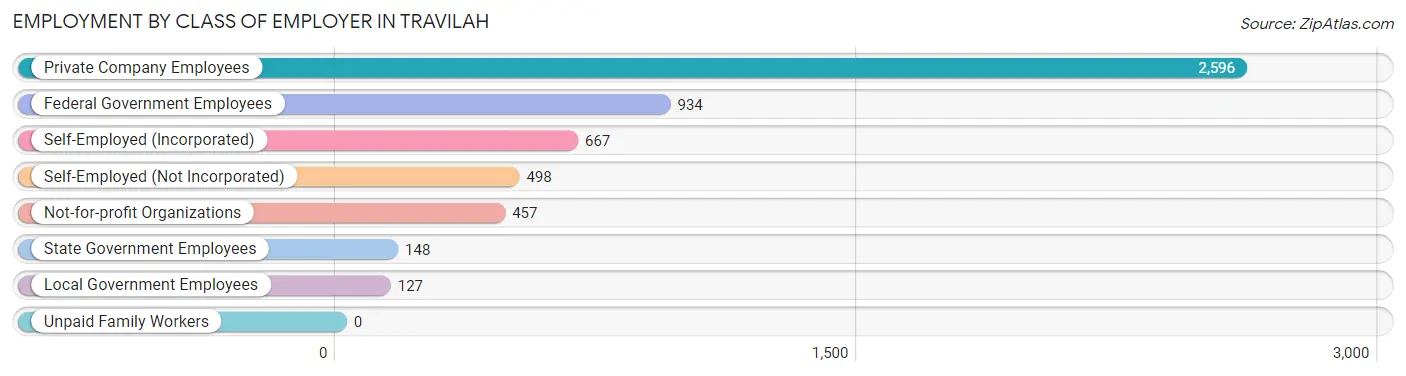
| Employer Class | # Employees | % Employees |
| Private Company Employees | 2,596 | 47.8% |
| Self-Employed (Incorporated) | 667 | 12.3% |
| Self-Employed (Not Incorporated) | 498 | 9.2% |
| Not-for-profit Organizations | 457 | 8.4% |
| Local Government Employees | 127 | 2.3% |
| State Government Employees | 148 | 2.7% |
| Federal Government Employees | 934 | 17.2% |
| Unpaid Family Workers | 0 | 0.0% |
| Total | 5,427 | 100.0% |
Employment Status by Age in Travilah
According to the labor force statistics for Travilah, out of the total population over 16 years of age (9,088), 62.9% or 5,716 individuals are in the labor force, with 3.7% or 211 of them unemployed. The age group with the highest labor force participation rate is 35 to 44 years, with 90.5% or 774 individuals in the labor force. Within the labor force, the 20 to 24 years age range has the highest percentage of unemployed individuals, with 23.3% or 79 of them being unemployed.
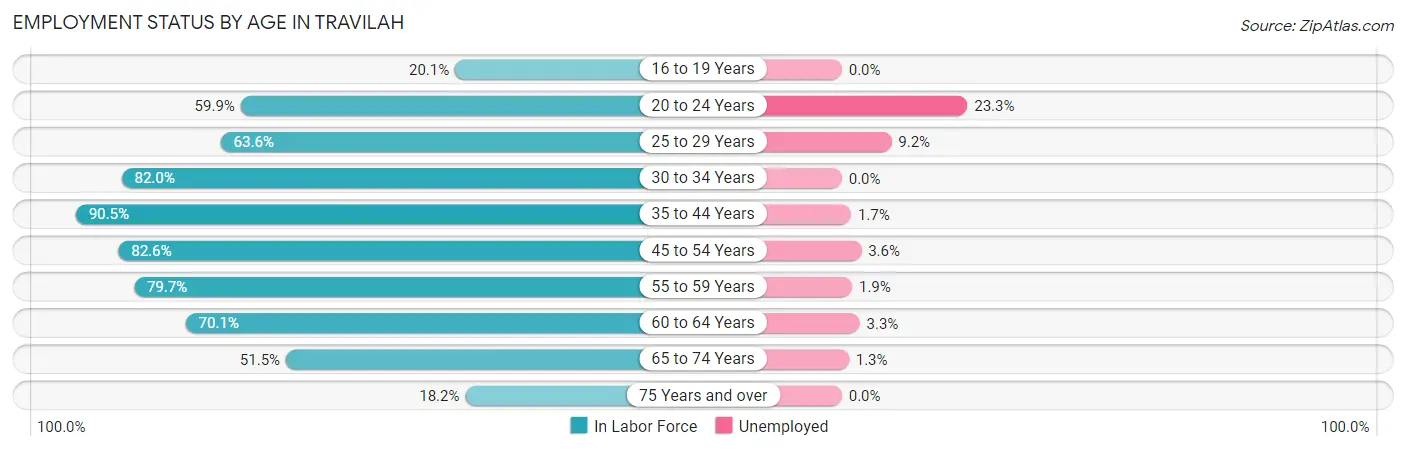
| Age Bracket | In Labor Force | Unemployed |
| 16 to 19 Years | 150 (20.1%) | 0 (0.0%) |
| 20 to 24 Years | 339 (59.9%) | 79 (23.3%) |
| 25 to 29 Years | 131 (63.6%) | 12 (9.2%) |
| 30 to 34 Years | 191 (82.0%) | 0 (0.0%) |
| 35 to 44 Years | 774 (90.5%) | 13 (1.7%) |
| 45 to 54 Years | 1,679 (82.6%) | 60 (3.6%) |
| 55 to 59 Years | 952 (79.7%) | 18 (1.9%) |
| 60 to 64 Years | 631 (70.1%) | 21 (3.3%) |
| 65 to 74 Years | 683 (51.5%) | 9 (1.3%) |
| 75 Years and over | 187 (18.2%) | 0 (0.0%) |
| Total | 5,716 (62.9%) | 211 (3.7%) |
Employment Status by Educational Attainment in Travilah
According to labor force statistics for Travilah, 80.4% of individuals (4,359) out of the total population between 25 and 64 years of age (5,422) are in the labor force, with 2.9% or 126 of them being unemployed. The group with the highest labor force participation rate are those with the educational attainment of bachelor's degree or higher, with 82.9% or 3,838 individuals in the labor force. Within the labor force, individuals with less than high school education have the highest percentage of unemployment, with 17.7% or 14 of them being unemployed.
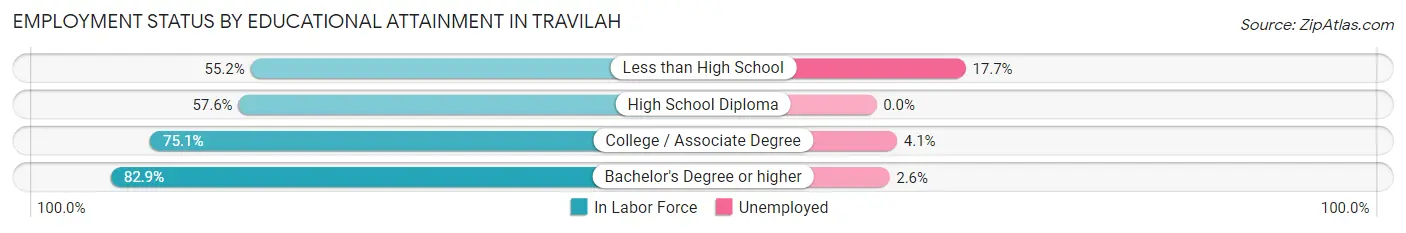
| Educational Attainment | In Labor Force | Unemployed |
| Less than High School | 79 (55.2%) | 25 (17.7%) |
| High School Diploma | 147 (57.6%) | 0 (0.0%) |
| College / Associate Degree | 296 (75.1%) | 16 (4.1%) |
| Bachelor's Degree or higher | 3,838 (82.9%) | 120 (2.6%) |
| Total | 4,359 (80.4%) | 157 (2.9%) |
Employment Occupations by Sex in Travilah
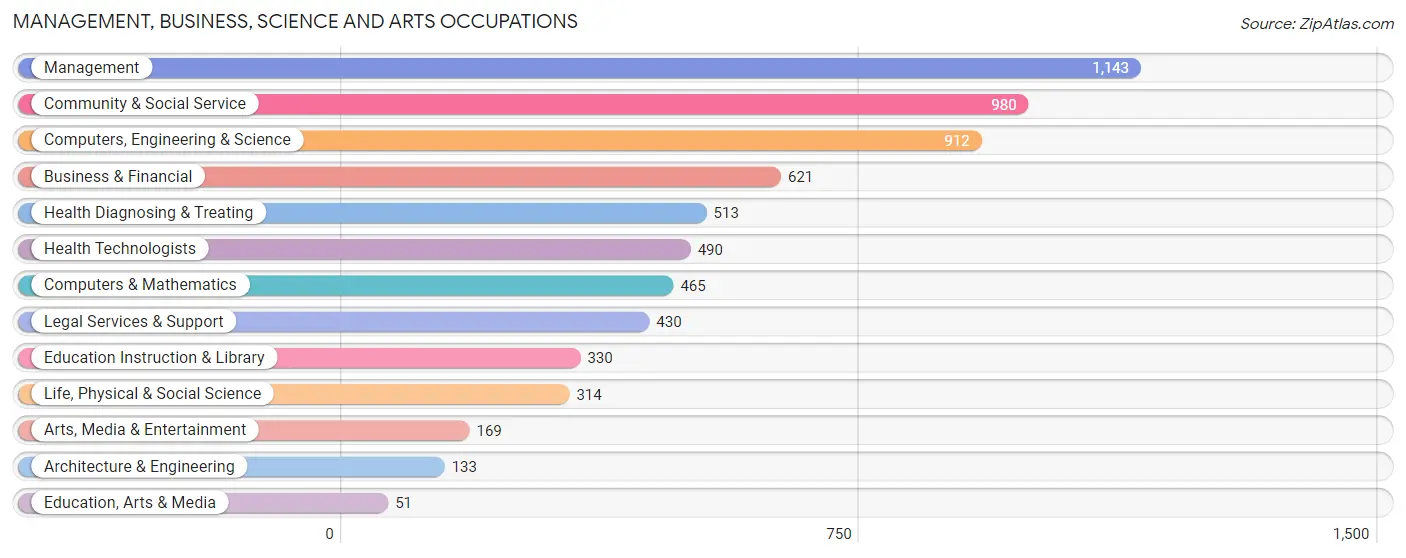
Management, Business, Science and Arts Occupations
The most common Management, Business, Science and Arts occupations in Travilah are Management (1,143 | 20.8%), Community & Social Service (980 | 17.8%), Computers, Engineering & Science (912 | 16.6%), Business & Financial (621 | 11.3%), and Health Diagnosing & Treating (513 | 9.3%).
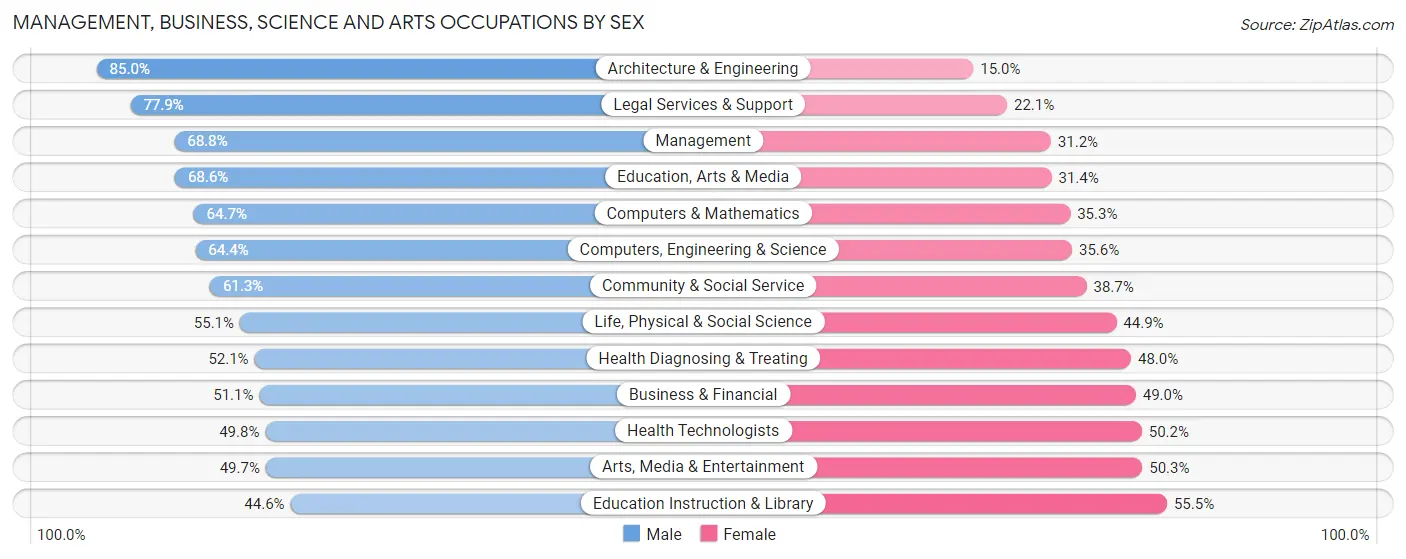
Management, Business, Science and Arts Occupations by Sex
Within the Management, Business, Science and Arts occupations in Travilah, the most male-oriented occupations are Architecture & Engineering (85.0%), Legal Services & Support (77.9%), and Management (68.8%), while the most female-oriented occupations are Education Instruction & Library (55.4%), Arts, Media & Entertainment (50.3%), and Health Technologists (50.2%).
| Occupation | Male | Female |
| Management | 786 (68.8%) | 357 (31.2%) |
| Business & Financial | 317 (51.0%) | 304 (48.9%) |
| Computers, Engineering & Science | 587 (64.4%) | 325 (35.6%) |
| Computers & Mathematics | 301 (64.7%) | 164 (35.3%) |
| Architecture & Engineering | 113 (85.0%) | 20 (15.0%) |
| Life, Physical & Social Science | 173 (55.1%) | 141 (44.9%) |
| Community & Social Service | 601 (61.3%) | 379 (38.7%) |
| Education, Arts & Media | 35 (68.6%) | 16 (31.4%) |
| Legal Services & Support | 335 (77.9%) | 95 (22.1%) |
| Education Instruction & Library | 147 (44.6%) | 183 (55.4%) |
| Arts, Media & Entertainment | 84 (49.7%) | 85 (50.3%) |
| Health Diagnosing & Treating | 267 (52.0%) | 246 (47.9%) |
| Health Technologists | 244 (49.8%) | 246 (50.2%) |
| Total (Category) | 2,558 (61.4%) | 1,611 (38.6%) |
| Total (Overall) | 3,035 (55.3%) | 2,454 (44.7%) |
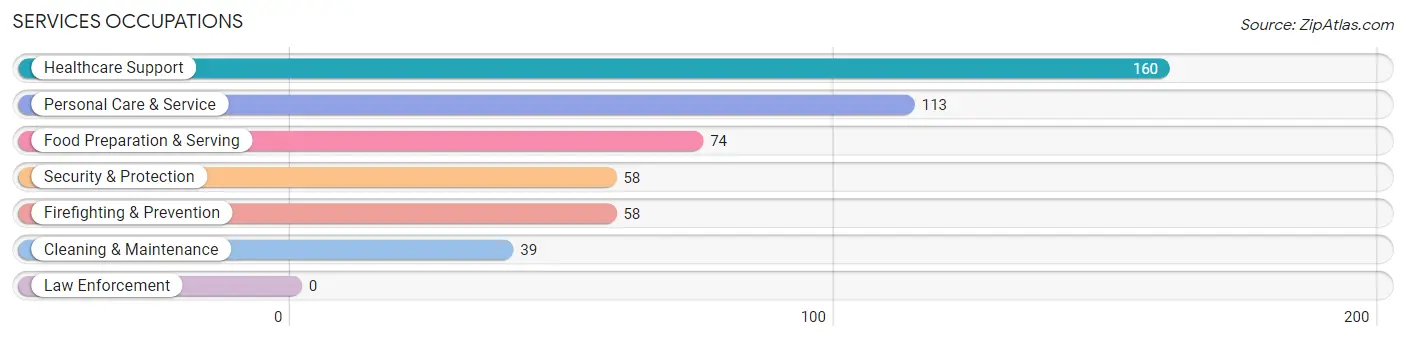
Services Occupations
The most common Services occupations in Travilah are Healthcare Support (160 | 2.9%), Personal Care & Service (113 | 2.1%), Food Preparation & Serving (74 | 1.3%), Security & Protection (58 | 1.1%), and Firefighting & Prevention (58 | 1.1%).
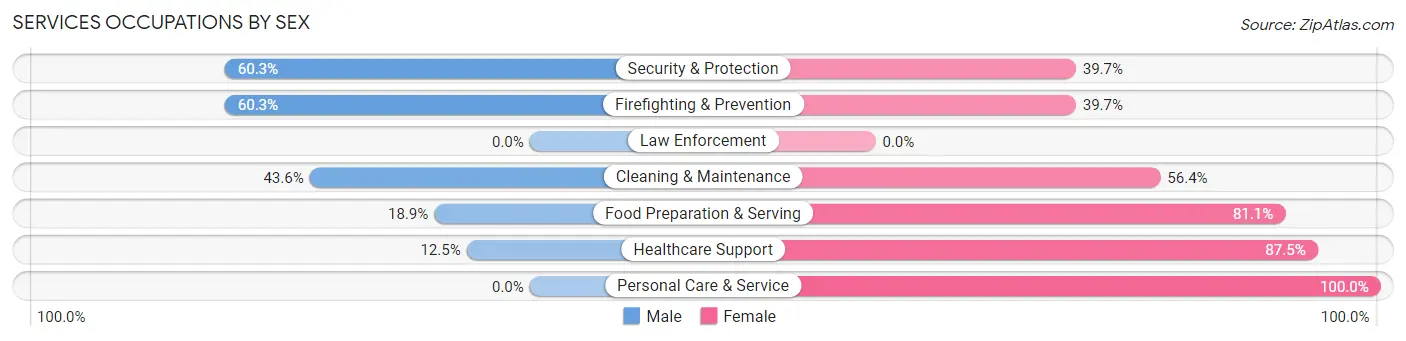
Services Occupations by Sex
Within the Services occupations in Travilah, the most male-oriented occupations are Security & Protection (60.3%), Firefighting & Prevention (60.3%), and Cleaning & Maintenance (43.6%), while the most female-oriented occupations are Personal Care & Service (100.0%), Healthcare Support (87.5%), and Food Preparation & Serving (81.1%).
| Occupation | Male | Female |
| Healthcare Support | 20 (12.5%) | 140 (87.5%) |
| Security & Protection | 35 (60.3%) | 23 (39.7%) |
| Firefighting & Prevention | 35 (60.3%) | 23 (39.7%) |
| Law Enforcement | 0 (0.0%) | 0 (0.0%) |
| Food Preparation & Serving | 14 (18.9%) | 60 (81.1%) |
| Cleaning & Maintenance | 17 (43.6%) | 22 (56.4%) |
| Personal Care & Service | 0 (0.0%) | 113 (100.0%) |
| Total (Category) | 86 (19.4%) | 358 (80.6%) |
| Total (Overall) | 3,035 (55.3%) | 2,454 (44.7%) |
Sales and Office Occupations
The most common Sales and Office occupations in Travilah are Sales & Related (429 | 7.8%), and Office & Administration (280 | 5.1%).
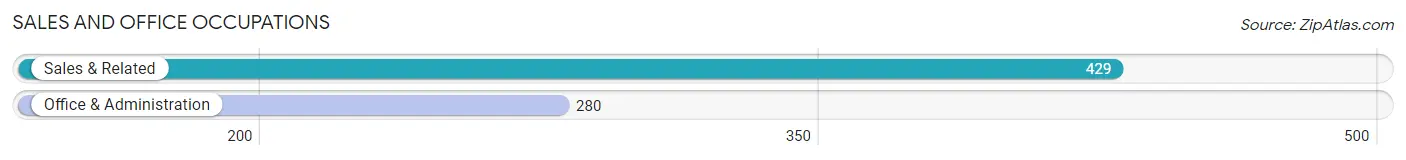
Sales and Office Occupations by Sex
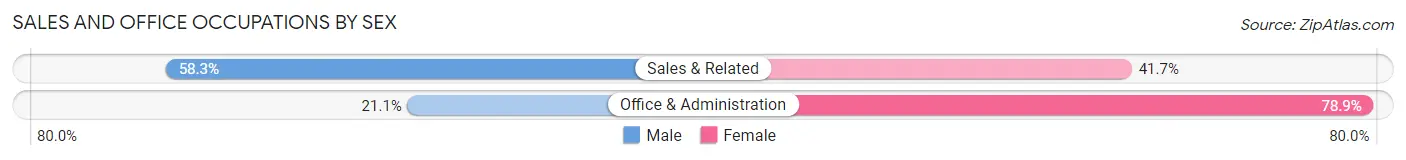
| Occupation | Male | Female |
| Sales & Related | 250 (58.3%) | 179 (41.7%) |
| Office & Administration | 59 (21.1%) | 221 (78.9%) |
| Total (Category) | 309 (43.6%) | 400 (56.4%) |
| Total (Overall) | 3,035 (55.3%) | 2,454 (44.7%) |
Natural Resources, Construction and Maintenance Occupations
The most common Natural Resources, Construction and Maintenance occupations in Travilah are , and Installation, Maintenance & Repair (3 | 0.1%).
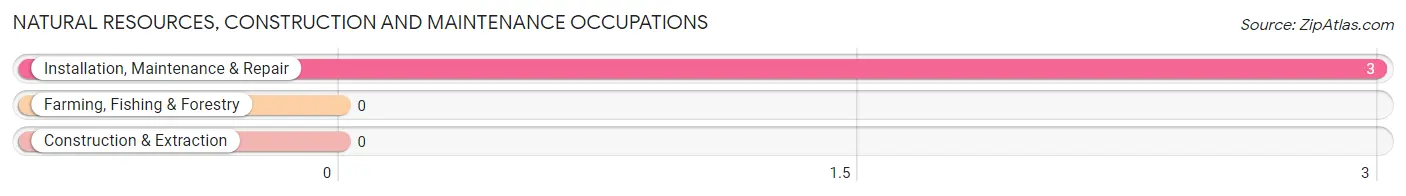
Natural Resources, Construction and Maintenance Occupations by Sex
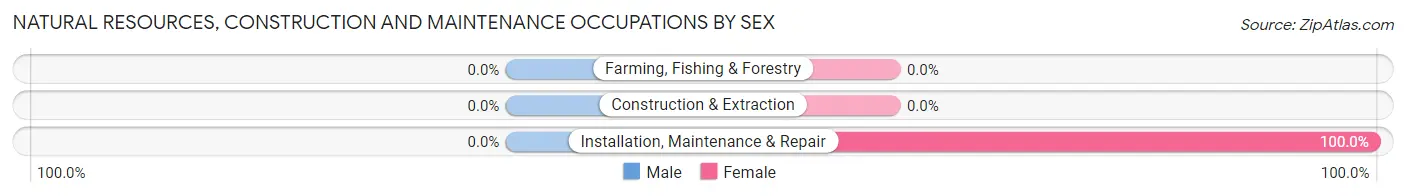
| Occupation | Male | Female |
| Farming, Fishing & Forestry | 0 (0.0%) | 0 (0.0%) |
| Construction & Extraction | 0 (0.0%) | 0 (0.0%) |
| Installation, Maintenance & Repair | 0 (0.0%) | 3 (100.0%) |
| Total (Category) | 0 (0.0%) | 3 (100.0%) |
| Total (Overall) | 3,035 (55.3%) | 2,454 (44.7%) |
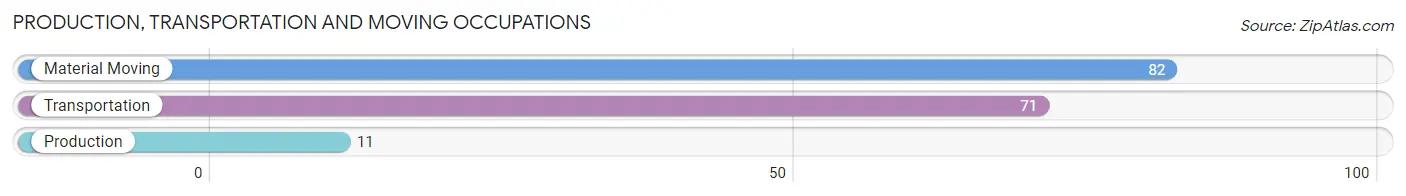
Production, Transportation and Moving Occupations
The most common Production, Transportation and Moving occupations in Travilah are Material Moving (82 | 1.5%), Transportation (71 | 1.3%), and Production (11 | 0.2%).
Production, Transportation and Moving Occupations by Sex
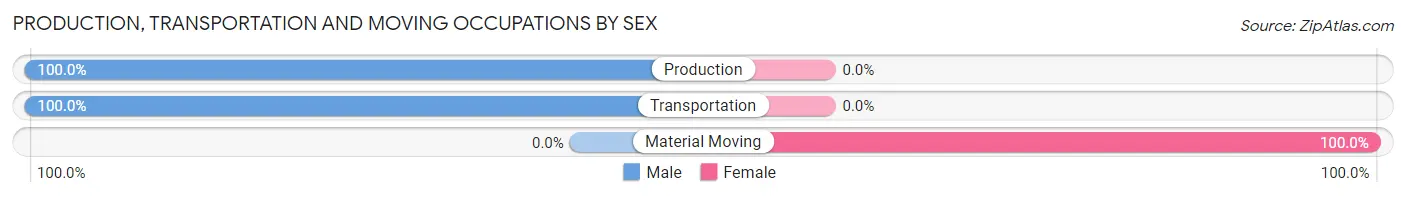
| Occupation | Male | Female |
| Production | 11 (100.0%) | 0 (0.0%) |
| Transportation | 71 (100.0%) | 0 (0.0%) |
| Material Moving | 0 (0.0%) | 82 (100.0%) |
| Total (Category) | 82 (50.0%) | 82 (50.0%) |
| Total (Overall) | 3,035 (55.3%) | 2,454 (44.7%) |
Employment Industries by Sex in Travilah
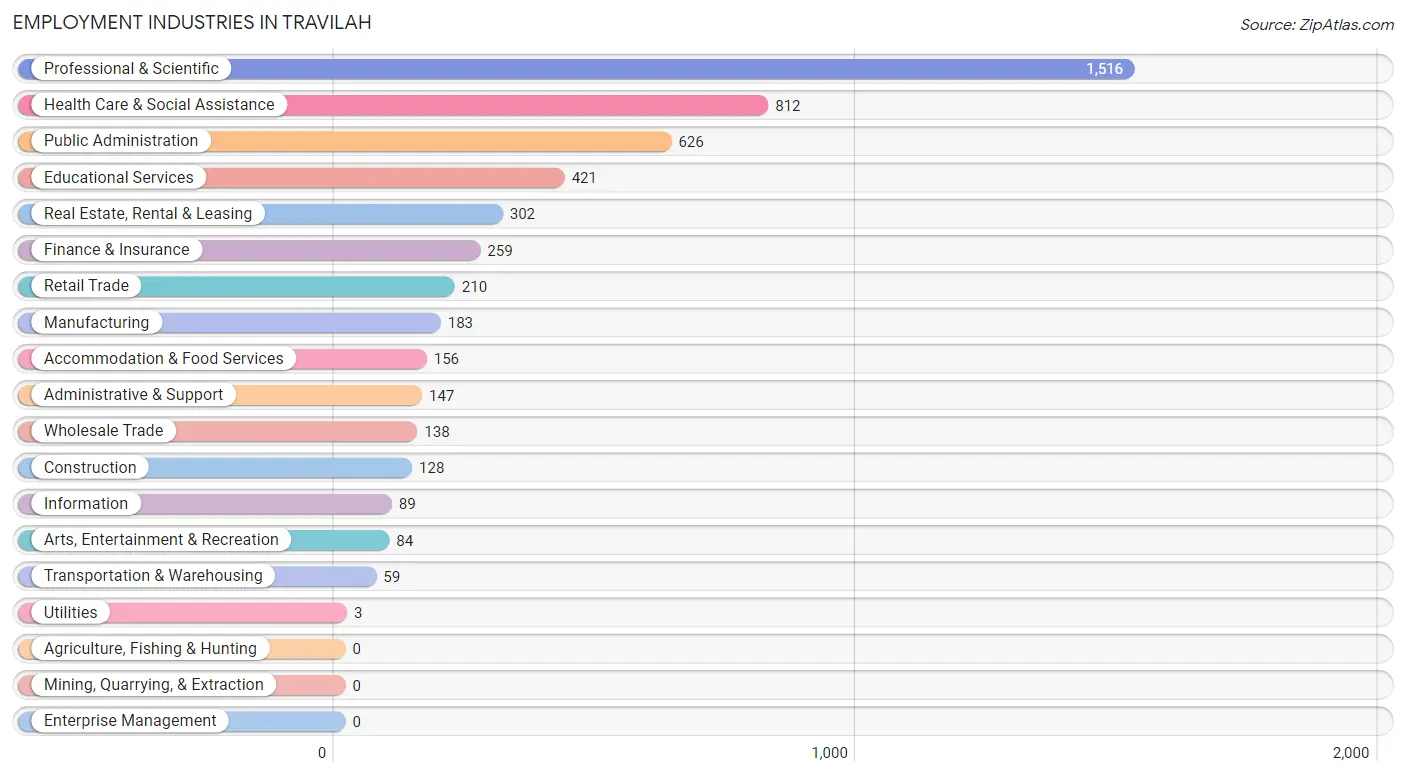
Employment Industries in Travilah
The major employment industries in Travilah include Professional & Scientific (1,516 | 27.6%), Health Care & Social Assistance (812 | 14.8%), Public Administration (626 | 11.4%), Educational Services (421 | 7.7%), and Real Estate, Rental & Leasing (302 | 5.5%).
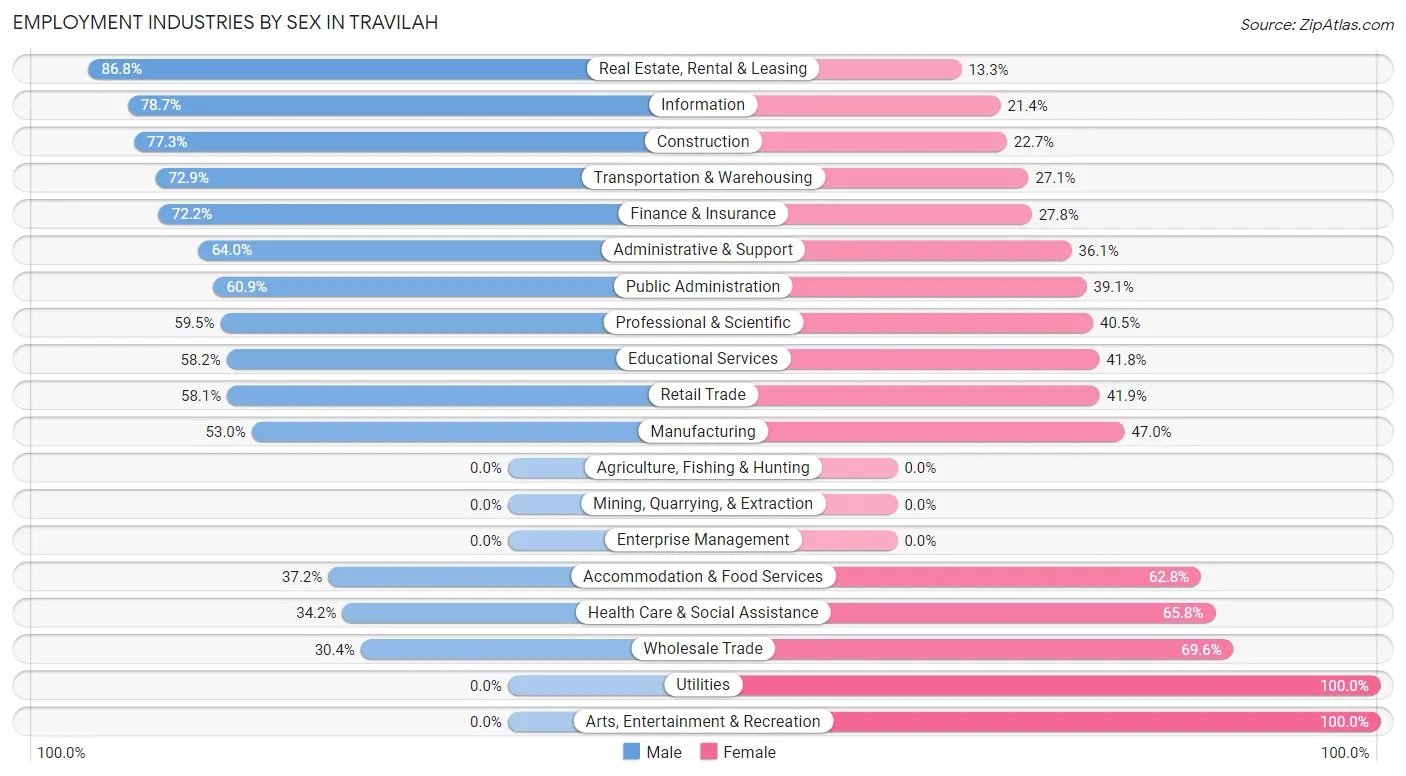
Employment Industries by Sex in Travilah
The Travilah industries that see more men than women are Real Estate, Rental & Leasing (86.8%), Information (78.6%), and Construction (77.3%), whereas the industries that tend to have a higher number of women are Utilities (100.0%), Arts, Entertainment & Recreation (100.0%), and Wholesale Trade (69.6%).
| Industry | Male | Female |
| Agriculture, Fishing & Hunting | 0 (0.0%) | 0 (0.0%) |
| Mining, Quarrying, & Extraction | 0 (0.0%) | 0 (0.0%) |
| Construction | 99 (77.3%) | 29 (22.7%) |
| Manufacturing | 97 (53.0%) | 86 (47.0%) |
| Wholesale Trade | 42 (30.4%) | 96 (69.6%) |
| Retail Trade | 122 (58.1%) | 88 (41.9%) |
| Transportation & Warehousing | 43 (72.9%) | 16 (27.1%) |
| Utilities | 0 (0.0%) | 3 (100.0%) |
| Information | 70 (78.6%) | 19 (21.3%) |
| Finance & Insurance | 187 (72.2%) | 72 (27.8%) |
| Real Estate, Rental & Leasing | 262 (86.8%) | 40 (13.3%) |
| Professional & Scientific | 902 (59.5%) | 614 (40.5%) |
| Enterprise Management | 0 (0.0%) | 0 (0.0%) |
| Administrative & Support | 94 (63.9%) | 53 (36.0%) |
| Educational Services | 245 (58.2%) | 176 (41.8%) |
| Health Care & Social Assistance | 278 (34.2%) | 534 (65.8%) |
| Arts, Entertainment & Recreation | 0 (0.0%) | 84 (100.0%) |
| Accommodation & Food Services | 58 (37.2%) | 98 (62.8%) |
| Public Administration | 381 (60.9%) | 245 (39.1%) |
| Total | 3,035 (55.3%) | 2,454 (44.7%) |
Education in Travilah
School Enrollment in Travilah
The most common levels of schooling among the 2,633 students in Travilah are high school (771 | 29.3%), middle school (616 | 23.4%), and college / undergraduate (501 | 19.0%).
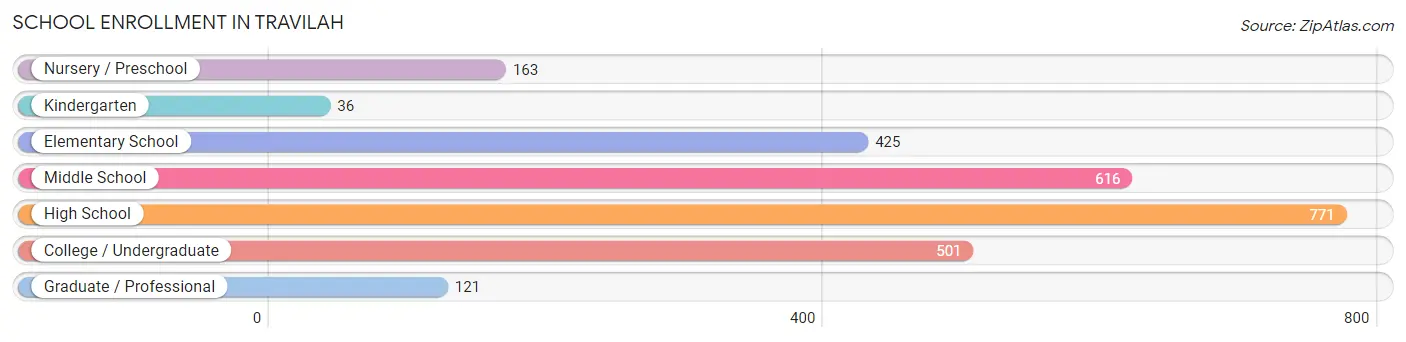
| School Level | # Students | % Students |
| Nursery / Preschool | 163 | 6.2% |
| Kindergarten | 36 | 1.4% |
| Elementary School | 425 | 16.1% |
| Middle School | 616 | 23.4% |
| High School | 771 | 29.3% |
| College / Undergraduate | 501 | 19.0% |
| Graduate / Professional | 121 | 4.6% |
| Total | 2,633 | 100.0% |
School Enrollment by Age by Funding Source in Travilah
Out of a total of 2,633 students who are enrolled in schools in Travilah, 666 (25.3%) attend a private institution, while the remaining 1,967 (74.7%) are enrolled in public schools. The age group of 3 to 4 year olds has the highest likelihood of being enrolled in private schools, with 106 (79.1% in the age bracket) enrolled. Conversely, the age group of 35 years and over has the lowest likelihood of being enrolled in a private school, with 79 (100.0% in the age bracket) attending a public institution.
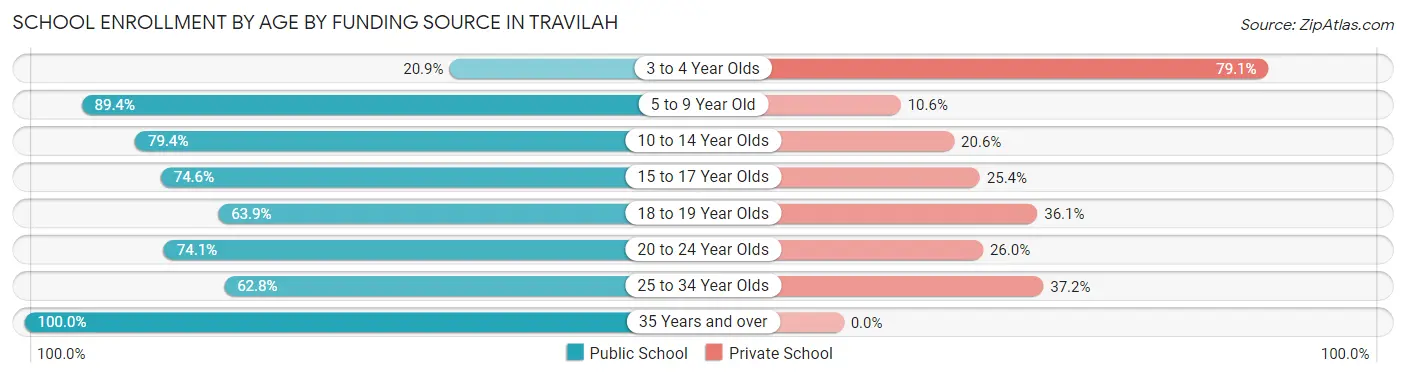
| Age Bracket | Public School | Private School |
| 3 to 4 Year Olds | 28 (20.9%) | 106 (79.1%) |
| 5 to 9 Year Old | 370 (89.4%) | 44 (10.6%) |
| 10 to 14 Year Olds | 606 (79.4%) | 157 (20.6%) |
| 15 to 17 Year Olds | 406 (74.6%) | 138 (25.4%) |
| 18 to 19 Year Olds | 195 (63.9%) | 110 (36.1%) |
| 20 to 24 Year Olds | 234 (74.1%) | 82 (26.0%) |
| 25 to 34 Year Olds | 49 (62.8%) | 29 (37.2%) |
| 35 Years and over | 79 (100.0%) | 0 (0.0%) |
| Total | 1,967 (74.7%) | 666 (25.3%) |
Educational Attainment by Field of Study in Travilah
Business (1,180 | 16.9%), social sciences (1,090 | 15.6%), engineering (765 | 11.0%), bio, nature & agricultural (720 | 10.3%), and computers & mathematics (460 | 6.6%) are the most common fields of study among 6,986 individuals in Travilah who have obtained a bachelor's degree or higher.
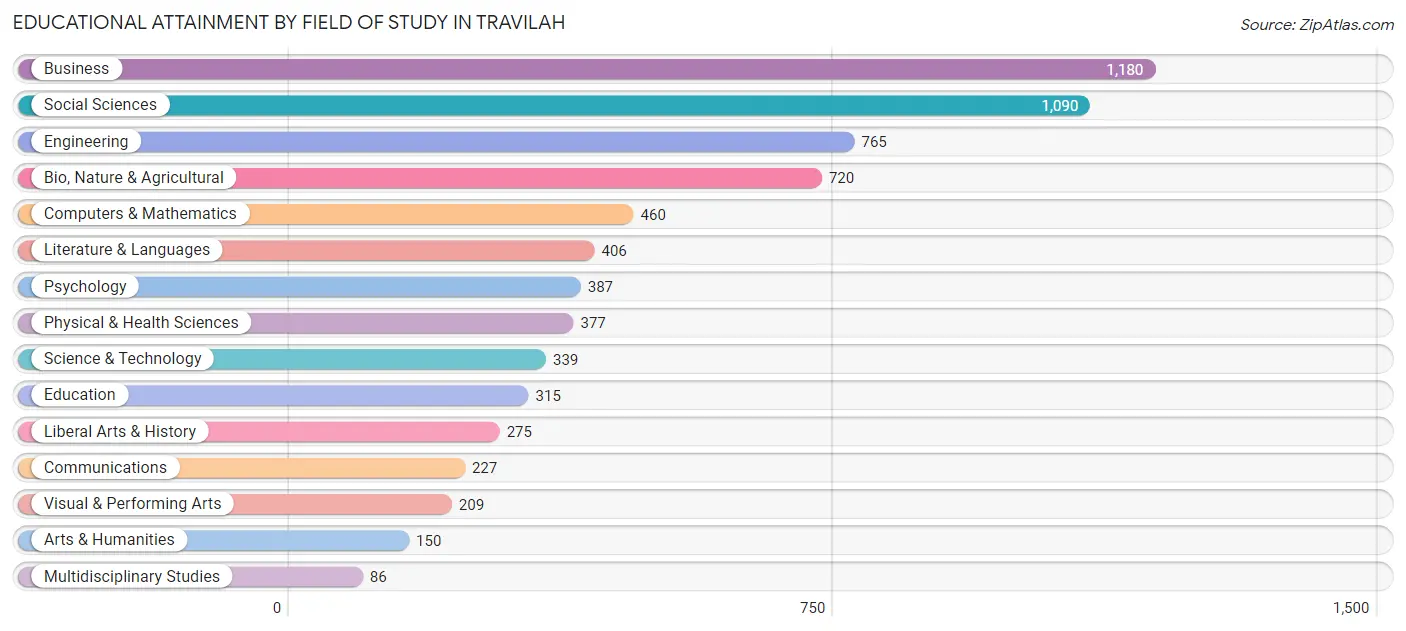
| Field of Study | # Graduates | % Graduates |
| Computers & Mathematics | 460 | 6.6% |
| Bio, Nature & Agricultural | 720 | 10.3% |
| Physical & Health Sciences | 377 | 5.4% |
| Psychology | 387 | 5.5% |
| Social Sciences | 1,090 | 15.6% |
| Engineering | 765 | 11.0% |
| Multidisciplinary Studies | 86 | 1.2% |
| Science & Technology | 339 | 4.9% |
| Business | 1,180 | 16.9% |
| Education | 315 | 4.5% |
| Literature & Languages | 406 | 5.8% |
| Liberal Arts & History | 275 | 3.9% |
| Visual & Performing Arts | 209 | 3.0% |
| Communications | 227 | 3.3% |
| Arts & Humanities | 150 | 2.1% |
| Total | 6,986 | 100.0% |
Transportation & Commute in Travilah
Vehicle Availability by Sex in Travilah
The most prevalent vehicle ownership categories in Travilah are males with 2 vehicles (1,547, accounting for 51.0%) and females with 2 vehicles (1,042, making up 64.6%).
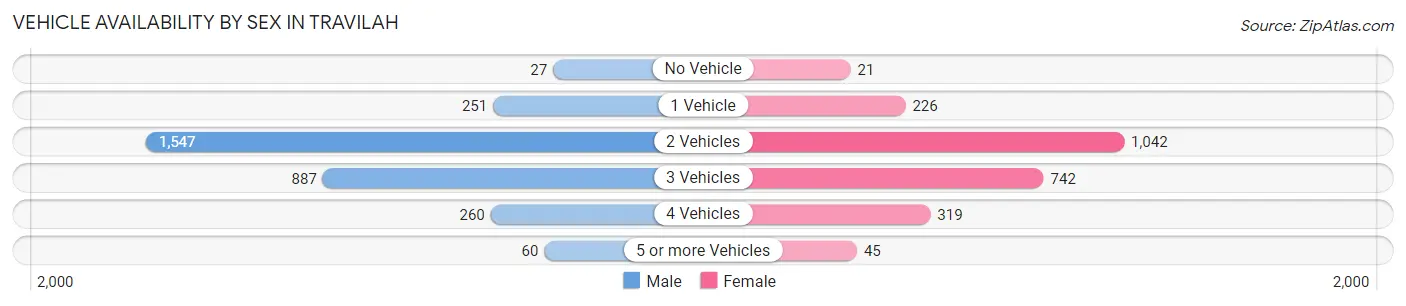
| Vehicles Available | Male | Female |
| No Vehicle | 27 (0.9%) | 21 (0.9%) |
| 1 Vehicle | 251 (8.3%) | 226 (9.4%) |
| 2 Vehicles | 1,547 (51.0%) | 1,042 (43.5%) |
| 3 Vehicles | 887 (29.2%) | 742 (31.0%) |
| 4 Vehicles | 260 (8.6%) | 319 (13.3%) |
| 5 or more Vehicles | 60 (2.0%) | 45 (1.9%) |
| Total | 3,032 (100.0%) | 2,395 (100.0%) |
Commute Time in Travilah
The most frequently occuring commute durations in Travilah are 15 to 19 minutes (654 commuters, 16.7%), 20 to 24 minutes (557 commuters, 14.2%), and 45 to 59 minutes (540 commuters, 13.8%).
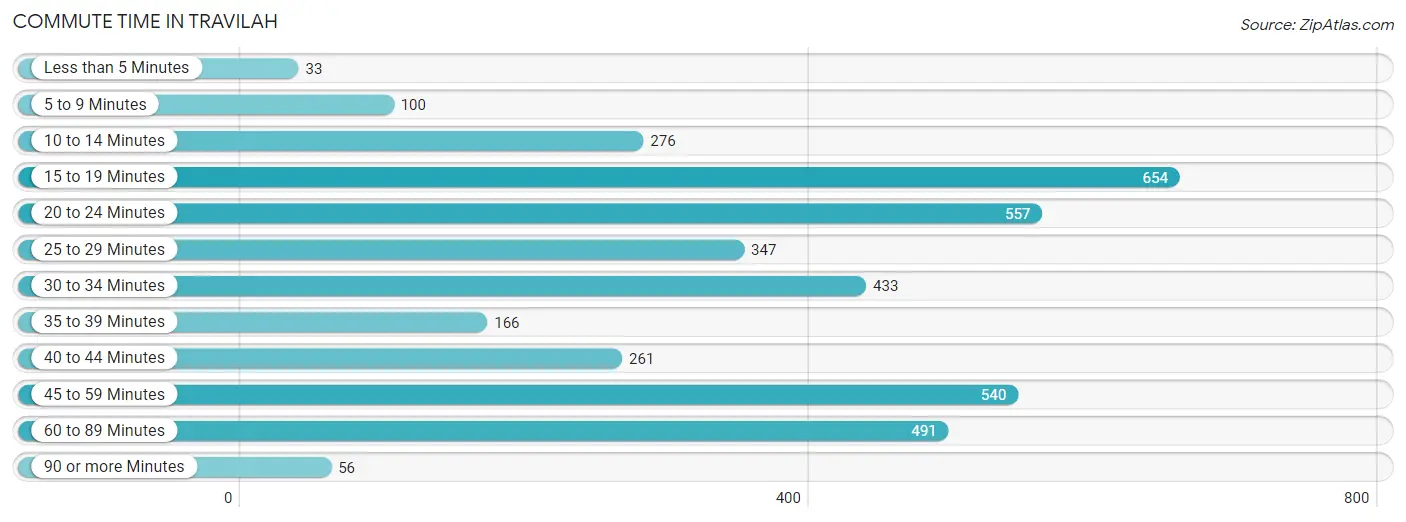
| Commute Time | # Commuters | % Commuters |
| Less than 5 Minutes | 33 | 0.8% |
| 5 to 9 Minutes | 100 | 2.5% |
| 10 to 14 Minutes | 276 | 7.0% |
| 15 to 19 Minutes | 654 | 16.7% |
| 20 to 24 Minutes | 557 | 14.2% |
| 25 to 29 Minutes | 347 | 8.9% |
| 30 to 34 Minutes | 433 | 11.1% |
| 35 to 39 Minutes | 166 | 4.2% |
| 40 to 44 Minutes | 261 | 6.7% |
| 45 to 59 Minutes | 540 | 13.8% |
| 60 to 89 Minutes | 491 | 12.5% |
| 90 or more Minutes | 56 | 1.4% |
Commute Time by Sex in Travilah
The most common commute times in Travilah are 20 to 24 minutes (350 commuters, 15.9%) for males and 15 to 19 minutes (375 commuters, 21.9%) for females.
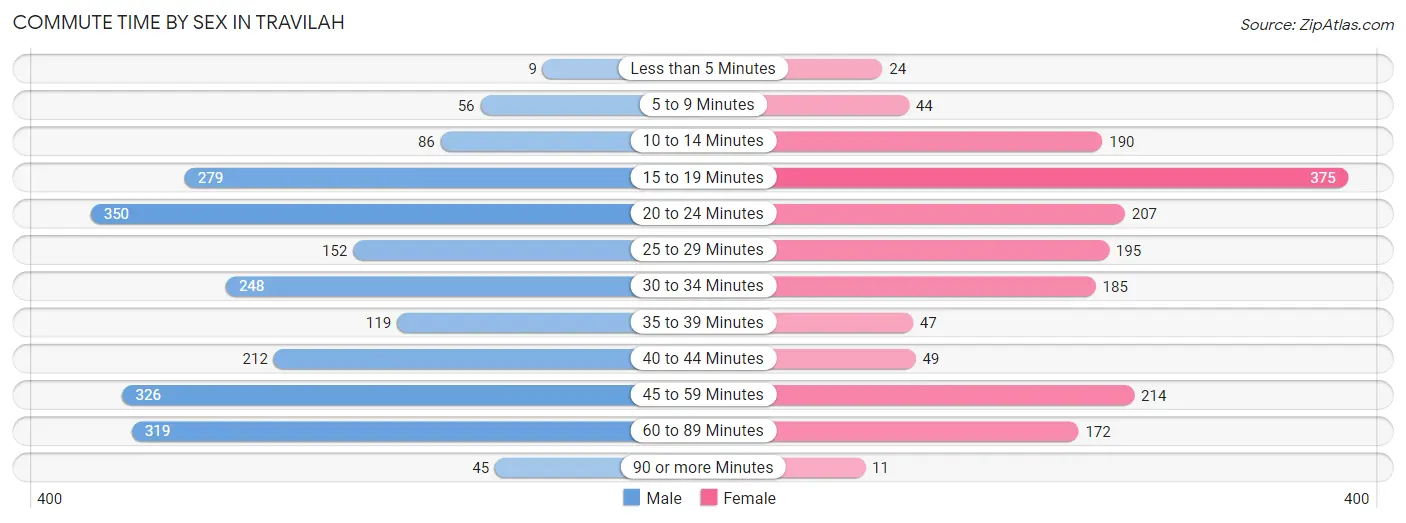
| Commute Time | Male | Female |
| Less than 5 Minutes | 9 (0.4%) | 24 (1.4%) |
| 5 to 9 Minutes | 56 (2.5%) | 44 (2.6%) |
| 10 to 14 Minutes | 86 (3.9%) | 190 (11.1%) |
| 15 to 19 Minutes | 279 (12.7%) | 375 (21.9%) |
| 20 to 24 Minutes | 350 (15.9%) | 207 (12.1%) |
| 25 to 29 Minutes | 152 (6.9%) | 195 (11.4%) |
| 30 to 34 Minutes | 248 (11.3%) | 185 (10.8%) |
| 35 to 39 Minutes | 119 (5.4%) | 47 (2.7%) |
| 40 to 44 Minutes | 212 (9.6%) | 49 (2.9%) |
| 45 to 59 Minutes | 326 (14.8%) | 214 (12.5%) |
| 60 to 89 Minutes | 319 (14.5%) | 172 (10.0%) |
| 90 or more Minutes | 45 (2.0%) | 11 (0.6%) |
Time of Departure to Work by Sex in Travilah
The most frequent times of departure to work in Travilah are 8:00 AM to 8:29 AM (380, 17.3%) for males and 9:00 AM to 9:59 AM (352, 20.5%) for females.
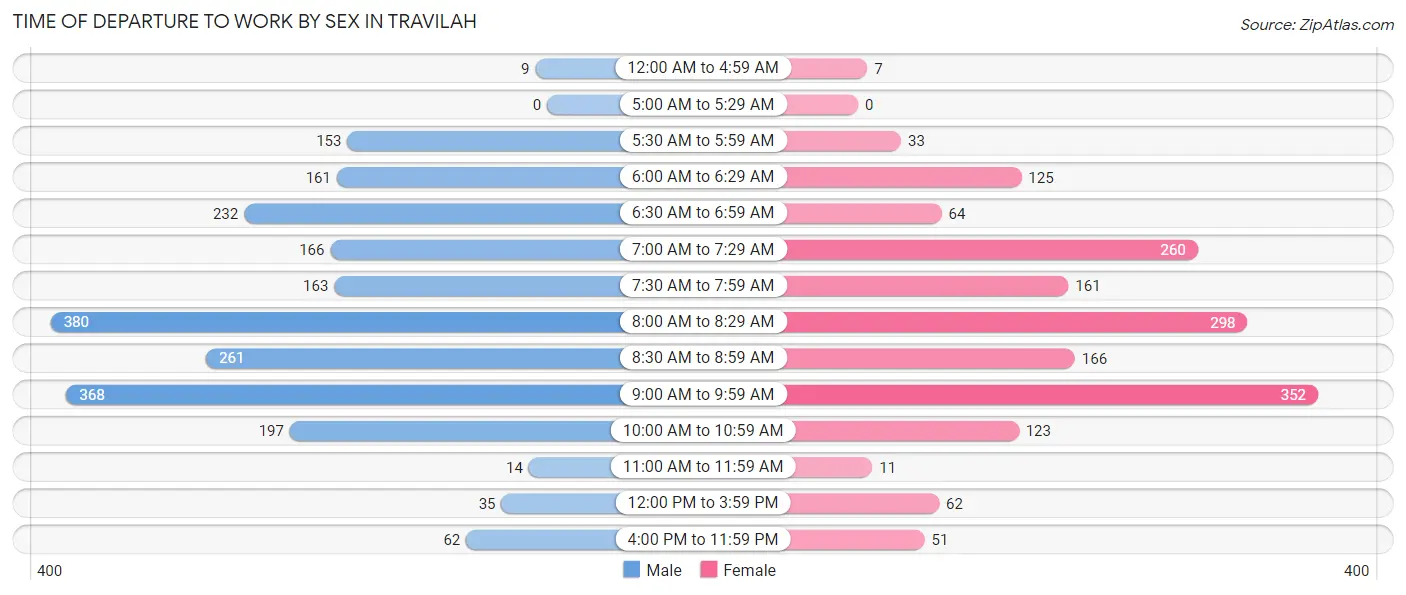
| Time of Departure | Male | Female |
| 12:00 AM to 4:59 AM | 9 (0.4%) | 7 (0.4%) |
| 5:00 AM to 5:29 AM | 0 (0.0%) | 0 (0.0%) |
| 5:30 AM to 5:59 AM | 153 (7.0%) | 33 (1.9%) |
| 6:00 AM to 6:29 AM | 161 (7.3%) | 125 (7.3%) |
| 6:30 AM to 6:59 AM | 232 (10.5%) | 64 (3.7%) |
| 7:00 AM to 7:29 AM | 166 (7.5%) | 260 (15.2%) |
| 7:30 AM to 7:59 AM | 163 (7.4%) | 161 (9.4%) |
| 8:00 AM to 8:29 AM | 380 (17.3%) | 298 (17.4%) |
| 8:30 AM to 8:59 AM | 261 (11.9%) | 166 (9.7%) |
| 9:00 AM to 9:59 AM | 368 (16.7%) | 352 (20.5%) |
| 10:00 AM to 10:59 AM | 197 (8.9%) | 123 (7.2%) |
| 11:00 AM to 11:59 AM | 14 (0.6%) | 11 (0.6%) |
| 12:00 PM to 3:59 PM | 35 (1.6%) | 62 (3.6%) |
| 4:00 PM to 11:59 PM | 62 (2.8%) | 51 (3.0%) |
| Total | 2,201 (100.0%) | 1,713 (100.0%) |
Housing Occupancy in Travilah
Occupancy by Ownership in Travilah
Of the total 3,703 dwellings in Travilah, owner-occupied units account for 3,559 (96.1%), while renter-occupied units make up 144 (3.9%).
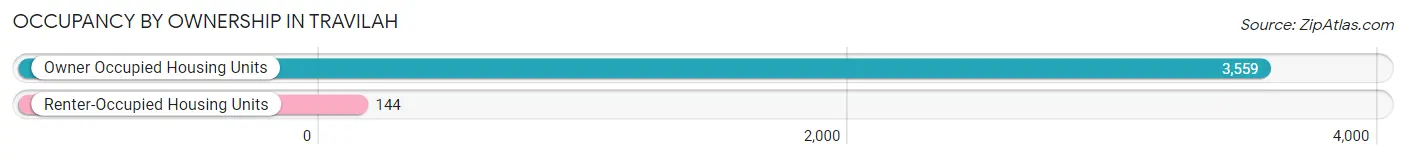
| Occupancy | # Housing Units | % Housing Units |
| Owner Occupied Housing Units | 3,559 | 96.1% |
| Renter-Occupied Housing Units | 144 | 3.9% |
| Total Occupied Housing Units | 3,703 | 100.0% |
Occupancy by Household Size in Travilah
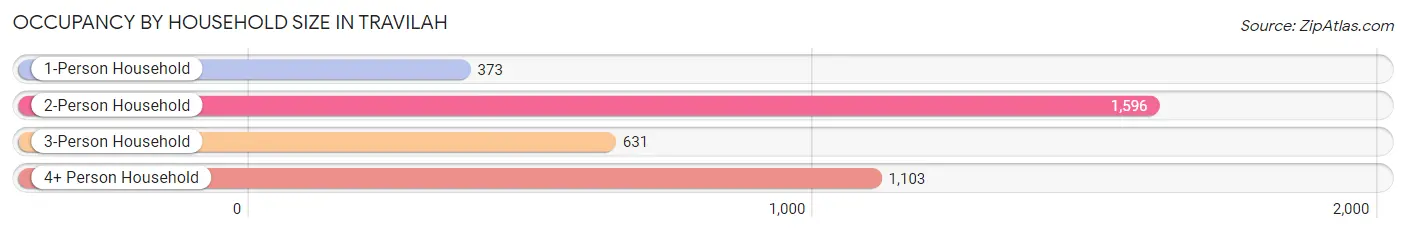
| Household Size | # Housing Units | % Housing Units |
| 1-Person Household | 373 | 10.1% |
| 2-Person Household | 1,596 | 43.1% |
| 3-Person Household | 631 | 17.0% |
| 4+ Person Household | 1,103 | 29.8% |
| Total Housing Units | 3,703 | 100.0% |
Occupancy by Ownership by Household Size in Travilah
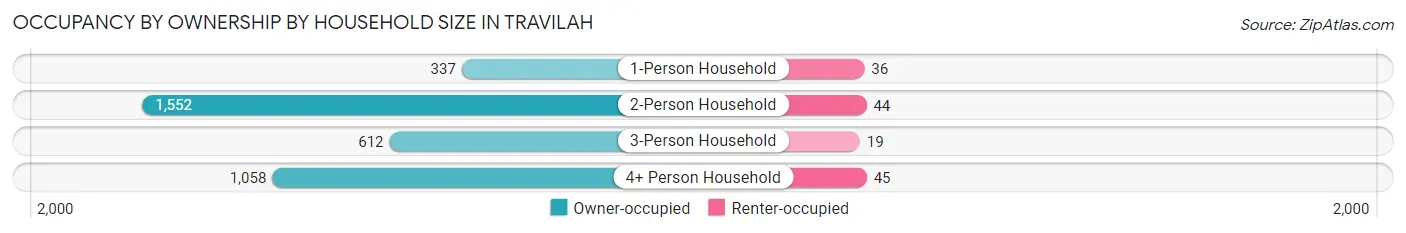
| Household Size | Owner-occupied | Renter-occupied |
| 1-Person Household | 337 (90.3%) | 36 (9.7%) |
| 2-Person Household | 1,552 (97.2%) | 44 (2.8%) |
| 3-Person Household | 612 (97.0%) | 19 (3.0%) |
| 4+ Person Household | 1,058 (95.9%) | 45 (4.1%) |
| Total Housing Units | 3,559 (96.1%) | 144 (3.9%) |
Occupancy by Educational Attainment in Travilah
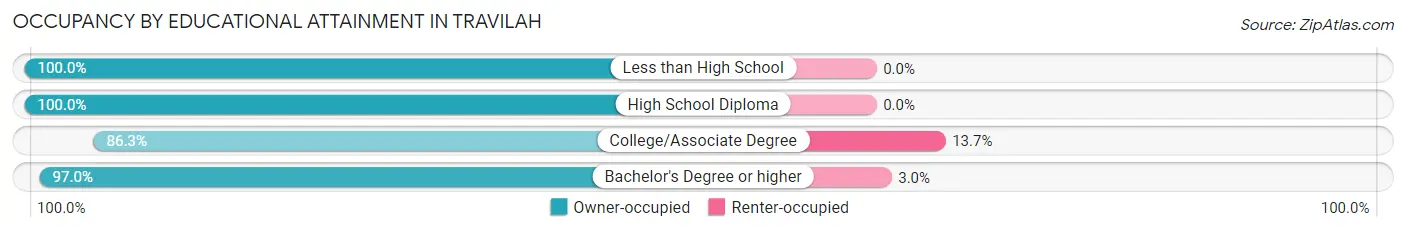
| Household Size | Owner-occupied | Renter-occupied |
| Less than High School | 61 (100.0%) | 0 (0.0%) |
| High School Diploma | 103 (100.0%) | 0 (0.0%) |
| College/Associate Degree | 309 (86.3%) | 49 (13.7%) |
| Bachelor's Degree or higher | 3,086 (97.0%) | 95 (3.0%) |
Occupancy by Age of Householder in Travilah
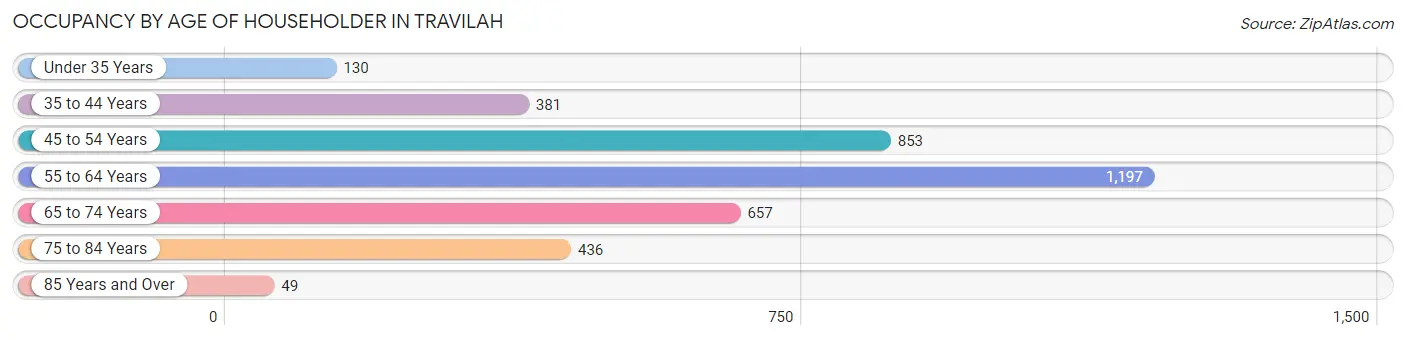
| Age Bracket | # Households | % Households |
| Under 35 Years | 130 | 3.5% |
| 35 to 44 Years | 381 | 10.3% |
| 45 to 54 Years | 853 | 23.0% |
| 55 to 64 Years | 1,197 | 32.3% |
| 65 to 74 Years | 657 | 17.7% |
| 75 to 84 Years | 436 | 11.8% |
| 85 Years and Over | 49 | 1.3% |
| Total | 3,703 | 100.0% |
Housing Finances in Travilah
Median Income by Occupancy in Travilah
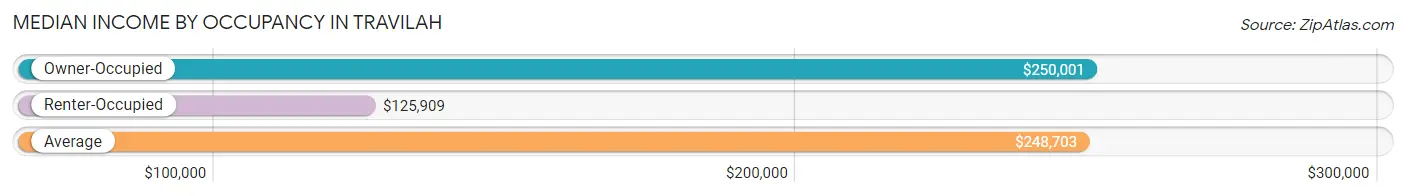
| Occupancy Type | # Households | Median Income |
| Owner-Occupied | 3,559 (96.1%) | $250,001 |
| Renter-Occupied | 144 (3.9%) | $125,909 |
| Average | 3,703 (100.0%) | $248,703 |
Occupancy by Householder Income Bracket in Travilah
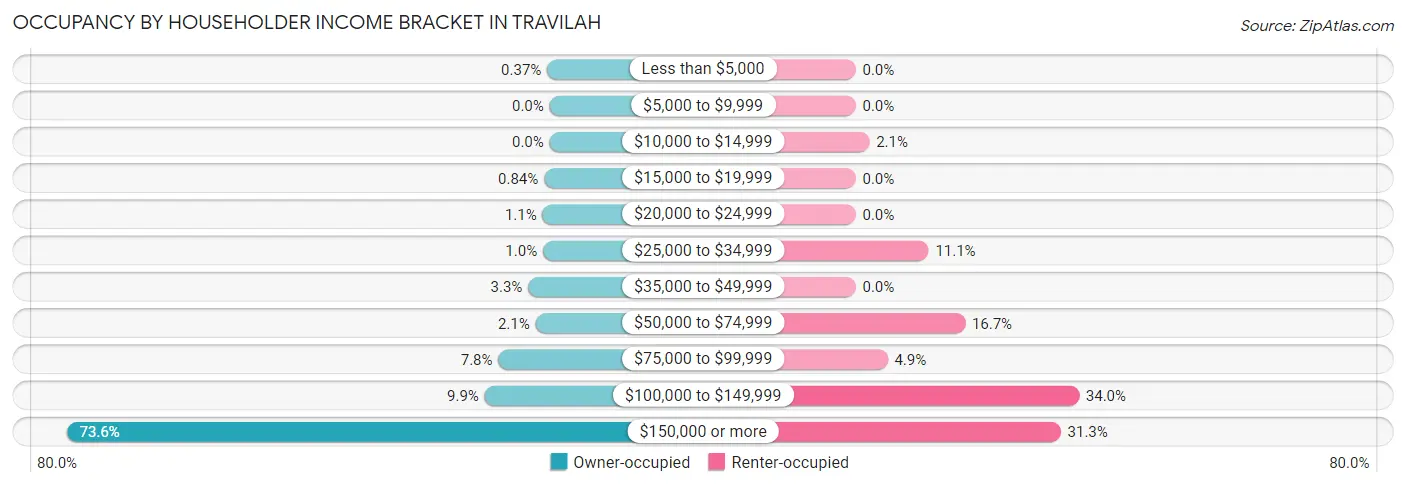
| Income Bracket | Owner-occupied | Renter-occupied |
| Less than $5,000 | 13 (0.4%) | 0 (0.0%) |
| $5,000 to $9,999 | 0 (0.0%) | 0 (0.0%) |
| $10,000 to $14,999 | 0 (0.0%) | 3 (2.1%) |
| $15,000 to $19,999 | 30 (0.8%) | 0 (0.0%) |
| $20,000 to $24,999 | 38 (1.1%) | 0 (0.0%) |
| $25,000 to $34,999 | 36 (1.0%) | 16 (11.1%) |
| $35,000 to $49,999 | 116 (3.3%) | 0 (0.0%) |
| $50,000 to $74,999 | 76 (2.1%) | 24 (16.7%) |
| $75,000 to $99,999 | 278 (7.8%) | 7 (4.9%) |
| $100,000 to $149,999 | 352 (9.9%) | 49 (34.0%) |
| $150,000 or more | 2,620 (73.6%) | 45 (31.2%) |
| Total | 3,559 (100.0%) | 144 (100.0%) |
Monthly Housing Cost Tiers in Travilah
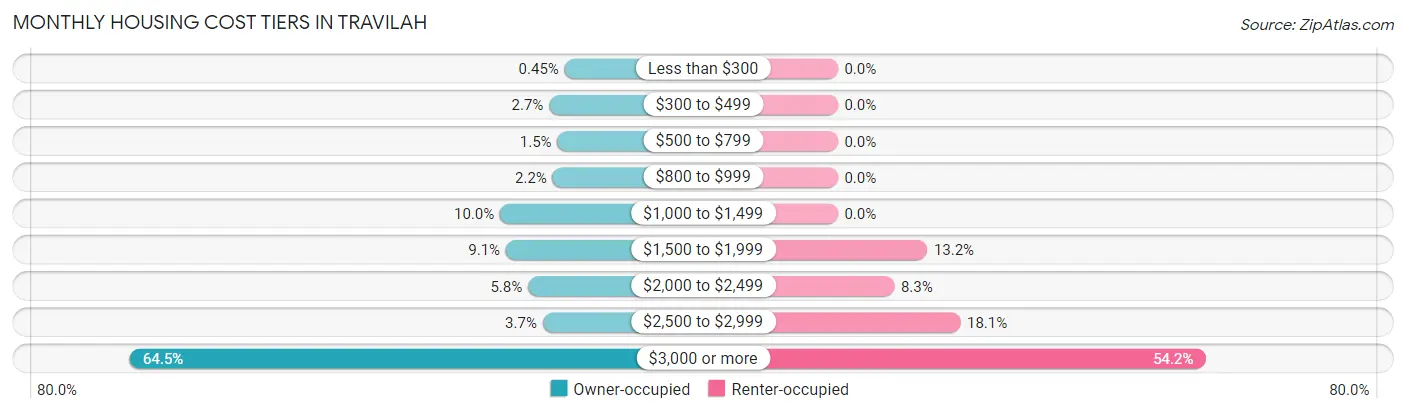
| Monthly Cost | Owner-occupied | Renter-occupied |
| Less than $300 | 16 (0.4%) | 0 (0.0%) |
| $300 to $499 | 97 (2.7%) | 0 (0.0%) |
| $500 to $799 | 54 (1.5%) | 0 (0.0%) |
| $800 to $999 | 79 (2.2%) | 0 (0.0%) |
| $1,000 to $1,499 | 355 (10.0%) | 0 (0.0%) |
| $1,500 to $1,999 | 324 (9.1%) | 19 (13.2%) |
| $2,000 to $2,499 | 208 (5.8%) | 12 (8.3%) |
| $2,500 to $2,999 | 131 (3.7%) | 26 (18.1%) |
| $3,000 or more | 2,295 (64.5%) | 78 (54.2%) |
| Total | 3,559 (100.0%) | 144 (100.0%) |
Physical Housing Characteristics in Travilah
Housing Structures in Travilah
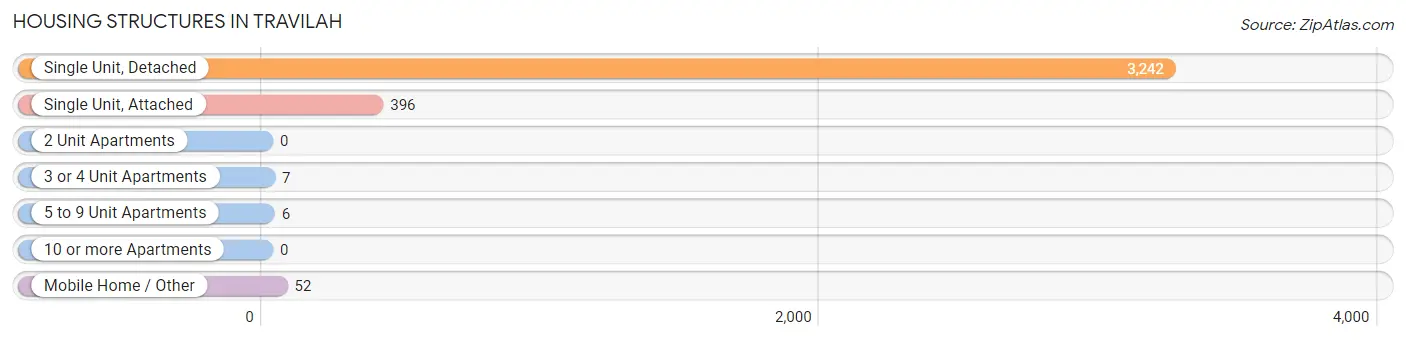
| Structure Type | # Housing Units | % Housing Units |
| Single Unit, Detached | 3,242 | 87.5% |
| Single Unit, Attached | 396 | 10.7% |
| 2 Unit Apartments | 0 | 0.0% |
| 3 or 4 Unit Apartments | 7 | 0.2% |
| 5 to 9 Unit Apartments | 6 | 0.2% |
| 10 or more Apartments | 0 | 0.0% |
| Mobile Home / Other | 52 | 1.4% |
| Total | 3,703 | 100.0% |
Housing Structures by Occupancy in Travilah
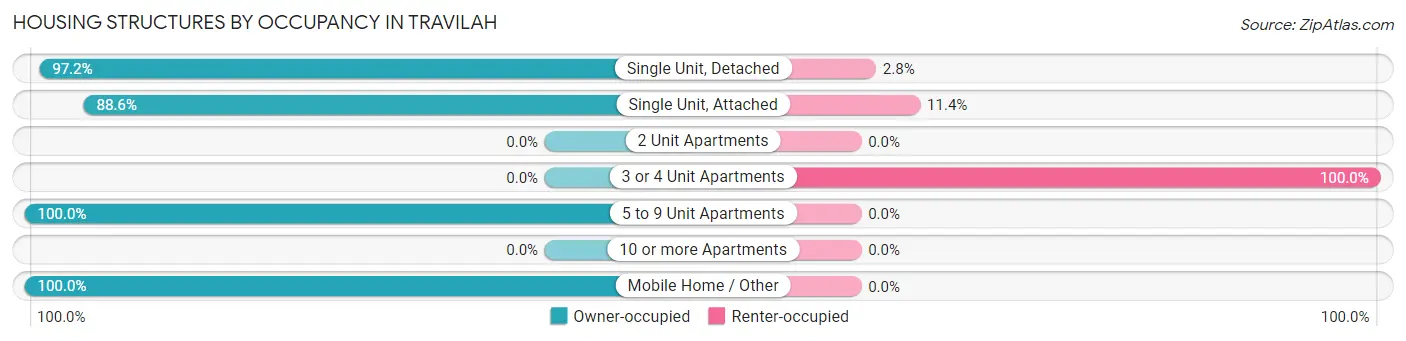
| Structure Type | Owner-occupied | Renter-occupied |
| Single Unit, Detached | 3,150 (97.2%) | 92 (2.8%) |
| Single Unit, Attached | 351 (88.6%) | 45 (11.4%) |
| 2 Unit Apartments | 0 (0.0%) | 0 (0.0%) |
| 3 or 4 Unit Apartments | 0 (0.0%) | 7 (100.0%) |
| 5 to 9 Unit Apartments | 6 (100.0%) | 0 (0.0%) |
| 10 or more Apartments | 0 (0.0%) | 0 (0.0%) |
| Mobile Home / Other | 52 (100.0%) | 0 (0.0%) |
| Total | 3,559 (96.1%) | 144 (3.9%) |
Housing Structures by Number of Rooms in Travilah
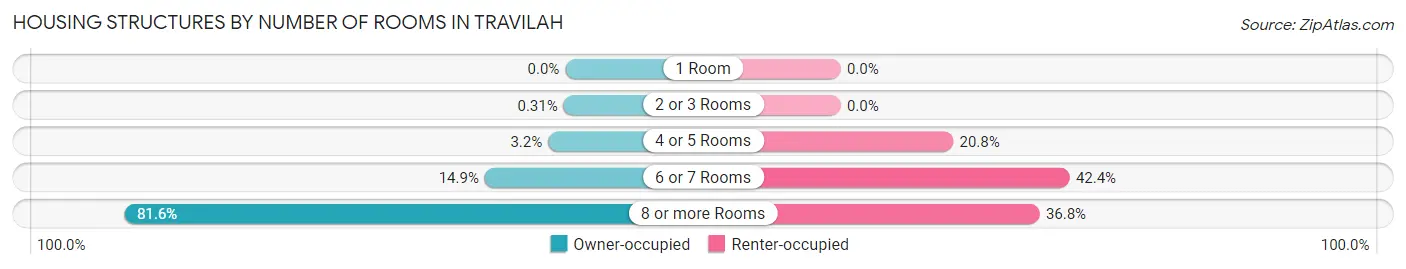
| Number of Rooms | Owner-occupied | Renter-occupied |
| 1 Room | 0 (0.0%) | 0 (0.0%) |
| 2 or 3 Rooms | 11 (0.3%) | 0 (0.0%) |
| 4 or 5 Rooms | 113 (3.2%) | 30 (20.8%) |
| 6 or 7 Rooms | 530 (14.9%) | 61 (42.4%) |
| 8 or more Rooms | 2,905 (81.6%) | 53 (36.8%) |
| Total | 3,559 (100.0%) | 144 (100.0%) |
Housing Structure by Heating Type in Travilah
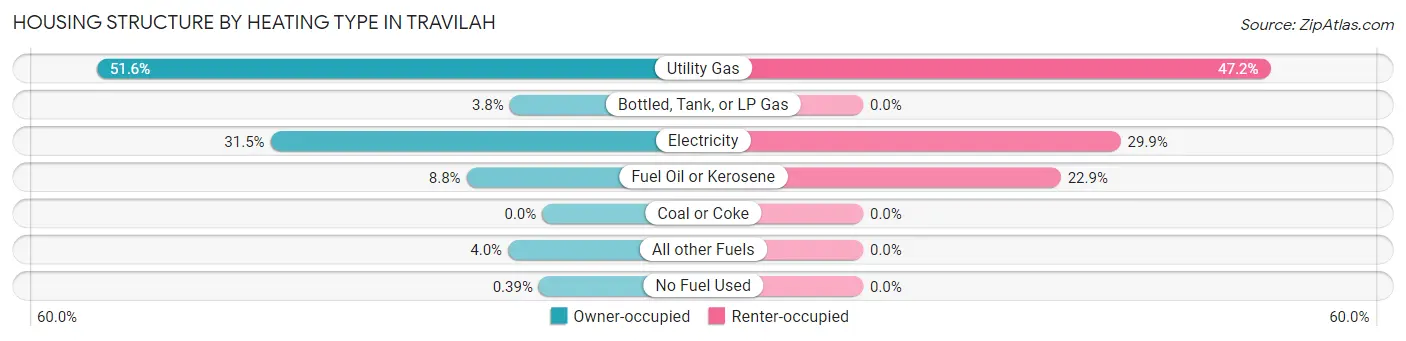
| Heating Type | Owner-occupied | Renter-occupied |
| Utility Gas | 1,837 (51.6%) | 68 (47.2%) |
| Bottled, Tank, or LP Gas | 134 (3.8%) | 0 (0.0%) |
| Electricity | 1,121 (31.5%) | 43 (29.9%) |
| Fuel Oil or Kerosene | 312 (8.8%) | 33 (22.9%) |
| Coal or Coke | 0 (0.0%) | 0 (0.0%) |
| All other Fuels | 141 (4.0%) | 0 (0.0%) |
| No Fuel Used | 14 (0.4%) | 0 (0.0%) |
| Total | 3,559 (100.0%) | 144 (100.0%) |
Household Vehicle Usage in Travilah
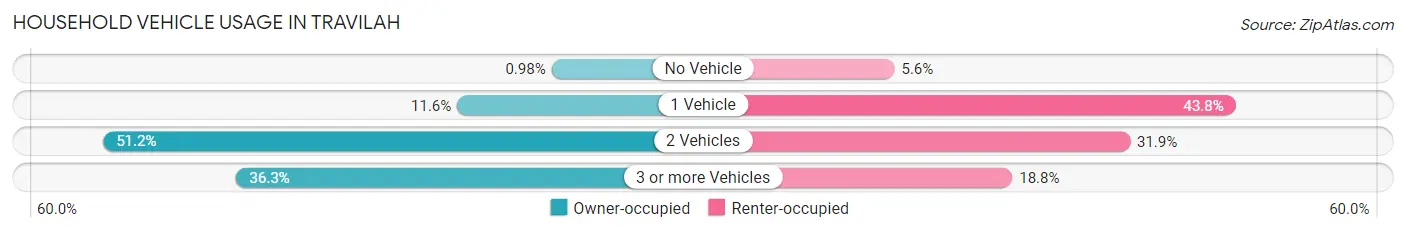
| Vehicles per Household | Owner-occupied | Renter-occupied |
| No Vehicle | 35 (1.0%) | 8 (5.6%) |
| 1 Vehicle | 411 (11.6%) | 63 (43.8%) |
| 2 Vehicles | 1,822 (51.2%) | 46 (31.9%) |
| 3 or more Vehicles | 1,291 (36.3%) | 27 (18.8%) |
| Total | 3,559 (100.0%) | 144 (100.0%) |
Real Estate & Mortgages in Travilah
Real Estate and Mortgage Overview in Travilah
| Characteristic | Without Mortgage | With Mortgage |
| Housing Units | 1,106 | 2,453 |
| Median Property Value | $1,136,700 | $1,210,400 |
| Median Household Income | $183,704 | $1,951 |
| Monthly Housing Costs | $1,501 | $2,179 |
| Real Estate Taxes | $10,001 | $0 |
Property Value by Mortgage Status in Travilah
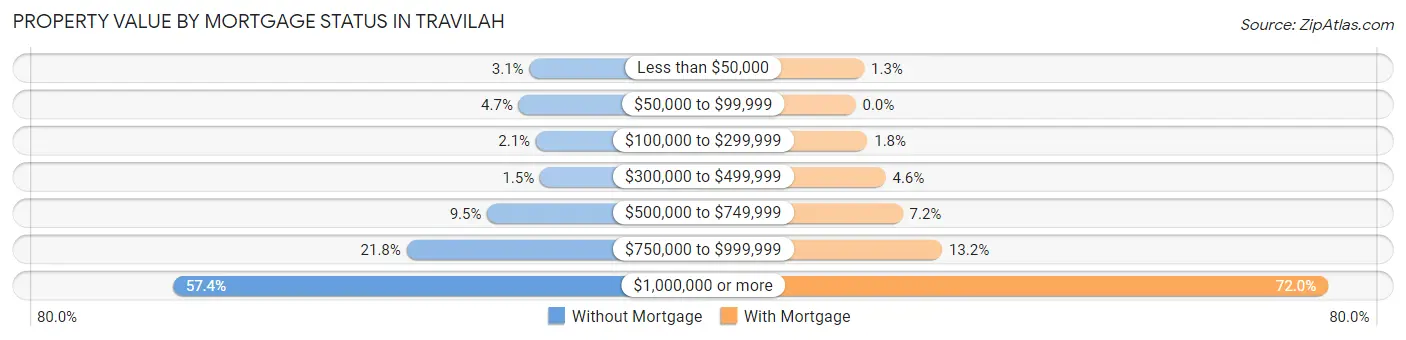
| Property Value | Without Mortgage | With Mortgage |
| Less than $50,000 | 34 (3.1%) | 32 (1.3%) |
| $50,000 to $99,999 | 52 (4.7%) | 0 (0.0%) |
| $100,000 to $299,999 | 23 (2.1%) | 44 (1.8%) |
| $300,000 to $499,999 | 16 (1.5%) | 112 (4.6%) |
| $500,000 to $749,999 | 105 (9.5%) | 176 (7.2%) |
| $750,000 to $999,999 | 241 (21.8%) | 323 (13.2%) |
| $1,000,000 or more | 635 (57.4%) | 1,766 (72.0%) |
| Total | 1,106 (100.0%) | 2,453 (100.0%) |
Household Income by Mortgage Status in Travilah
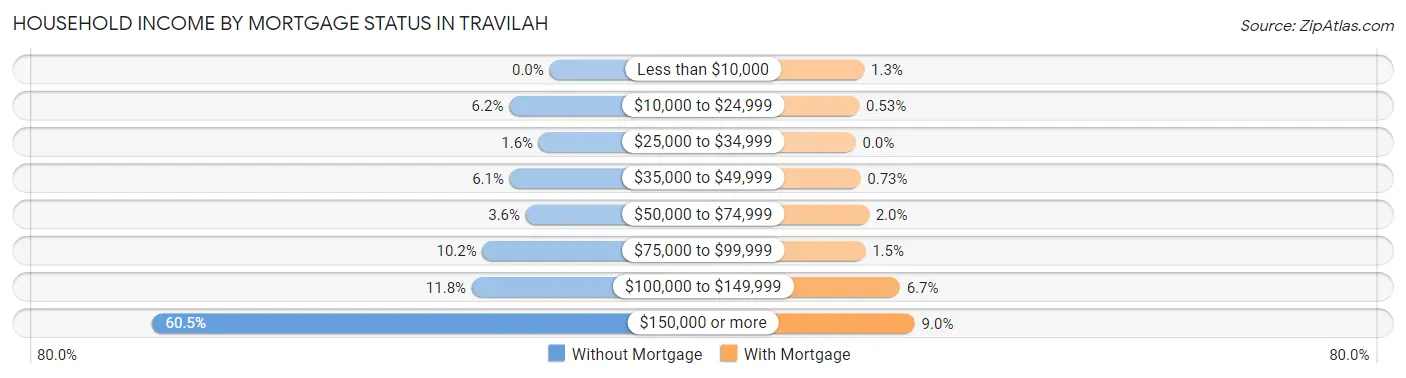
| Household Income | Without Mortgage | With Mortgage |
| Less than $10,000 | 0 (0.0%) | 32 (1.3%) |
| $10,000 to $24,999 | 68 (6.1%) | 13 (0.5%) |
| $25,000 to $34,999 | 18 (1.6%) | 0 (0.0%) |
| $35,000 to $49,999 | 67 (6.1%) | 18 (0.7%) |
| $50,000 to $74,999 | 40 (3.6%) | 49 (2.0%) |
| $75,000 to $99,999 | 113 (10.2%) | 36 (1.5%) |
| $100,000 to $149,999 | 131 (11.8%) | 165 (6.7%) |
| $150,000 or more | 669 (60.5%) | 221 (9.0%) |
| Total | 1,106 (100.0%) | 2,453 (100.0%) |
Property Value to Household Income Ratio in Travilah
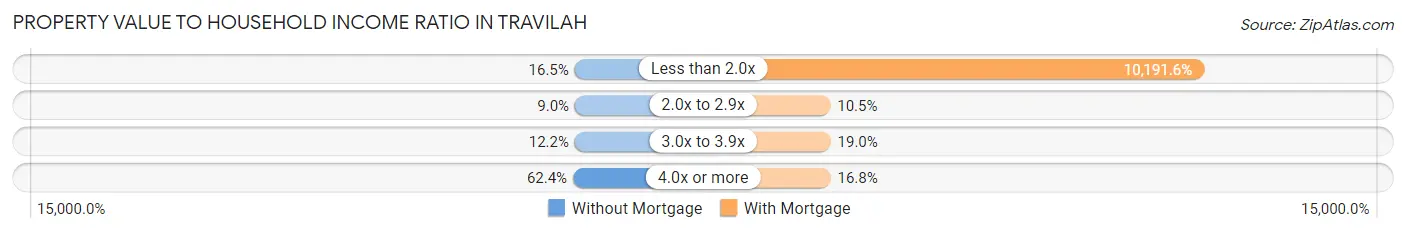
| Value-to-Income Ratio | Without Mortgage | With Mortgage |
| Less than 2.0x | 182 (16.5%) | 250,001 (10,191.6%) |
| 2.0x to 2.9x | 99 (8.9%) | 257 (10.5%) |
| 3.0x to 3.9x | 135 (12.2%) | 467 (19.0%) |
| 4.0x or more | 690 (62.4%) | 413 (16.8%) |
| Total | 1,106 (100.0%) | 2,453 (100.0%) |
Real Estate Taxes by Mortgage Status in Travilah
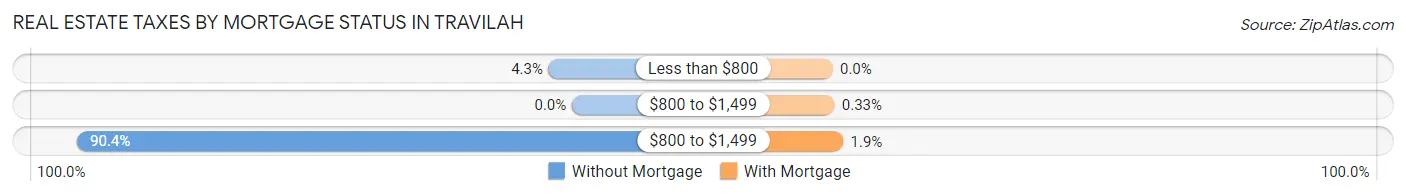
| Property Taxes | Without Mortgage | With Mortgage |
| Less than $800 | 47 (4.3%) | 0 (0.0%) |
| $800 to $1,499 | 0 (0.0%) | 8 (0.3%) |
| $800 to $1,499 | 1,000 (90.4%) | 47 (1.9%) |
| Total | 1,106 (100.0%) | 2,453 (100.0%) |
Health & Disability in Travilah
Health Insurance Coverage by Age in Travilah
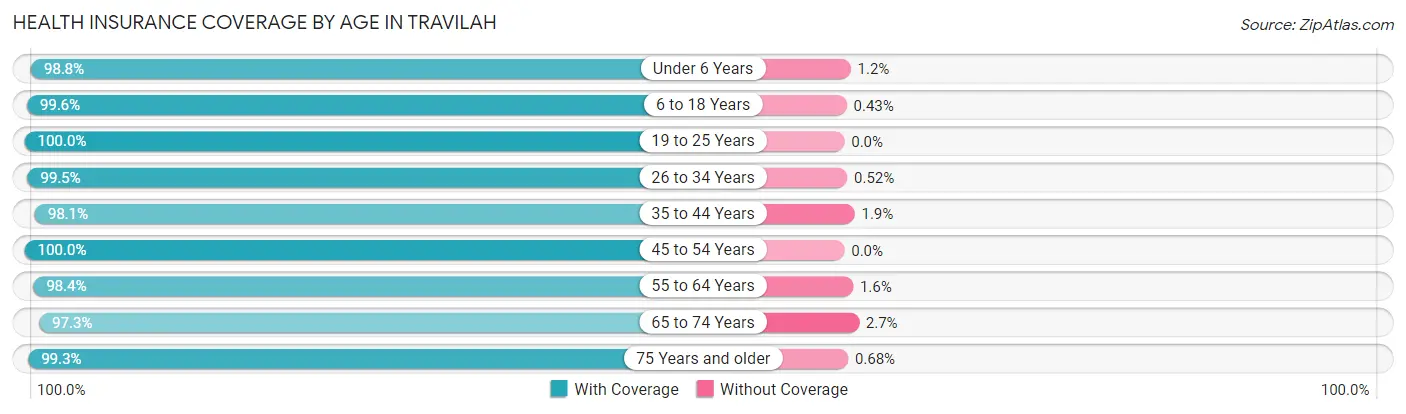
| Age Bracket | With Coverage | Without Coverage |
| Under 6 Years | 509 (98.8%) | 6 (1.2%) |
| 6 to 18 Years | 1,841 (99.6%) | 8 (0.4%) |
| 19 to 25 Years | 759 (100.0%) | 0 (0.0%) |
| 26 to 34 Years | 384 (99.5%) | 2 (0.5%) |
| 35 to 44 Years | 821 (98.1%) | 16 (1.9%) |
| 45 to 54 Years | 2,033 (100.0%) | 0 (0.0%) |
| 55 to 64 Years | 2,061 (98.4%) | 34 (1.6%) |
| 65 to 74 Years | 1,291 (97.3%) | 36 (2.7%) |
| 75 Years and older | 1,020 (99.3%) | 7 (0.7%) |
| Total | 10,719 (99.0%) | 109 (1.0%) |
Health Insurance Coverage by Citizenship Status in Travilah
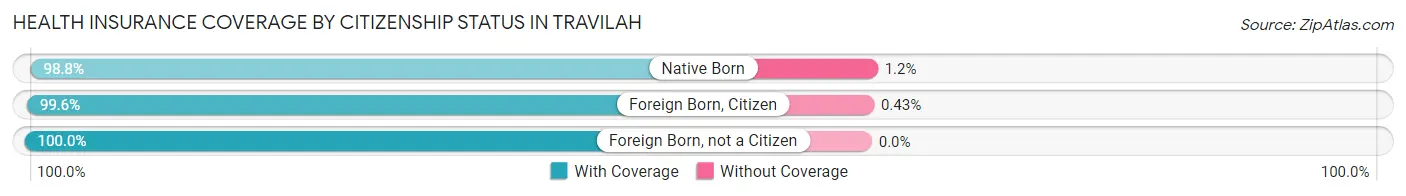
| Citizenship Status | With Coverage | Without Coverage |
| Native Born | 509 (98.8%) | 6 (1.2%) |
| Foreign Born, Citizen | 1,841 (99.6%) | 8 (0.4%) |
| Foreign Born, not a Citizen | 759 (100.0%) | 0 (0.0%) |
Health Insurance Coverage by Household Income in Travilah
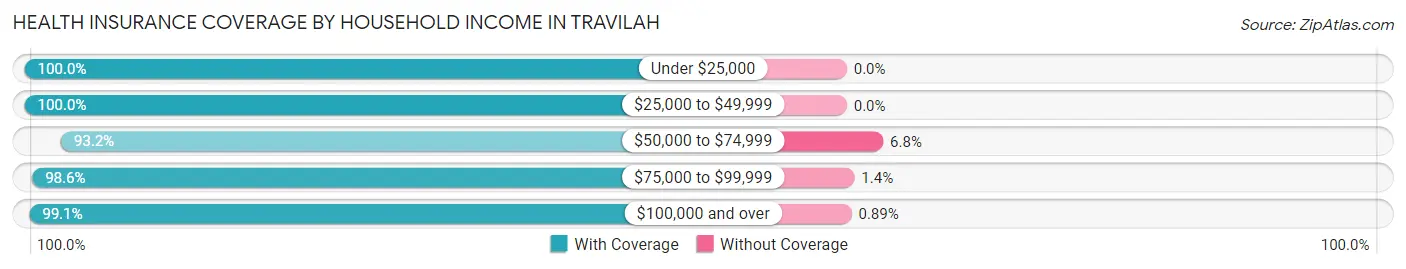
| Household Income | With Coverage | Without Coverage |
| Under $25,000 | 156 (100.0%) | 0 (0.0%) |
| $25,000 to $49,999 | 329 (100.0%) | 0 (0.0%) |
| $50,000 to $74,999 | 219 (93.2%) | 16 (6.8%) |
| $75,000 to $99,999 | 620 (98.6%) | 9 (1.4%) |
| $100,000 and over | 9,392 (99.1%) | 84 (0.9%) |
Public vs Private Health Insurance Coverage by Age in Travilah
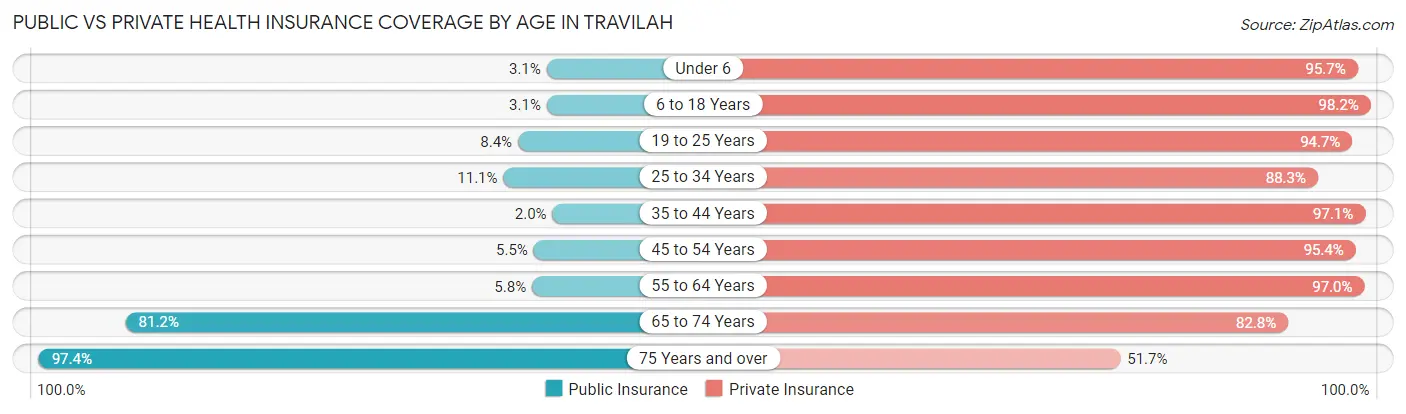
| Age Bracket | Public Insurance | Private Insurance |
| Under 6 | 16 (3.1%) | 493 (95.7%) |
| 6 to 18 Years | 57 (3.1%) | 1,815 (98.2%) |
| 19 to 25 Years | 64 (8.4%) | 719 (94.7%) |
| 25 to 34 Years | 43 (11.1%) | 341 (88.3%) |
| 35 to 44 Years | 17 (2.0%) | 813 (97.1%) |
| 45 to 54 Years | 112 (5.5%) | 1,939 (95.4%) |
| 55 to 64 Years | 122 (5.8%) | 2,032 (97.0%) |
| 65 to 74 Years | 1,078 (81.2%) | 1,099 (82.8%) |
| 75 Years and over | 1,000 (97.4%) | 531 (51.7%) |
| Total | 2,509 (23.2%) | 9,782 (90.3%) |
Disability Status by Sex by Age in Travilah
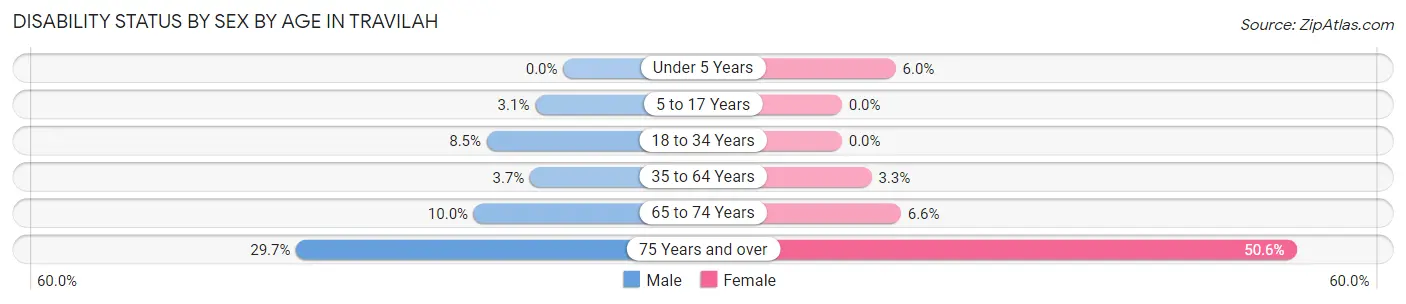
| Age Bracket | Male | Female |
| Under 5 Years | 0 (0.0%) | 10 (6.0%) |
| 5 to 17 Years | 28 (3.1%) | 0 (0.0%) |
| 18 to 34 Years | 49 (8.5%) | 0 (0.0%) |
| 35 to 64 Years | 93 (3.7%) | 81 (3.3%) |
| 65 to 74 Years | 70 (10.0%) | 41 (6.6%) |
| 75 Years and over | 138 (29.7%) | 285 (50.6%) |
Disability Class by Sex by Age in Travilah
Disability Class: Hearing Difficulty
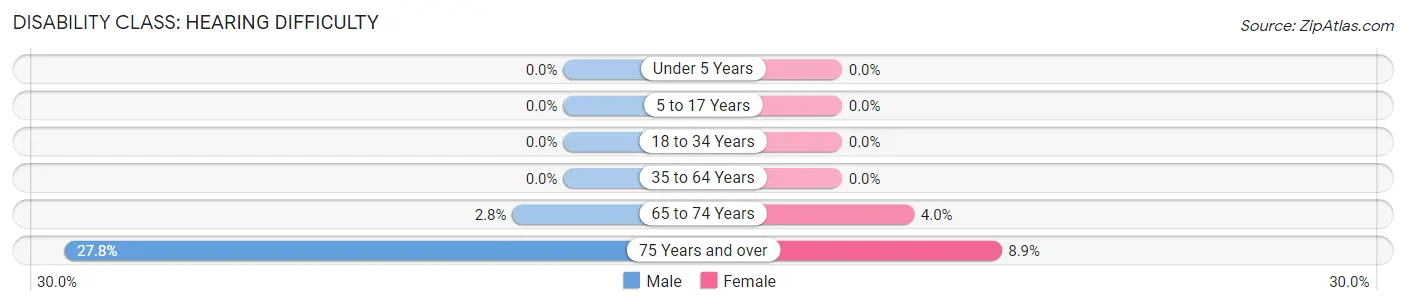
| Age Bracket | Male | Female |
| Under 5 Years | 0 (0.0%) | 0 (0.0%) |
| 5 to 17 Years | 0 (0.0%) | 0 (0.0%) |
| 18 to 34 Years | 0 (0.0%) | 0 (0.0%) |
| 35 to 64 Years | 0 (0.0%) | 0 (0.0%) |
| 65 to 74 Years | 20 (2.8%) | 25 (4.0%) |
| 75 Years and over | 129 (27.8%) | 50 (8.9%) |
Disability Class: Vision Difficulty
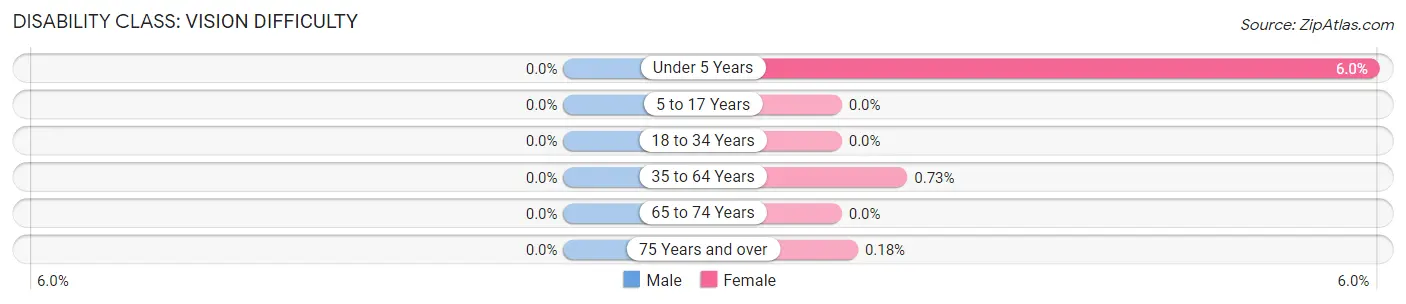
| Age Bracket | Male | Female |
| Under 5 Years | 0 (0.0%) | 10 (6.0%) |
| 5 to 17 Years | 0 (0.0%) | 0 (0.0%) |
| 18 to 34 Years | 0 (0.0%) | 0 (0.0%) |
| 35 to 64 Years | 0 (0.0%) | 18 (0.7%) |
| 65 to 74 Years | 0 (0.0%) | 0 (0.0%) |
| 75 Years and over | 0 (0.0%) | 1 (0.2%) |
Disability Class: Cognitive Difficulty
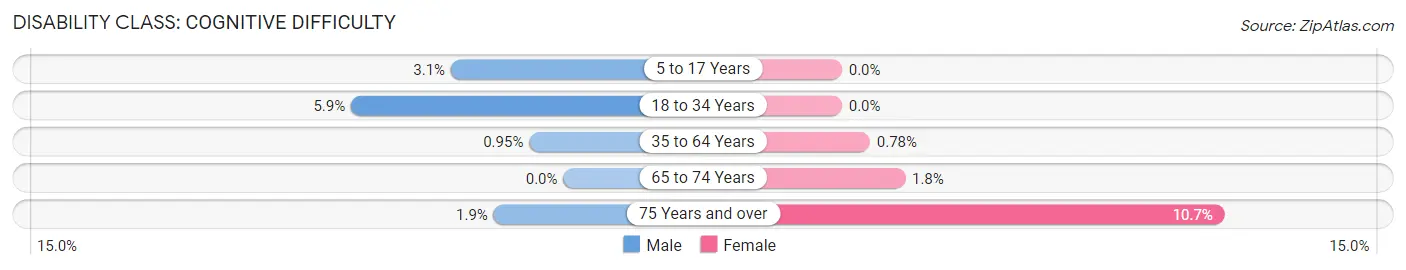
| Age Bracket | Male | Female |
| 5 to 17 Years | 28 (3.1%) | 0 (0.0%) |
| 18 to 34 Years | 34 (5.9%) | 0 (0.0%) |
| 35 to 64 Years | 24 (0.9%) | 19 (0.8%) |
| 65 to 74 Years | 0 (0.0%) | 11 (1.8%) |
| 75 Years and over | 9 (1.9%) | 60 (10.7%) |
Disability Class: Ambulatory Difficulty
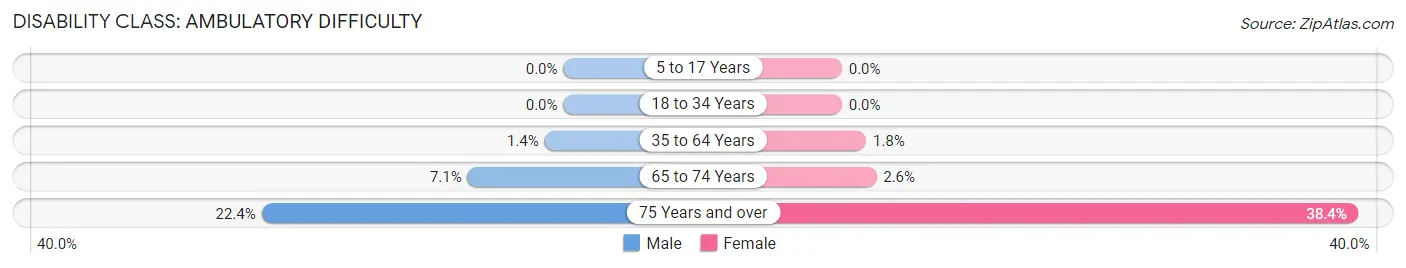
| Age Bracket | Male | Female |
| 5 to 17 Years | 0 (0.0%) | 0 (0.0%) |
| 18 to 34 Years | 0 (0.0%) | 0 (0.0%) |
| 35 to 64 Years | 35 (1.4%) | 44 (1.8%) |
| 65 to 74 Years | 50 (7.1%) | 16 (2.6%) |
| 75 Years and over | 104 (22.4%) | 216 (38.4%) |
Disability Class: Self-Care Difficulty
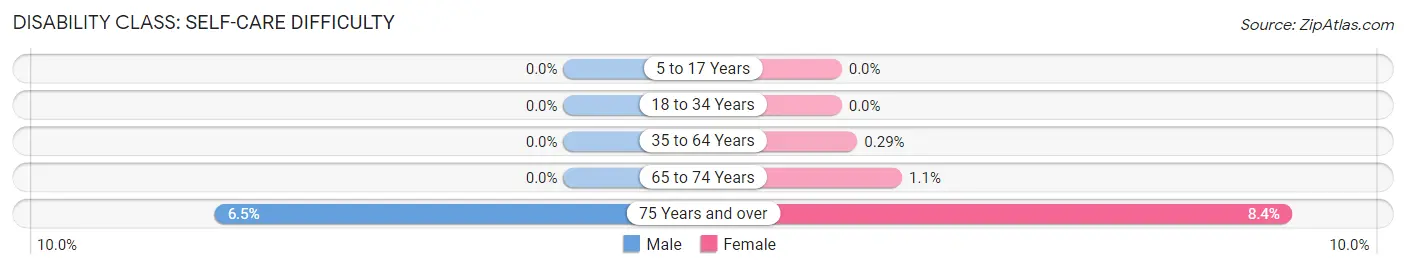
| Age Bracket | Male | Female |
| 5 to 17 Years | 0 (0.0%) | 0 (0.0%) |
| 18 to 34 Years | 0 (0.0%) | 0 (0.0%) |
| 35 to 64 Years | 0 (0.0%) | 7 (0.3%) |
| 65 to 74 Years | 0 (0.0%) | 7 (1.1%) |
| 75 Years and over | 30 (6.5%) | 47 (8.4%) |
Technology Access in Travilah
Computing Device Access in Travilah
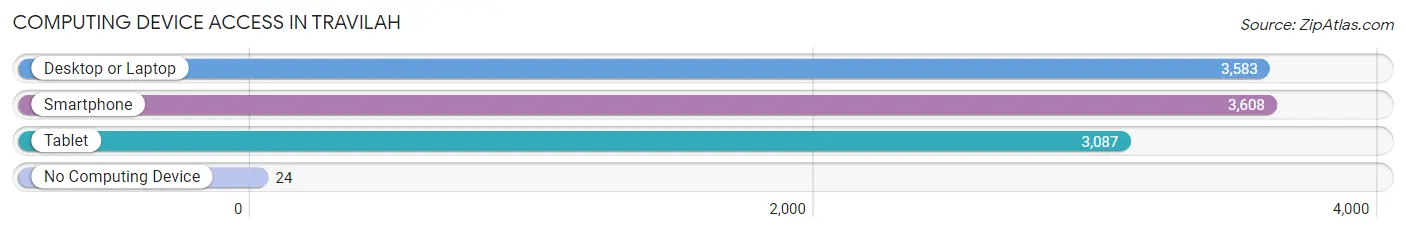
| Device Type | # Households | % Households |
| Desktop or Laptop | 3,583 | 96.8% |
| Smartphone | 3,608 | 97.4% |
| Tablet | 3,087 | 83.4% |
| No Computing Device | 24 | 0.6% |
| Total | 3,703 | 100.0% |
Internet Access in Travilah
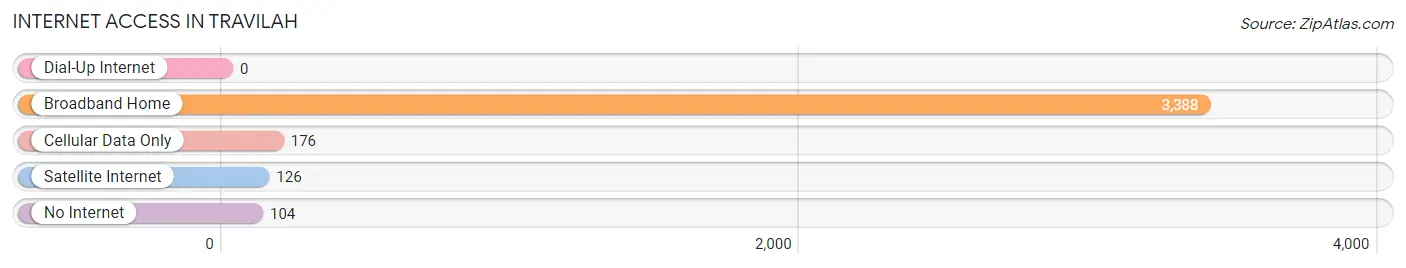
| Internet Type | # Households | % Households |
| Dial-Up Internet | 0 | 0.0% |
| Broadband Home | 3,388 | 91.5% |
| Cellular Data Only | 176 | 4.8% |
| Satellite Internet | 126 | 3.4% |
| No Internet | 104 | 2.8% |
| Total | 3,703 | 100.0% |
Travilah Summary
Travilah is an unincorporated community located in Montgomery County, Maryland. It is situated in the northern part of the county, approximately 20 miles northwest of Washington, D.C. The community is bordered by Potomac to the east, Poolesville to the west, and Gaithersburg to the south.
History
The area that is now Travilah was first settled in the late 1700s by the Travilah family, who were of English descent. The family owned a large tract of land in the area, which was known as Travilah Manor. The manor house was built in 1790 and is still standing today.
In the early 1800s, the area was home to a number of small farms and mills. The area was also home to a number of churches, including the Travilah Methodist Episcopal Church, which was established in 1820.
In the late 1800s, the area began to develop as a residential community. The Travilah post office was established in 1891, and the community was officially incorporated in 1895.
Geography
Travilah is located in northern Montgomery County, approximately 20 miles northwest of Washington, D.C. The community is bordered by Potomac to the east, Poolesville to the west, and Gaithersburg to the south.
The area is characterized by rolling hills and valleys, with the highest point in the area being the summit of Travilah Hill, which is located at an elevation of 845 feet. The area is also home to a number of creeks and streams, including Travilah Creek, which flows through the community.
Economy
The economy of Travilah is largely based on the service industry. The community is home to a number of restaurants, retail stores, and other businesses. The area is also home to a number of professional offices, including law firms, accounting firms, and medical offices.
The area is also home to a number of government agencies, including the Montgomery County Department of Parks and Recreation, the Montgomery County Department of Transportation, and the Montgomery County Department of Public Works.
Demographics
As of the 2010 census, the population of Travilah was 4,845. The racial makeup of the community was 79.3% White, 11.2% African American, 4.2% Asian, and 4.3% Hispanic or Latino.
The median household income in Travilah was $117,945, and the median family income was $133,945. The per capita income was $50,945.
The unemployment rate in Travilah was 3.2%, which was lower than the national average of 5.2%. The poverty rate in the community was 2.3%, which was lower than the national average of 12.3%.
Conclusion
Travilah is an unincorporated community located in Montgomery County, Maryland. It is situated in the northern part of the county, approximately 20 miles northwest of Washington, D.C. The community is bordered by Potomac to the east, Poolesville to the west, and Gaithersburg to the south. The area was first settled in the late 1700s by the Travilah family, and the community was officially incorporated in 1895. The economy of Travilah is largely based on the service industry, and the population of the community was 4,845 as of the 2010 census. The median household income in Travilah was $117,945, and the unemployment rate was 3.2%.
Common Questions
What is Per Capita Income in Travilah?
Per Capita income in Travilah is $115,651.
What is the Median Family Income in Travilah?
Median Family Income in Travilah is $250,001.
What is the Median Household income in Travilah?
Median Household Income in Travilah is $248,703.
What is Income or Wage Gap in Travilah?
Income or Wage Gap in Travilah is 44.2%.
Women in Travilah earn 55.8 cents for every dollar earned by a man.
What is Inequality or Gini Index in Travilah?
Inequality or Gini Index in Travilah is 0.44.
What is the Total Population of Travilah?
Total Population of Travilah is 10,846.
What is the Total Male Population of Travilah?
Total Male Population of Travilah is 5,458.
What is the Total Female Population of Travilah?
Total Female Population of Travilah is 5,388.
What is the Ratio of Males per 100 Females in Travilah?
There are 101.30 Males per 100 Females in Travilah.
What is the Ratio of Females per 100 Males in Travilah?
There are 98.72 Females per 100 Males in Travilah.
What is the Median Population Age in Travilah?
Median Population Age in Travilah is 50.8 Years.
What is the Average Family Size in Travilah
Average Family Size in Travilah is 3.1 People.
What is the Average Household Size in Travilah
Average Household Size in Travilah is 2.9 People.
How Large is the Labor Force in Travilah?
There are 5,716 People in the Labor Forcein in Travilah.
What is the Percentage of People in the Labor Force in Travilah?
62.9% of People are in the Labor Force in Travilah.
What is the Unemployment Rate in Travilah?
Unemployment Rate in Travilah is 3.7%.