Cities with the Largest Guyanese Community in the United States
RELATED REPORTS & OPTIONS
Guyanese
United States
Compare Cities
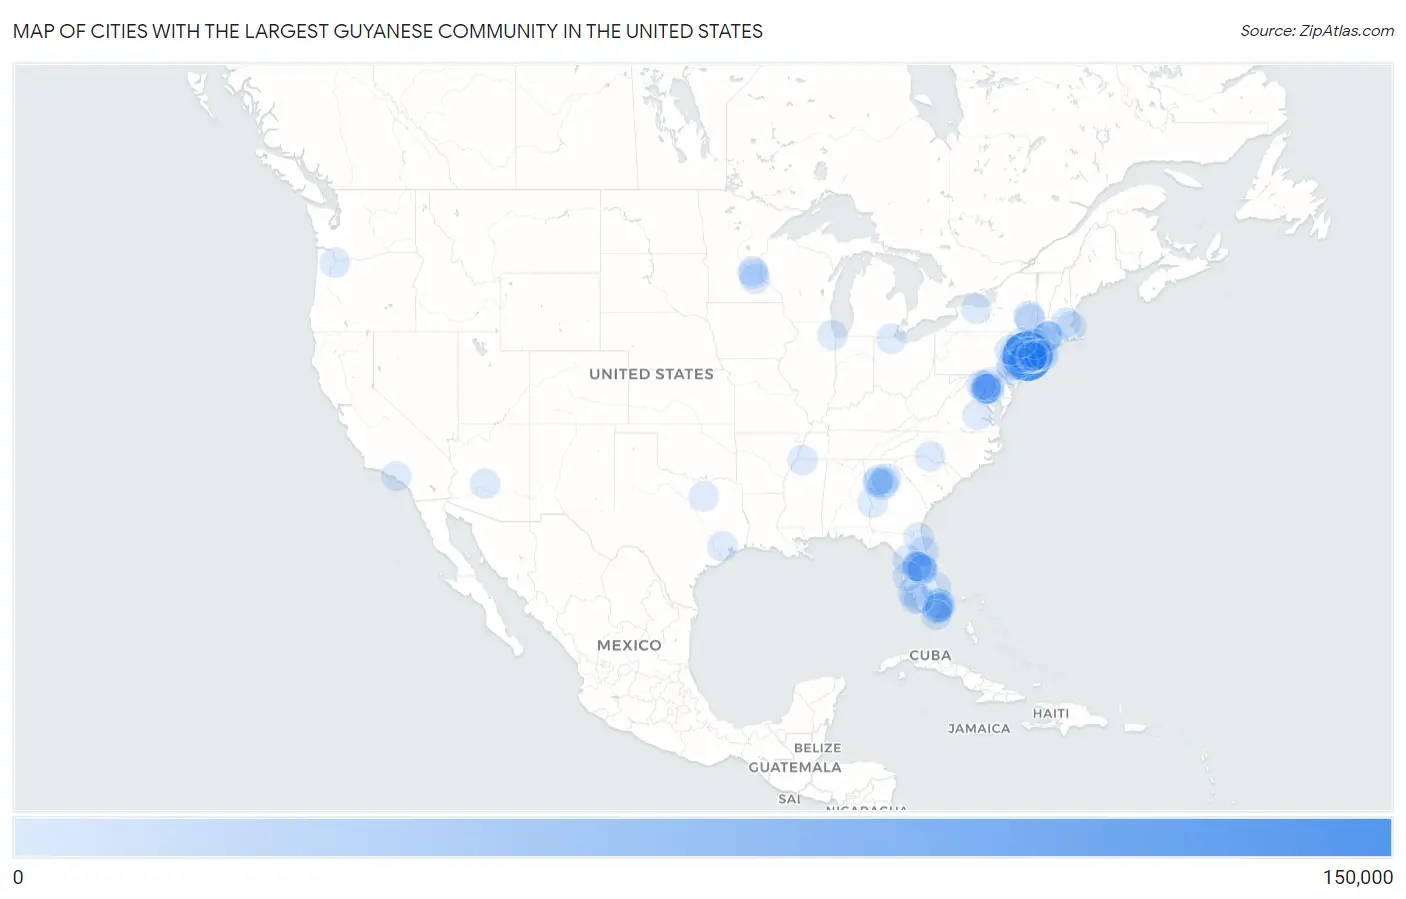
Map of Cities with the Largest Guyanese Community in the United States
0
150,000
Cities with the Largest Guyanese Community in the United States
| City | Guyanese | vs State | vs National | |
| 1. | New York | 124,637 | 151,380(82.33%)#1 | 258,522(48.21%)#1 |
| 2. | Schenectady | 4,481 | 151,380(2.96%)#2 | 258,522(1.73%)#2 |
| 3. | Jersey City | 4,022 | 24,805(16.21%)#1 | 258,522(1.56%)#3 |
| 4. | East Orange | 3,606 | 24,805(14.54%)#2 | 258,522(1.39%)#4 |
| 5. | Newark | 2,572 | 24,805(10.37%)#3 | 258,522(0.99%)#5 |
| 6. | Clermont | 1,933 | 26,596(7.27%)#1 | 258,522(0.75%)#6 |
| 7. | Elmont | 1,902 | 151,380(1.26%)#3 | 258,522(0.74%)#7 |
| 8. | Pine Hills | 1,402 | 26,596(5.27%)#2 | 258,522(0.54%)#8 |
| 9. | Valley Stream | 1,094 | 151,380(0.72%)#4 | 258,522(0.42%)#9 |
| 10. | Stonecrest | 1,057 | 11,516(9.18%)#1 | 258,522(0.41%)#10 |
| 11. | Waterbury | 823 | 4,471(18.41%)#1 | 258,522(0.32%)#11 |
| 12. | Sunrise | 822 | 26,596(3.09%)#3 | 258,522(0.32%)#12 |
| 13. | Jacksonville | 813 | 26,596(3.06%)#4 | 258,522(0.31%)#13 |
| 14. | Villas | 794 | 26,596(2.99%)#5 | 258,522(0.31%)#14 |
| 15. | Hartford | 776 | 4,471(17.36%)#2 | 258,522(0.30%)#15 |
| 16. | Washington | 718 | 718(100.00%)#1 | 258,522(0.28%)#16 |
| 17. | Baltimore | 691 | 8,441(8.19%)#1 | 258,522(0.27%)#17 |
| 18. | Albany | 686 | 151,380(0.45%)#5 | 258,522(0.27%)#18 |
| 19. | Coram | 676 | 151,380(0.45%)#6 | 258,522(0.26%)#19 |
| 20. | Boston | 633 | 2,072(30.55%)#1 | 258,522(0.24%)#20 |
| 21. | Citrus Springs | 624 | 26,596(2.35%)#6 | 258,522(0.24%)#21 |
| 22. | Hempstead | 622 | 151,380(0.41%)#7 | 258,522(0.24%)#22 |
| 23. | North Valley Stream | 621 | 151,380(0.41%)#8 | 258,522(0.24%)#23 |
| 24. | Coral Springs | 617 | 26,596(2.32%)#7 | 258,522(0.24%)#24 |
| 25. | Ocoee | 606 | 26,596(2.28%)#8 | 258,522(0.23%)#25 |
| 26. | Philadelphia | 598 | 3,609(16.57%)#1 | 258,522(0.23%)#26 |
| 27. | Chicago | 590 | 1,464(40.30%)#1 | 258,522(0.23%)#27 |
| 28. | Mount Vernon | 585 | 151,380(0.39%)#9 | 258,522(0.23%)#28 |
| 29. | Charlotte | 580 | 2,436(23.81%)#1 | 258,522(0.22%)#29 |
| 30. | New Brunswick | 559 | 24,805(2.25%)#4 | 258,522(0.22%)#30 |
| 31. | Columbus | 529 | 11,516(4.59%)#2 | 258,522(0.20%)#31 |
| 32. | Horsham | 517 | 3,609(14.33%)#2 | 258,522(0.20%)#32 |
| 33. | Bowie | 512 | 8,441(6.07%)#2 | 258,522(0.20%)#33 |
| 34. | Pompano Beach | 492 | 26,596(1.85%)#9 | 258,522(0.19%)#34 |
| 35. | Paterson | 453 | 24,805(1.83%)#5 | 258,522(0.18%)#35 |
| 36. | Baldwin | 445 | 151,380(0.29%)#10 | 258,522(0.17%)#36 |
| 37. | Stockbridge | 445 | 11,516(3.86%)#3 | 258,522(0.17%)#37 |
| 38. | Atlanta | 435 | 11,516(3.78%)#4 | 258,522(0.17%)#38 |
| 39. | Toledo | 415 | 1,577(26.32%)#1 | 258,522(0.16%)#39 |
| 40. | Elizabeth | 415 | 24,805(1.67%)#6 | 258,522(0.16%)#40 |
| 41. | Loganville | 415 | 11,516(3.60%)#5 | 258,522(0.16%)#41 |
| 42. | Orlando | 410 | 26,596(1.54%)#10 | 258,522(0.16%)#42 |
| 43. | Houston | 397 | 2,893(13.72%)#1 | 258,522(0.15%)#43 |
| 44. | Uniondale | 391 | 151,380(0.26%)#11 | 258,522(0.15%)#44 |
| 45. | Pembroke Pines | 390 | 26,596(1.47%)#11 | 258,522(0.15%)#45 |
| 46. | South Fulton | 389 | 11,516(3.38%)#6 | 258,522(0.15%)#46 |
| 47. | Yonkers | 388 | 151,380(0.26%)#12 | 258,522(0.15%)#47 |
| 48. | Palm Coast | 387 | 26,596(1.46%)#12 | 258,522(0.15%)#48 |
| 49. | Brentwood | 377 | 151,380(0.25%)#13 | 258,522(0.15%)#49 |
| 50. | Lakeview | 376 | 151,380(0.25%)#14 | 258,522(0.15%)#50 |
| 51. | Rochester | 367 | 151,380(0.24%)#15 | 258,522(0.14%)#51 |
| 52. | Linden | 367 | 24,805(1.48%)#7 | 258,522(0.14%)#52 |
| 53. | Port Charlotte | 363 | 26,596(1.36%)#13 | 258,522(0.14%)#53 |
| 54. | Los Angeles | 362 | 3,934(9.20%)#1 | 258,522(0.14%)#54 |
| 55. | Woodmere | 354 | 151,380(0.23%)#16 | 258,522(0.14%)#55 |
| 56. | Miramar | 351 | 26,596(1.32%)#14 | 258,522(0.14%)#56 |
| 57. | Richmond | 342 | 2,196(15.57%)#1 | 258,522(0.13%)#57 |
| 58. | Wyandanch | 340 | 151,380(0.22%)#17 | 258,522(0.13%)#58 |
| 59. | Hackensack | 334 | 24,805(1.35%)#8 | 258,522(0.13%)#59 |
| 60. | Port St Lucie | 332 | 26,596(1.25%)#15 | 258,522(0.13%)#60 |
| 61. | Dallas | 331 | 2,893(11.44%)#2 | 258,522(0.13%)#61 |
| 62. | Freeport | 325 | 151,380(0.21%)#18 | 258,522(0.13%)#62 |
| 63. | East Hartford | 323 | 4,471(7.22%)#3 | 258,522(0.12%)#63 |
| 64. | Olive Branch | 323 | 430(75.12%)#1 | 258,522(0.12%)#64 |
| 65. | Fairwood | 316 | 8,441(3.74%)#3 | 258,522(0.12%)#65 |
| 66. | Trenton | 310 | 24,805(1.25%)#9 | 258,522(0.12%)#66 |
| 67. | Riverdale Park | 294 | 8,441(3.48%)#4 | 258,522(0.11%)#67 |
| 68. | Levittown | 293 | 151,380(0.19%)#19 | 258,522(0.11%)#68 |
| 69. | Hanscom Afb | 292 | 2,072(14.09%)#2 | 258,522(0.11%)#69 |
| 70. | Manchester | 291 | 4,471(6.51%)#4 | 258,522(0.11%)#70 |
| 71. | Salisbury | 289 | 151,380(0.19%)#20 | 258,522(0.11%)#71 |
| 72. | Hicksville | 285 | 151,380(0.19%)#21 | 258,522(0.11%)#72 |
| 73. | Columbia | 283 | 8,441(3.35%)#5 | 258,522(0.11%)#73 |
| 74. | Minneapolis | 282 | 2,667(10.57%)#1 | 258,522(0.11%)#74 |
| 75. | Deer Park | 282 | 151,380(0.19%)#22 | 258,522(0.11%)#75 |
| 76. | Hollywood | 279 | 26,596(1.05%)#16 | 258,522(0.11%)#76 |
| 77. | South Valley Stream | 279 | 151,380(0.18%)#23 | 258,522(0.11%)#77 |
| 78. | Apple Valley | 278 | 2,667(10.42%)#2 | 258,522(0.11%)#78 |
| 79. | Groveland | 278 | 26,596(1.05%)#17 | 258,522(0.11%)#79 |
| 80. | Portland | 265 | 308(86.04%)#1 | 258,522(0.10%)#80 |
| 81. | Plainfield | 261 | 24,805(1.05%)#10 | 258,522(0.10%)#81 |
| 82. | South Plainfield Borough | 261 | 24,805(1.05%)#11 | 258,522(0.10%)#82 |
| 83. | East Riverdale | 261 | 8,441(3.09%)#6 | 258,522(0.10%)#83 |
| 84. | Phoenix | 256 | 678(37.76%)#1 | 258,522(0.10%)#84 |
| 85. | Tampa | 256 | 26,596(0.96%)#18 | 258,522(0.10%)#85 |
| 86. | Meadow Woods | 255 | 26,596(0.96%)#19 | 258,522(0.10%)#86 |
| 87. | Minneola | 251 | 26,596(0.94%)#20 | 258,522(0.10%)#87 |
| 88. | South Miami Heights | 250 | 26,596(0.94%)#21 | 258,522(0.10%)#88 |
| 89. | Germantown | 247 | 8,441(2.93%)#7 | 258,522(0.10%)#89 |
| 90. | Panther Valley | 245 | 24,805(0.99%)#12 | 258,522(0.09%)#90 |
| 91. | Glen Cove | 238 | 151,380(0.16%)#24 | 258,522(0.09%)#91 |
| 92. | Lehigh Acres | 237 | 26,596(0.89%)#22 | 258,522(0.09%)#92 |
| 93. | North Bay Shore | 237 | 151,380(0.16%)#25 | 258,522(0.09%)#93 |
| 94. | Old Bridge | 236 | 24,805(0.95%)#13 | 258,522(0.09%)#94 |
| 95. | Danbury | 234 | 4,471(5.23%)#5 | 258,522(0.09%)#95 |
| 96. | Shirley | 234 | 151,380(0.15%)#26 | 258,522(0.09%)#96 |
| 97. | West Hempstead | 233 | 151,380(0.15%)#27 | 258,522(0.09%)#97 |
| 98. | Penn Estates | 233 | 3,609(6.46%)#3 | 258,522(0.09%)#98 |
| 99. | Brooklyn Park | 227 | 2,667(8.51%)#3 | 258,522(0.09%)#99 |
| 100. | Middletown | 227 | 151,380(0.15%)#28 | 258,522(0.09%)#100 |
Common Questions
What are the Top 10 Cities with the Largest Guyanese Community in the United States?
Top 10 Cities with the Largest Guyanese Community in the United States are:
#1
124,637
#2
4,481
#3
4,022
#4
3,606
#5
2,572
#6
1,933
#7
1,902
#8
1,402
#9
1,094
#10
1,057
What city has the Largest Guyanese Community in the United States?
New York has the Largest Guyanese Community in the United States with 124,637.
What is the Total Guyanese Population in the United States?
Total Guyanese Population in the United States is 258,522.