Cities with the Largest Jordanian Community in the United States
RELATED REPORTS & OPTIONS
Jordanian
United States
Compare Cities
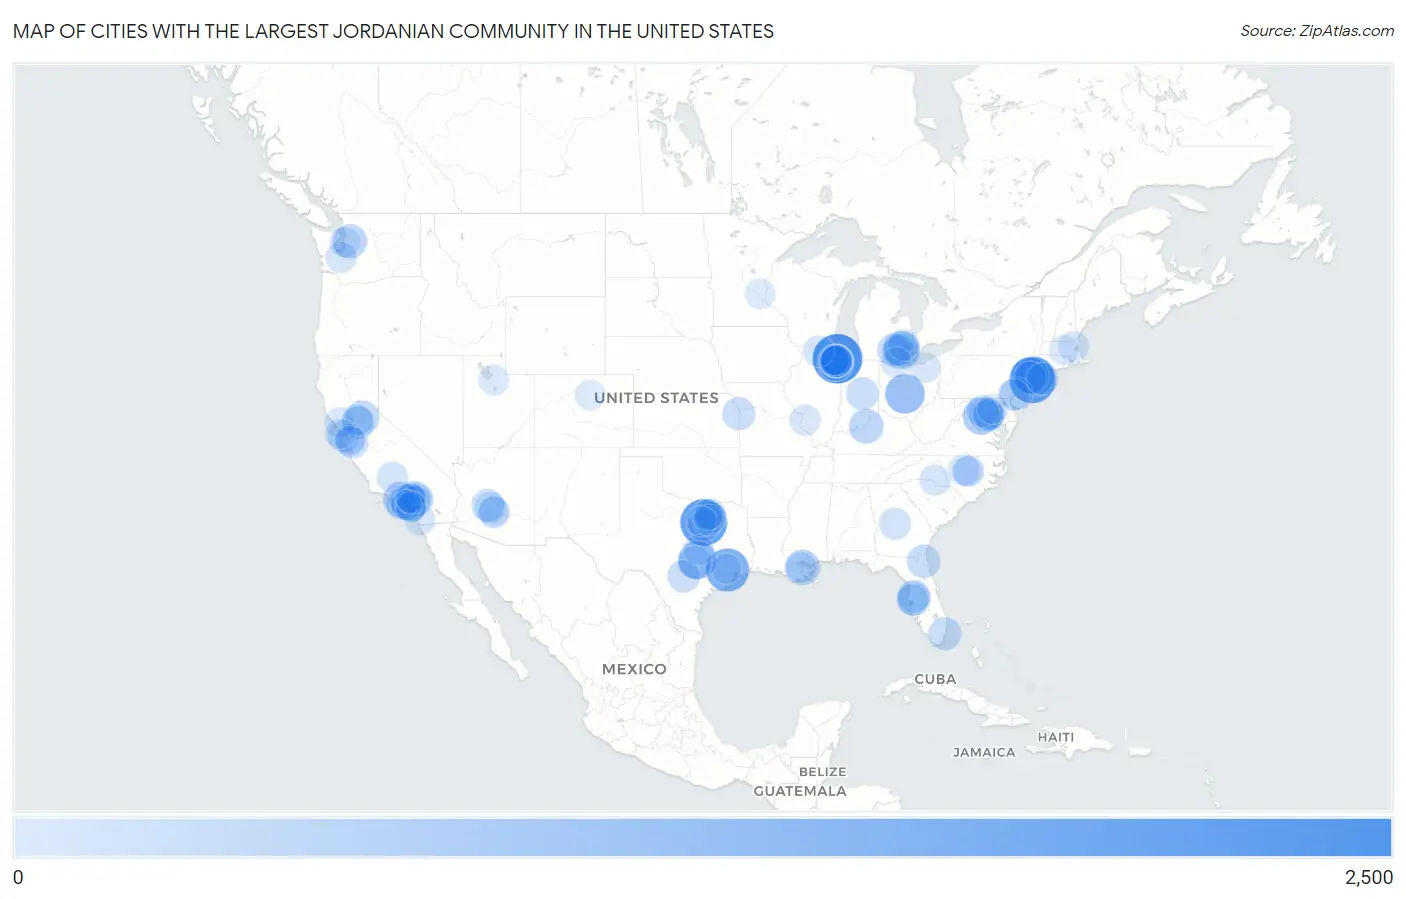
Map of Cities with the Largest Jordanian Community in the United States
0
2,500
Cities with the Largest Jordanian Community in the United States
| City | Jordanian | vs State | vs National | |
| 1. | Chicago | 2,243 | 10,181(22.03%)#1 | 93,877(2.39%)#1 |
| 2. | Arlington | 1,945 | 12,000(16.21%)#1 | 93,877(2.07%)#2 |
| 3. | New York | 1,887 | 6,042(31.23%)#1 | 93,877(2.01%)#3 |
| 4. | Houston | 1,543 | 12,000(12.86%)#2 | 93,877(1.64%)#4 |
| 5. | Columbus | 1,153 | 4,762(24.21%)#1 | 93,877(1.23%)#5 |
| 6. | Yonkers | 1,066 | 6,042(17.64%)#2 | 93,877(1.14%)#6 |
| 7. | Pflugerville | 1,052 | 12,000(8.77%)#3 | 93,877(1.12%)#7 |
| 8. | Paterson | 993 | 5,525(17.97%)#1 | 93,877(1.06%)#8 |
| 9. | Dearborn | 949 | 5,144(18.45%)#1 | 93,877(1.01%)#9 |
| 10. | Linton Hall | 863 | 4,223(20.44%)#1 | 93,877(0.92%)#10 |
| 11. | Los Angeles | 809 | 15,752(5.14%)#1 | 93,877(0.86%)#11 |
| 12. | Anaheim | 807 | 15,752(5.12%)#2 | 93,877(0.86%)#12 |
| 13. | Metairie | 707 | 1,743(40.56%)#1 | 93,877(0.75%)#13 |
| 14. | Louisville | 641 | 963(66.56%)#1 | 93,877(0.68%)#14 |
| 15. | Orland Park | 631 | 10,181(6.20%)#2 | 93,877(0.67%)#15 |
| 16. | Oak Lawn | 614 | 10,181(6.03%)#3 | 93,877(0.65%)#16 |
| 17. | Tinley Park | 603 | 10,181(5.92%)#4 | 93,877(0.64%)#17 |
| 18. | Union Hill Novelty Hill | 600 | 2,235(26.85%)#1 | 93,877(0.64%)#18 |
| 19. | Folsom | 560 | 15,752(3.56%)#3 | 93,877(0.60%)#19 |
| 20. | Woodburn | 553 | 4,223(13.09%)#2 | 93,877(0.59%)#20 |
| 21. | Temple Terrace | 521 | 4,686(11.12%)#1 | 93,877(0.55%)#21 |
| 22. | Dearborn Heights | 519 | 5,144(10.09%)#2 | 93,877(0.55%)#22 |
| 23. | Jacksonville | 512 | 4,686(10.93%)#2 | 93,877(0.55%)#23 |
| 24. | North Bay Village | 482 | 4,686(10.29%)#3 | 93,877(0.51%)#24 |
| 25. | Austin | 478 | 12,000(3.98%)#4 | 93,877(0.51%)#25 |
| 26. | Philadelphia | 472 | 1,932(24.43%)#1 | 93,877(0.50%)#26 |
| 27. | Ann Arbor | 461 | 5,144(8.96%)#3 | 93,877(0.49%)#27 |
| 28. | Overland Park | 453 | 841(53.86%)#1 | 93,877(0.48%)#28 |
| 29. | Palos Hills | 449 | 10,181(4.41%)#5 | 93,877(0.48%)#29 |
| 30. | Fishers | 440 | 1,655(26.59%)#1 | 93,877(0.47%)#30 |
| 31. | San Antonio | 430 | 12,000(3.58%)#5 | 93,877(0.46%)#31 |
| 32. | Wesley Chapel | 430 | 4,686(9.18%)#4 | 93,877(0.46%)#32 |
| 33. | Worth | 415 | 10,181(4.08%)#6 | 93,877(0.44%)#33 |
| 34. | Elk Grove | 414 | 15,752(2.63%)#4 | 93,877(0.44%)#34 |
| 35. | Rancho Cucamonga | 402 | 15,752(2.55%)#5 | 93,877(0.43%)#35 |
| 36. | Clifton | 392 | 5,525(7.10%)#2 | 93,877(0.42%)#36 |
| 37. | Arlington | 381 | 4,223(9.02%)#3 | 93,877(0.41%)#37 |
| 38. | Peoria | 381 | 2,059(18.50%)#1 | 93,877(0.41%)#38 |
| 39. | Mansfield | 370 | 12,000(3.08%)#6 | 93,877(0.39%)#39 |
| 40. | San Bernardino | 366 | 15,752(2.32%)#6 | 93,877(0.39%)#40 |
| 41. | Centerville | 363 | 997(36.41%)#1 | 93,877(0.39%)#41 |
| 42. | San Jose | 360 | 15,752(2.29%)#7 | 93,877(0.38%)#42 |
| 43. | Deer Park | 359 | 6,042(5.94%)#3 | 93,877(0.38%)#43 |
| 44. | Ashburn | 351 | 4,223(8.31%)#4 | 93,877(0.37%)#44 |
| 45. | Daly City | 349 | 15,752(2.22%)#8 | 93,877(0.37%)#45 |
| 46. | Hickory Hills | 348 | 10,181(3.42%)#7 | 93,877(0.37%)#46 |
| 47. | Loma Linda | 346 | 15,752(2.20%)#9 | 93,877(0.37%)#47 |
| 48. | Tampa | 342 | 4,686(7.30%)#5 | 93,877(0.36%)#48 |
| 49. | Chandler | 323 | 2,059(15.69%)#2 | 93,877(0.34%)#49 |
| 50. | Alexandria | 323 | 4,223(7.65%)#5 | 93,877(0.34%)#50 |
| 51. | Chicago Ridge | 322 | 10,181(3.16%)#8 | 93,877(0.34%)#51 |
| 52. | Bakersfield | 319 | 15,752(2.03%)#10 | 93,877(0.34%)#52 |
| 53. | Irvine | 314 | 15,752(1.99%)#11 | 93,877(0.33%)#53 |
| 54. | Westland | 305 | 5,144(5.93%)#4 | 93,877(0.32%)#54 |
| 55. | Monterey Park | 305 | 15,752(1.94%)#12 | 93,877(0.32%)#55 |
| 56. | Richardson | 302 | 12,000(2.52%)#7 | 93,877(0.32%)#56 |
| 57. | Phoenix | 297 | 2,059(14.42%)#3 | 93,877(0.32%)#57 |
| 58. | Sterling Heights | 295 | 5,144(5.73%)#5 | 93,877(0.31%)#58 |
| 59. | Mckinney | 292 | 12,000(2.43%)#8 | 93,877(0.31%)#59 |
| 60. | Riverside | 284 | 15,752(1.80%)#13 | 93,877(0.30%)#60 |
| 61. | Rockford | 284 | 10,181(2.79%)#9 | 93,877(0.30%)#61 |
| 62. | Yelm | 282 | 2,235(12.62%)#2 | 93,877(0.30%)#62 |
| 63. | Charlotte | 276 | 2,345(11.77%)#1 | 93,877(0.29%)#63 |
| 64. | Sacramento | 276 | 15,752(1.75%)#14 | 93,877(0.29%)#64 |
| 65. | Clayton | 276 | 2,345(11.77%)#2 | 93,877(0.29%)#65 |
| 66. | Cary | 273 | 2,345(11.64%)#3 | 93,877(0.29%)#66 |
| 67. | Folsom | 270 | 1,932(13.98%)#2 | 93,877(0.29%)#67 |
| 68. | Belleville | 269 | 10,181(2.64%)#10 | 93,877(0.29%)#68 |
| 69. | Torrance | 261 | 15,752(1.66%)#15 | 93,877(0.28%)#69 |
| 70. | Santa Rosa | 257 | 15,752(1.63%)#16 | 93,877(0.27%)#70 |
| 71. | Seattle | 255 | 2,235(11.41%)#3 | 93,877(0.27%)#71 |
| 72. | Kenner | 252 | 1,743(14.46%)#2 | 93,877(0.27%)#72 |
| 73. | San Diego | 250 | 15,752(1.59%)#17 | 93,877(0.27%)#73 |
| 74. | Westmont | 245 | 10,181(2.41%)#11 | 93,877(0.26%)#74 |
| 75. | Bedford | 244 | 4,762(5.12%)#2 | 93,877(0.26%)#75 |
| 76. | Toledo | 243 | 4,762(5.10%)#3 | 93,877(0.26%)#76 |
| 77. | Dallas | 241 | 12,000(2.01%)#9 | 93,877(0.26%)#77 |
| 78. | Burbank | 241 | 10,181(2.37%)#12 | 93,877(0.26%)#78 |
| 79. | Stoneham | 237 | 1,445(16.40%)#1 | 93,877(0.25%)#79 |
| 80. | Fremont | 224 | 15,752(1.42%)#18 | 93,877(0.24%)#80 |
| 81. | Sunnyvale | 224 | 15,752(1.42%)#19 | 93,877(0.24%)#81 |
| 82. | Millcreek | 224 | 373(60.05%)#1 | 93,877(0.24%)#82 |
| 83. | Lake Forest | 218 | 15,752(1.38%)#20 | 93,877(0.23%)#83 |
| 84. | Mission Viejo | 216 | 15,752(1.37%)#21 | 93,877(0.23%)#84 |
| 85. | Belton | 210 | 12,000(1.75%)#10 | 93,877(0.22%)#85 |
| 86. | Woodland Park Borough | 210 | 5,525(3.80%)#3 | 93,877(0.22%)#86 |
| 87. | Frisco | 207 | 12,000(1.73%)#11 | 93,877(0.22%)#87 |
| 88. | La Verne | 205 | 15,752(1.30%)#22 | 93,877(0.22%)#88 |
| 89. | Tempe | 204 | 2,059(9.91%)#4 | 93,877(0.22%)#89 |
| 90. | San Francisco | 203 | 15,752(1.29%)#23 | 93,877(0.22%)#90 |
| 91. | Huntington Beach | 203 | 15,752(1.29%)#24 | 93,877(0.22%)#91 |
| 92. | Blaine | 203 | 806(25.19%)#1 | 93,877(0.22%)#92 |
| 93. | North Laurel | 201 | 1,020(19.71%)#1 | 93,877(0.21%)#93 |
| 94. | Upland | 196 | 15,752(1.24%)#25 | 93,877(0.21%)#94 |
| 95. | Worcester | 194 | 1,445(13.43%)#2 | 93,877(0.21%)#95 |
| 96. | El Sobrante Cdp Riverside County | 194 | 15,752(1.23%)#26 | 93,877(0.21%)#96 |
| 97. | Jersey Village | 192 | 12,000(1.60%)#12 | 93,877(0.20%)#97 |
| 98. | Garner | 191 | 2,345(8.14%)#4 | 93,877(0.20%)#98 |
| 99. | Fort Worth | 190 | 12,000(1.58%)#13 | 93,877(0.20%)#99 |
| 100. | Westminster | 188 | 825(22.79%)#1 | 93,877(0.20%)#100 |
Common Questions
What are the Top 10 Cities with the Largest Jordanian Community in the United States?
Top 10 Cities with the Largest Jordanian Community in the United States are:
What city has the Largest Jordanian Community in the United States?
Chicago has the Largest Jordanian Community in the United States with 2,243.
What is the Total Jordanian Population in the United States?
Total Jordanian Population in the United States is 93,877.