Cities with the Largest Aleut Community in the United States
RELATED REPORTS & OPTIONS
Aleut
United States
Compare Cities
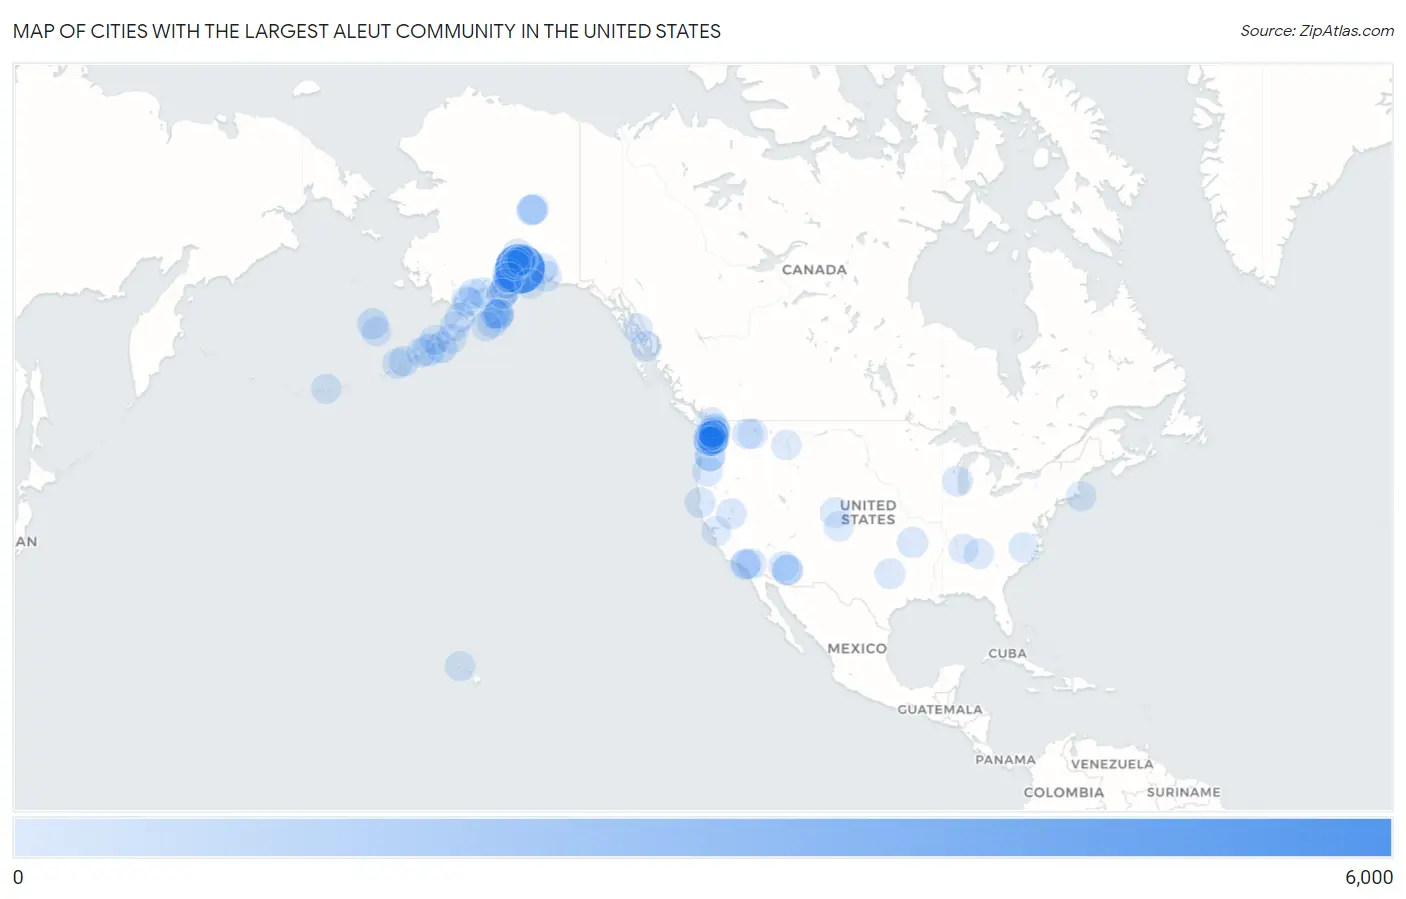
Map of Cities with the Largest Aleut Community in the United States
0
6,000
Cities with the Largest Aleut Community in the United States
| City | Aleut | vs State | vs National | |
| 1. | Anchorage | 5,337 | 12,836(41.58%)#1 | 21,486(24.84%)#1 |
| 2. | Mill Bay | 658 | 12,836(5.13%)#2 | 21,486(3.06%)#2 |
| 3. | King Cove | 584 | 12,836(4.55%)#3 | 21,486(2.72%)#3 |
| 4. | Sand Point | 458 | 12,836(3.57%)#4 | 21,486(2.13%)#4 |
| 5. | Knik Fairview | 439 | 12,836(3.42%)#5 | 21,486(2.04%)#5 |
| 6. | St Paul | 276 | 12,836(2.15%)#6 | 21,486(1.28%)#6 |
| 7. | Bella Vista | 256 | 260(98.46%)#1 | 21,486(1.19%)#7 |
| 8. | Womens Bay | 192 | 12,836(1.50%)#7 | 21,486(0.89%)#8 |
| 9. | Kodiak | 191 | 12,836(1.49%)#8 | 21,486(0.89%)#9 |
| 10. | Tanaina | 185 | 12,836(1.44%)#9 | 21,486(0.86%)#10 |
| 11. | Chandler | 170 | 396(42.93%)#1 | 21,486(0.79%)#11 |
| 12. | Wasilla | 170 | 12,836(1.32%)#10 | 21,486(0.79%)#12 |
| 13. | Homer | 147 | 12,836(1.15%)#11 | 21,486(0.68%)#13 |
| 14. | Eureka | 143 | 1,036(13.80%)#1 | 21,486(0.67%)#14 |
| 15. | Nanwalek | 138 | 12,836(1.08%)#12 | 21,486(0.64%)#15 |
| 16. | Tacoma | 134 | 3,039(4.41%)#1 | 21,486(0.62%)#16 |
| 17. | Cherry Valley | 129 | 1,036(12.45%)#2 | 21,486(0.60%)#17 |
| 18. | Milwaukee | 126 | 203(62.07%)#1 | 21,486(0.59%)#18 |
| 19. | Juneau City And Borough | 126 | 12,836(0.98%)#13 | 21,486(0.59%)#19 |
| 20. | Des Moines | 124 | 3,039(4.08%)#2 | 21,486(0.58%)#20 |
| 21. | Nikiski | 119 | 12,836(0.93%)#14 | 21,486(0.55%)#21 |
| 22. | Port Graham | 119 | 12,836(0.93%)#15 | 21,486(0.55%)#22 |
| 23. | Marysville | 117 | 3,039(3.85%)#3 | 21,486(0.54%)#23 |
| 24. | Cordova | 116 | 12,836(0.90%)#16 | 21,486(0.54%)#24 |
| 25. | Valdez | 114 | 12,836(0.89%)#17 | 21,486(0.53%)#25 |
| 26. | Sun Valley | 113 | 195(57.95%)#1 | 21,486(0.53%)#26 |
| 27. | Unalaska | 105 | 12,836(0.82%)#18 | 21,486(0.49%)#27 |
| 28. | Ridgeway | 97 | 12,836(0.76%)#19 | 21,486(0.45%)#28 |
| 29. | Old Harbor | 97 | 12,836(0.76%)#20 | 21,486(0.45%)#29 |
| 30. | Kingston | 96 | 3,039(3.16%)#4 | 21,486(0.45%)#30 |
| 31. | Akutan | 95 | 12,836(0.74%)#21 | 21,486(0.44%)#31 |
| 32. | Ketchikan | 94 | 12,836(0.73%)#22 | 21,486(0.44%)#32 |
| 33. | Fort Worth | 93 | 401(23.19%)#1 | 21,486(0.43%)#33 |
| 34. | Naknek | 88 | 12,836(0.69%)#23 | 21,486(0.41%)#34 |
| 35. | Susitna North | 87 | 12,836(0.68%)#24 | 21,486(0.40%)#35 |
| 36. | Lakewood | 85 | 3,039(2.80%)#5 | 21,486(0.40%)#36 |
| 37. | Town And Country | 85 | 3,039(2.80%)#6 | 21,486(0.40%)#37 |
| 38. | Fishhook | 85 | 12,836(0.66%)#25 | 21,486(0.40%)#38 |
| 39. | Eugene | 84 | 463(18.14%)#1 | 21,486(0.39%)#39 |
| 40. | Summit View | 83 | 3,039(2.73%)#7 | 21,486(0.39%)#40 |
| 41. | Wrangell City And Borough | 80 | 12,836(0.62%)#26 | 21,486(0.37%)#41 |
| 42. | Kokhanok | 79 | 12,836(0.62%)#27 | 21,486(0.37%)#42 |
| 43. | Seattle | 78 | 3,039(2.57%)#8 | 21,486(0.36%)#43 |
| 44. | North Lakes | 78 | 12,836(0.61%)#28 | 21,486(0.36%)#44 |
| 45. | Palmer | 77 | 12,836(0.60%)#29 | 21,486(0.36%)#45 |
| 46. | Portland | 76 | 463(16.41%)#2 | 21,486(0.35%)#46 |
| 47. | Monroe | 75 | 3,039(2.47%)#9 | 21,486(0.35%)#47 |
| 48. | Helena Valley Southeast | 75 | 239(31.38%)#1 | 21,486(0.35%)#48 |
| 49. | Parkland | 74 | 3,039(2.44%)#10 | 21,486(0.34%)#49 |
| 50. | King Salmon | 74 | 12,836(0.58%)#30 | 21,486(0.34%)#50 |
| 51. | Soldotna | 72 | 12,836(0.56%)#31 | 21,486(0.34%)#51 |
| 52. | False Pass | 72 | 12,836(0.56%)#32 | 21,486(0.34%)#52 |
| 53. | Perryville | 69 | 12,836(0.54%)#33 | 21,486(0.32%)#53 |
| 54. | Ouzinkie | 68 | 12,836(0.53%)#34 | 21,486(0.32%)#54 |
| 55. | Cleveland | 66 | 165(40.00%)#1 | 21,486(0.31%)#55 |
| 56. | Gilbert | 64 | 396(16.16%)#2 | 21,486(0.30%)#56 |
| 57. | Arlington Heights | 63 | 3,039(2.07%)#11 | 21,486(0.29%)#57 |
| 58. | Petersburg | 62 | 12,836(0.48%)#35 | 21,486(0.29%)#58 |
| 59. | Sitka City And Borough | 61 | 12,836(0.48%)#36 | 21,486(0.28%)#59 |
| 60. | Steele Creek | 61 | 12,836(0.48%)#37 | 21,486(0.28%)#60 |
| 61. | Ninilchik | 61 | 12,836(0.48%)#38 | 21,486(0.28%)#61 |
| 62. | Akhiok | 61 | 12,836(0.48%)#39 | 21,486(0.28%)#62 |
| 63. | Igiugig | 60 | 12,836(0.47%)#40 | 21,486(0.28%)#63 |
| 64. | Bellevue | 58 | 3,039(1.91%)#12 | 21,486(0.27%)#64 |
| 65. | Pilot Point | 58 | 12,836(0.45%)#41 | 21,486(0.27%)#65 |
| 66. | East Falmouth | 57 | 90(63.33%)#1 | 21,486(0.27%)#66 |
| 67. | Shelton | 56 | 3,039(1.84%)#13 | 21,486(0.26%)#67 |
| 68. | Vancouver | 55 | 3,039(1.81%)#14 | 21,486(0.26%)#68 |
| 69. | Anaheim | 54 | 1,036(5.21%)#3 | 21,486(0.25%)#69 |
| 70. | South Hill | 54 | 3,039(1.78%)#15 | 21,486(0.25%)#70 |
| 71. | Port Lions | 54 | 12,836(0.42%)#42 | 21,486(0.25%)#71 |
| 72. | Nelson Lagoon | 54 | 12,836(0.42%)#43 | 21,486(0.25%)#72 |
| 73. | Ontario | 52 | 1,036(5.02%)#4 | 21,486(0.24%)#73 |
| 74. | St George | 52 | 12,836(0.41%)#44 | 21,486(0.24%)#74 |
| 75. | College | 51 | 12,836(0.40%)#45 | 21,486(0.24%)#75 |
| 76. | Raleigh | 49 | 91(53.85%)#1 | 21,486(0.23%)#76 |
| 77. | Wheat Ridge | 48 | 205(23.41%)#1 | 21,486(0.22%)#77 |
| 78. | Urban Honolulu | 47 | 53(88.68%)#1 | 21,486(0.22%)#78 |
| 79. | Peoria | 47 | 396(11.87%)#3 | 21,486(0.22%)#79 |
| 80. | Everett | 47 | 3,039(1.55%)#16 | 21,486(0.22%)#80 |
| 81. | Bellingham | 47 | 3,039(1.55%)#17 | 21,486(0.22%)#81 |
| 82. | Tumwater | 47 | 3,039(1.55%)#18 | 21,486(0.22%)#82 |
| 83. | Big Lake | 47 | 12,836(0.37%)#46 | 21,486(0.22%)#83 |
| 84. | Spanaway | 46 | 3,039(1.51%)#19 | 21,486(0.21%)#84 |
| 85. | Point Mackenzie | 46 | 12,836(0.36%)#47 | 21,486(0.21%)#85 |
| 86. | Olympia | 45 | 3,039(1.48%)#20 | 21,486(0.21%)#86 |
| 87. | Bothell West | 45 | 3,039(1.48%)#21 | 21,486(0.21%)#87 |
| 88. | Port Heiden | 45 | 12,836(0.35%)#48 | 21,486(0.21%)#88 |
| 89. | Fairbanks | 44 | 12,836(0.34%)#49 | 21,486(0.20%)#89 |
| 90. | Chenega | 41 | 12,836(0.32%)#50 | 21,486(0.19%)#90 |
| 91. | Frederickson | 40 | 3,039(1.32%)#22 | 21,486(0.19%)#91 |
| 92. | Hayden | 39 | 86(45.35%)#1 | 21,486(0.18%)#92 |
| 93. | Livermore | 38 | 1,036(3.67%)#5 | 21,486(0.18%)#93 |
| 94. | Auburn | 38 | 3,039(1.25%)#23 | 21,486(0.18%)#94 |
| 95. | Spring Hill | 38 | 165(23.03%)#2 | 21,486(0.18%)#95 |
| 96. | Edmonds | 38 | 3,039(1.25%)#24 | 21,486(0.18%)#96 |
| 97. | Adak | 38 | 12,836(0.30%)#51 | 21,486(0.18%)#97 |
| 98. | Pueblo | 37 | 205(18.05%)#2 | 21,486(0.17%)#98 |
| 99. | Kirkland | 37 | 3,039(1.22%)#25 | 21,486(0.17%)#99 |
| 100. | Bremerton | 37 | 3,039(1.22%)#26 | 21,486(0.17%)#100 |
Common Questions
What are the Top 10 Cities with the Largest Aleut Community in the United States?
Top 10 Cities with the Largest Aleut Community in the United States are:
#1
5,337
#2
584
#3
458
#4
439
#5
276
#6
256
#7
192
#8
191
#9
185
#10
170
What city has the Largest Aleut Community in the United States?
Anchorage has the Largest Aleut Community in the United States with 5,337.
What is the Total Aleut Population in the United States?
Total Aleut Population in the United States is 21,486.