Marlboro Village, MD Map & Demographics
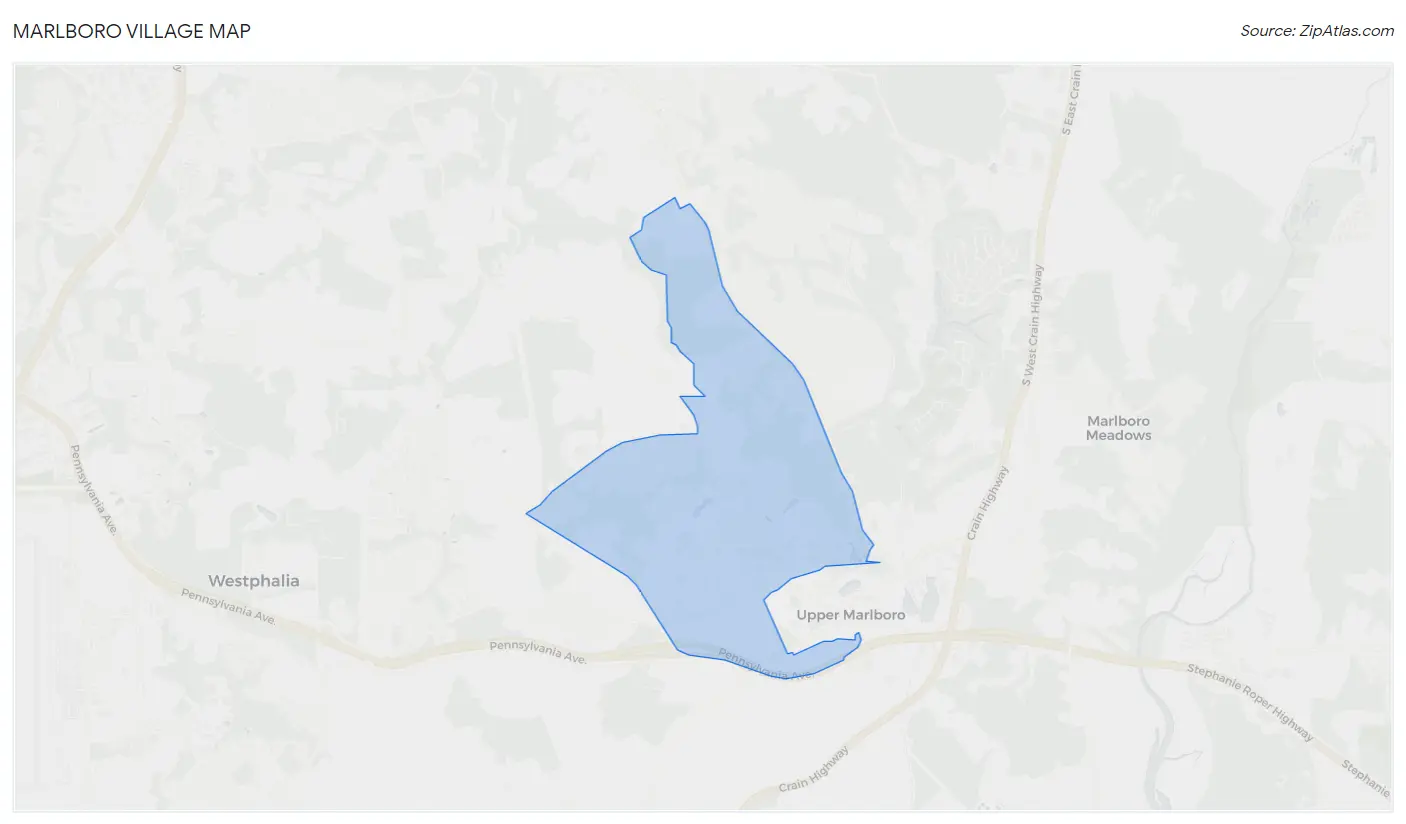
Marlboro Village Map
Marlboro Village Overview
$53,112
PER CAPITA INCOME
$146,875
AVG FAMILY INCOME
$117,700
AVG HOUSEHOLD INCOME
31.9%
WAGE / INCOME GAP [ % ]
68.1¢/ $1
WAGE / INCOME GAP [ $ ]
0.30
INEQUALITY / GINI INDEX
9,124
TOTAL POPULATION
4,637
MALE POPULATION
4,487
FEMALE POPULATION
103.34
MALES / 100 FEMALES
96.77
FEMALES / 100 MALES
37.6
MEDIAN AGE
3.1
AVG FAMILY SIZE
2.3
AVG HOUSEHOLD SIZE
5,402
LABOR FORCE [ PEOPLE ]
69.2%
PERCENT IN LABOR FORCE
5.5%
UNEMPLOYMENT RATE
Income in Marlboro Village
Income Overview in Marlboro Village
Per Capita Income in Marlboro Village is $53,112, while median incomes of families and households are $146,875 and $117,700 respectively.
| Characteristic | Number | Measure |
| Per Capita Income | 9,124 | $53,112 |
| Median Family Income | 2,081 | $146,875 |
| Mean Family Income | 2,081 | $158,955 |
| Median Household Income | 3,587 | $117,700 |
| Mean Household Income | 3,587 | $130,630 |
| Income Deficit | 2,081 | $0 |
| Wage / Income Gap (%) | 9,124 | 31.92% |
| Wage / Income Gap ($) | 9,124 | 68.08¢ per $1 |
| Gini / Inequality Index | 9,124 | 0.30 |
Earnings by Sex in Marlboro Village
Average Earnings in Marlboro Village are $69,072, $55,475 for men and $81,487 for women, a difference of 31.9%.
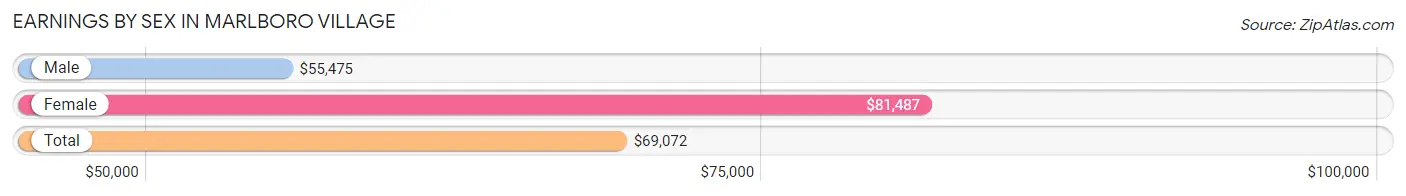
| Sex | Number | Average Earnings |
| Male | 2,946 (51.4%) | $55,475 |
| Female | 2,785 (48.6%) | $81,487 |
| Total | 5,731 (100.0%) | $69,072 |
Earnings by Sex by Income Bracket in Marlboro Village
The most common earnings brackets in Marlboro Village are $100,000+ for men (721 | 24.5%) and $100,000+ for women (945 | 33.9%).
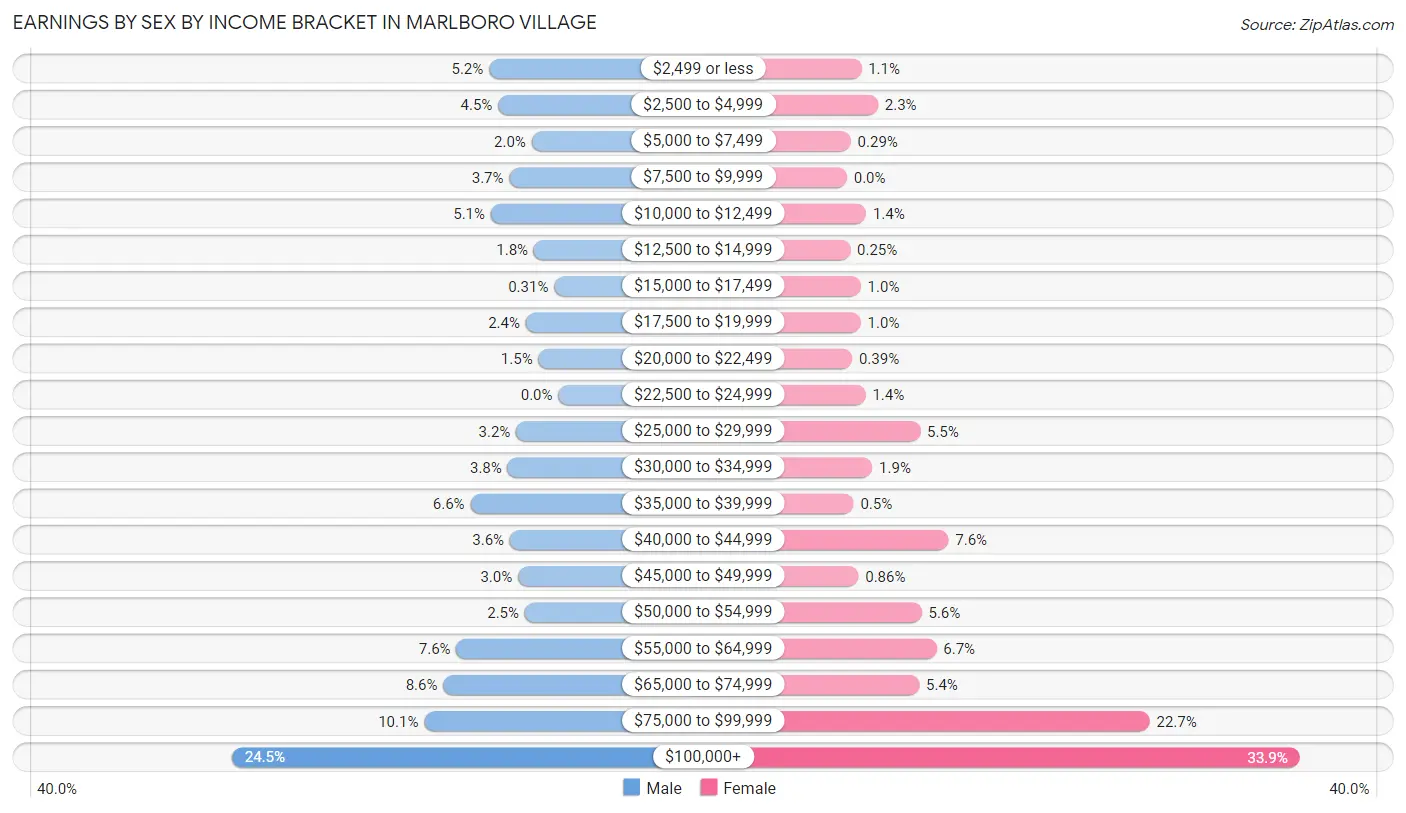
| Income | Male | Female |
| $2,499 or less | 153 (5.2%) | 30 (1.1%) |
| $2,500 to $4,999 | 133 (4.5%) | 65 (2.3%) |
| $5,000 to $7,499 | 59 (2.0%) | 8 (0.3%) |
| $7,500 to $9,999 | 108 (3.7%) | 0 (0.0%) |
| $10,000 to $12,499 | 149 (5.1%) | 40 (1.4%) |
| $12,500 to $14,999 | 54 (1.8%) | 7 (0.3%) |
| $15,000 to $17,499 | 9 (0.3%) | 29 (1.0%) |
| $17,500 to $19,999 | 72 (2.4%) | 29 (1.0%) |
| $20,000 to $22,499 | 44 (1.5%) | 11 (0.4%) |
| $22,500 to $24,999 | 0 (0.0%) | 39 (1.4%) |
| $25,000 to $29,999 | 93 (3.2%) | 153 (5.5%) |
| $30,000 to $34,999 | 112 (3.8%) | 53 (1.9%) |
| $35,000 to $39,999 | 194 (6.6%) | 14 (0.5%) |
| $40,000 to $44,999 | 107 (3.6%) | 212 (7.6%) |
| $45,000 to $49,999 | 89 (3.0%) | 24 (0.9%) |
| $50,000 to $54,999 | 74 (2.5%) | 156 (5.6%) |
| $55,000 to $64,999 | 225 (7.6%) | 187 (6.7%) |
| $65,000 to $74,999 | 254 (8.6%) | 151 (5.4%) |
| $75,000 to $99,999 | 296 (10.1%) | 632 (22.7%) |
| $100,000+ | 721 (24.5%) | 945 (33.9%) |
| Total | 2,946 (100.0%) | 2,785 (100.0%) |
Earnings by Sex by Educational Attainment in Marlboro Village
Average earnings in Marlboro Village are $65,183 for men and $84,366 for women, a difference of 22.7%. Men with an educational attainment of graduate degree enjoy the highest average annual earnings of $105,868, while those with less than high school education earn the least with $37,375. Women with an educational attainment of graduate degree earn the most with the average annual earnings of $119,034, while those with high school diploma education have the smallest earnings of $40,170.
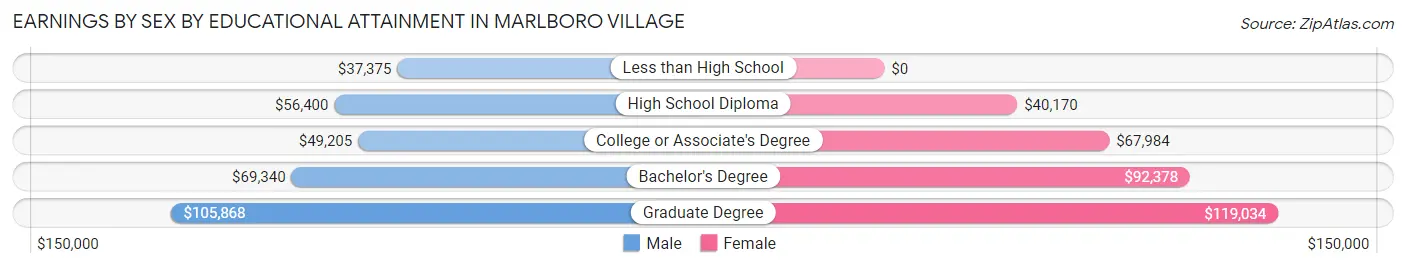
| Educational Attainment | Male Income | Female Income |
| Less than High School | $37,375 | $0 |
| High School Diploma | $56,400 | $40,170 |
| College or Associate's Degree | $49,205 | $67,984 |
| Bachelor's Degree | $69,340 | $92,378 |
| Graduate Degree | $105,868 | $119,034 |
| Total | $65,183 | $84,366 |
Family Income in Marlboro Village
Family Income Brackets in Marlboro Village
According to the Marlboro Village family income data, there are 760 families falling into the $100,000 to $149,999 income range, which is the most common income bracket and makes up 36.5% of all families.
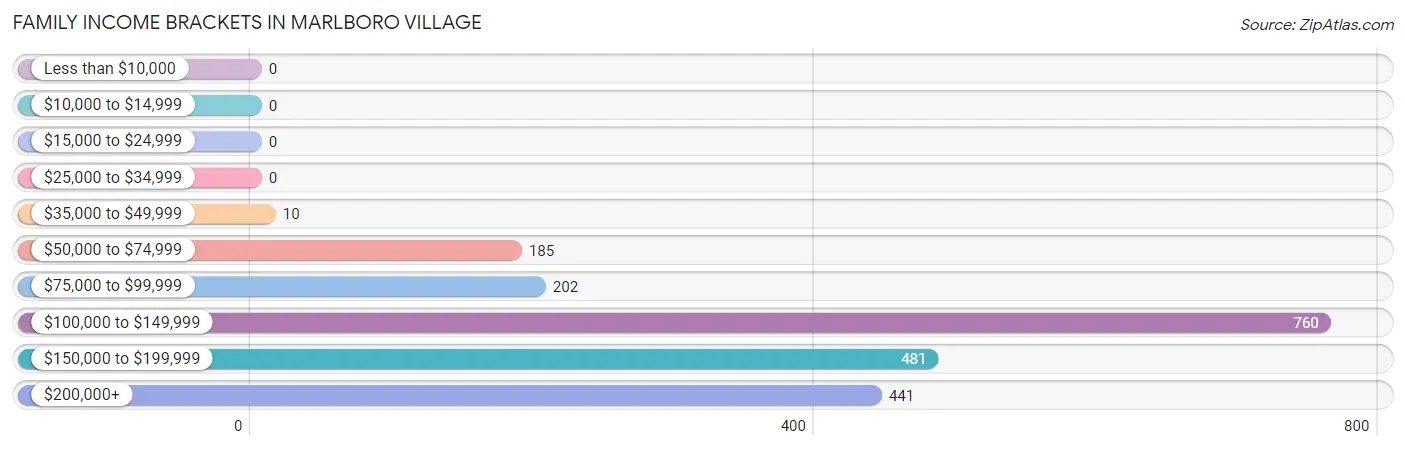
| Income Bracket | # Families | % Families |
| Less than $10,000 | 0 | 0.0% |
| $10,000 to $14,999 | 0 | 0.0% |
| $15,000 to $24,999 | 0 | 0.0% |
| $25,000 to $34,999 | 0 | 0.0% |
| $35,000 to $49,999 | 10 | 0.5% |
| $50,000 to $74,999 | 185 | 8.9% |
| $75,000 to $99,999 | 202 | 9.7% |
| $100,000 to $149,999 | 760 | 36.5% |
| $150,000 to $199,999 | 481 | 23.1% |
| $200,000+ | 441 | 21.2% |
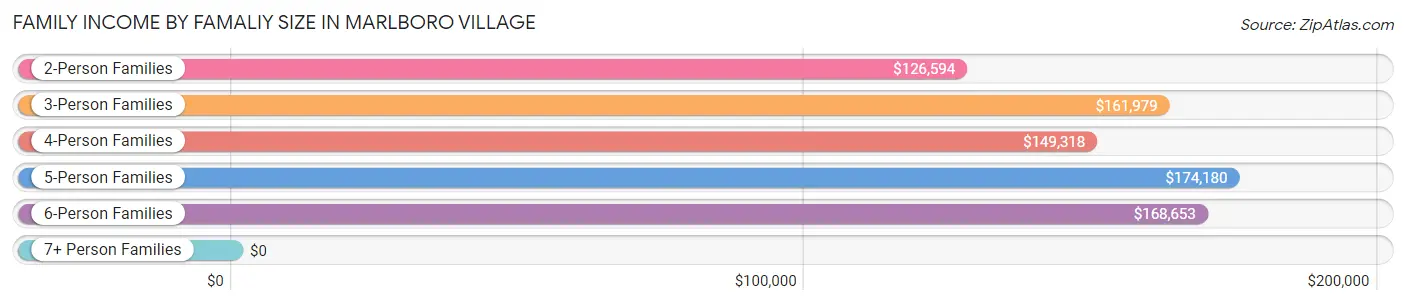
Family Income by Famaliy Size in Marlboro Village
5-person families (197 | 9.5%) account for the highest median family income in Marlboro Village with $174,180 per family, while 2-person families (1,091 | 52.4%) have the highest median income of $63,297 per family member.
| Income Bracket | # Families | Median Income |
| 2-Person Families | 1,091 (52.4%) | $126,594 |
| 3-Person Families | 335 (16.1%) | $161,979 |
| 4-Person Families | 362 (17.4%) | $149,318 |
| 5-Person Families | 197 (9.5%) | $174,180 |
| 6-Person Families | 83 (4.0%) | $168,653 |
| 7+ Person Families | 13 (0.6%) | $0 |
| Total | 2,081 (100.0%) | $146,875 |
Family Income by Number of Earners in Marlboro Village
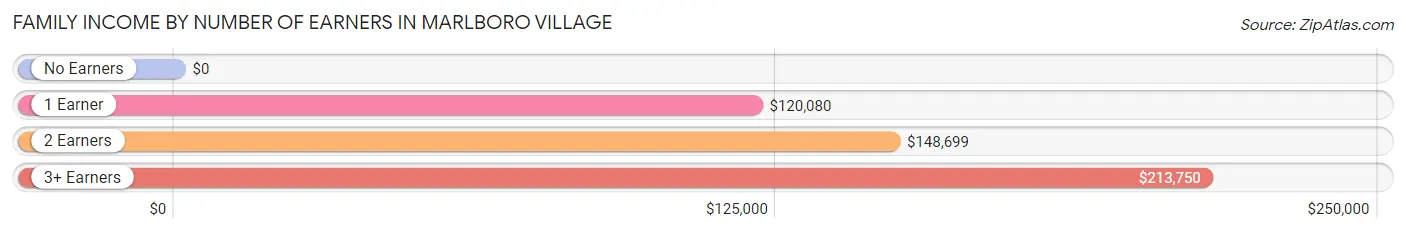
| Number of Earners | # Families | Median Income |
| No Earners | 113 (5.4%) | $0 |
| 1 Earner | 615 (29.5%) | $120,080 |
| 2 Earners | 1,067 (51.3%) | $148,699 |
| 3+ Earners | 286 (13.7%) | $213,750 |
| Total | 2,081 (100.0%) | $146,875 |
Household Income in Marlboro Village
Household Income Brackets in Marlboro Village
With 1,234 households falling in the category, the $100,000 to $149,999 income range is the most frequent in Marlboro Village, accounting for 34.4% of all households.
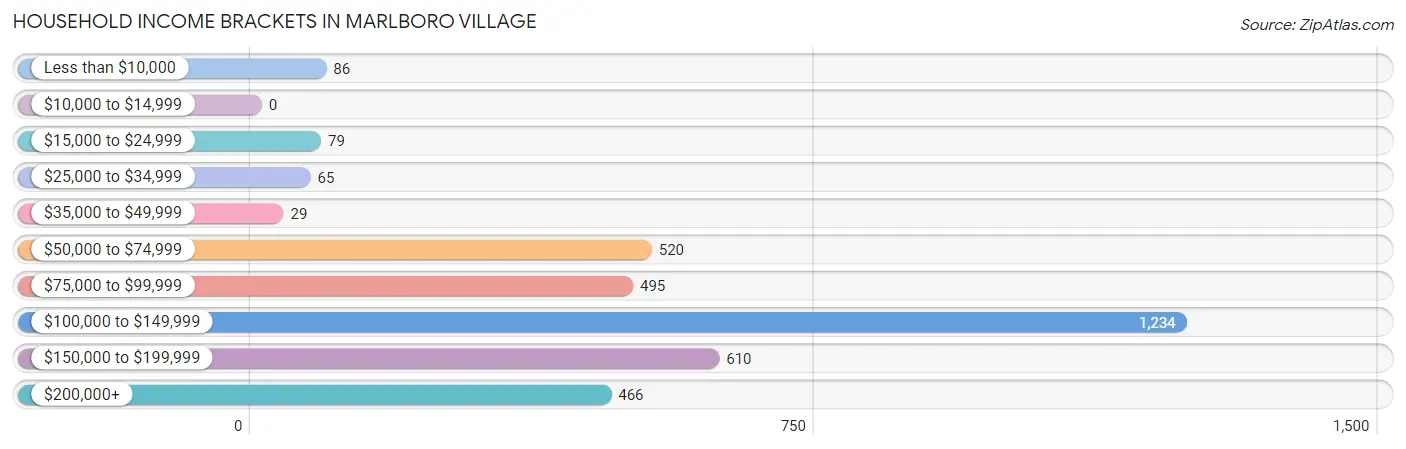
| Income Bracket | # Households | % Households |
| Less than $10,000 | 86 | 2.4% |
| $10,000 to $14,999 | 0 | 0.0% |
| $15,000 to $24,999 | 79 | 2.2% |
| $25,000 to $34,999 | 65 | 1.8% |
| $35,000 to $49,999 | 29 | 0.8% |
| $50,000 to $74,999 | 520 | 14.5% |
| $75,000 to $99,999 | 495 | 13.8% |
| $100,000 to $149,999 | 1,234 | 34.4% |
| $150,000 to $199,999 | 610 | 17.0% |
| $200,000+ | 466 | 13.0% |
Household Income by Householder Age in Marlboro Village
The median household income in Marlboro Village is $117,700, with the highest median household income of $140,429 found in the 45 to 64 years age bracket for the primary householder. A total of 1,562 households (43.5%) fall into this category. Meanwhile, the 15 to 24 years age bracket for the primary householder has the lowest median household income of $0, with 19 households (0.5%) in this group.
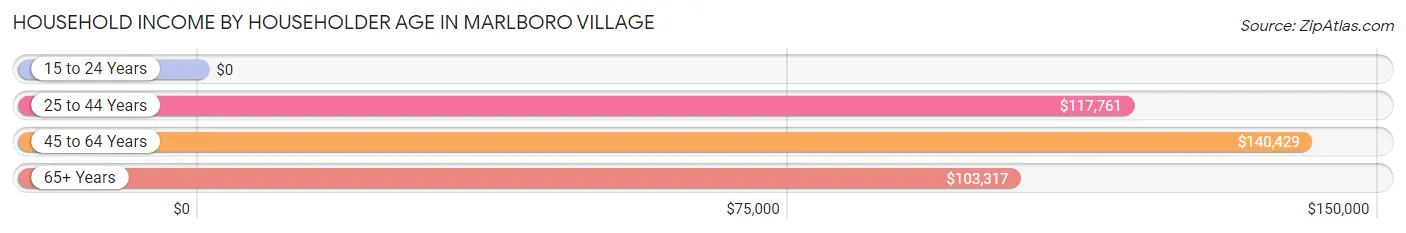
| Income Bracket | # Households | Median Income |
| 15 to 24 Years | 19 (0.5%) | $0 |
| 25 to 44 Years | 1,384 (38.6%) | $117,761 |
| 45 to 64 Years | 1,562 (43.5%) | $140,429 |
| 65+ Years | 622 (17.3%) | $103,317 |
| Total | 3,587 (100.0%) | $117,700 |
Poverty in Marlboro Village
Income Below Poverty by Sex and Age in Marlboro Village
With 2.4% poverty level for males and 1.7% for females among the residents of Marlboro Village, 16 and 17 year old males and 45 to 54 year old females are the most vulnerable to poverty, with 29 males (16.5%) and 31 females (3.4%) in their respective age groups living below the poverty level.
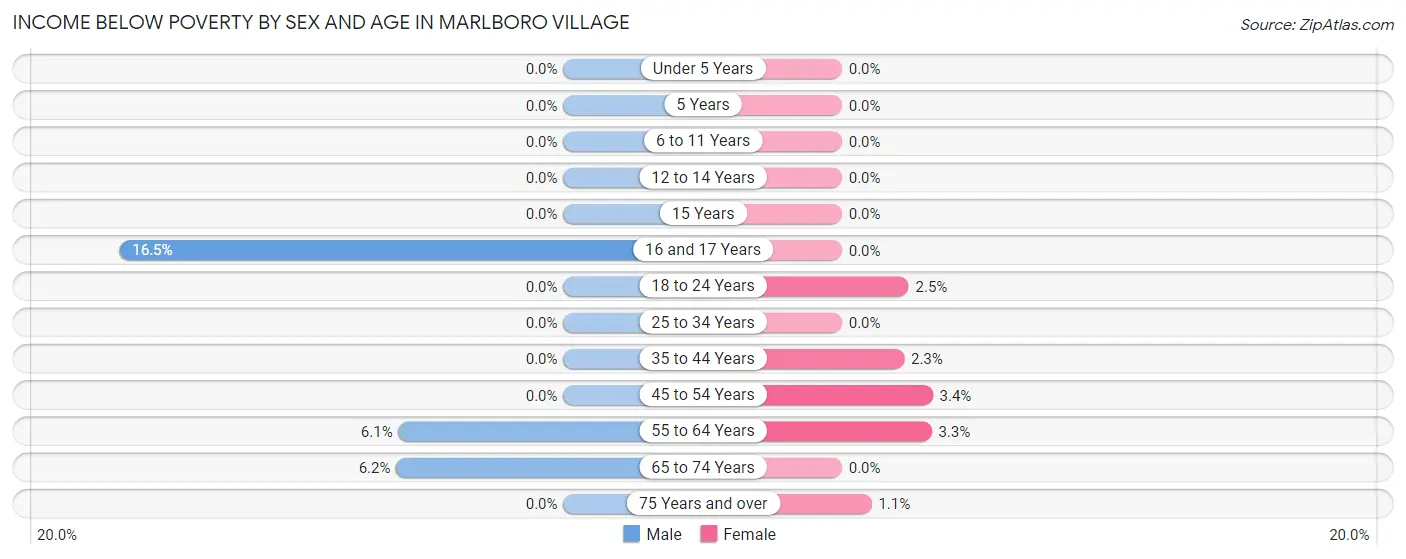
| Age Bracket | Male | Female |
| Under 5 Years | 0 (0.0%) | 0 (0.0%) |
| 5 Years | 0 (0.0%) | 0 (0.0%) |
| 6 to 11 Years | 0 (0.0%) | 0 (0.0%) |
| 12 to 14 Years | 0 (0.0%) | 0 (0.0%) |
| 15 Years | 0 (0.0%) | 0 (0.0%) |
| 16 and 17 Years | 29 (16.5%) | 0 (0.0%) |
| 18 to 24 Years | 0 (0.0%) | 8 (2.5%) |
| 25 to 34 Years | 0 (0.0%) | 0 (0.0%) |
| 35 to 44 Years | 0 (0.0%) | 14 (2.3%) |
| 45 to 54 Years | 0 (0.0%) | 31 (3.4%) |
| 55 to 64 Years | 30 (6.1%) | 21 (3.3%) |
| 65 to 74 Years | 34 (6.2%) | 0 (0.0%) |
| 75 Years and over | 0 (0.0%) | 1 (1.1%) |
| Total | 93 (2.4%) | 75 (1.7%) |
Income Above Poverty by Sex and Age in Marlboro Village
According to the poverty statistics in Marlboro Village, males aged under 5 years and females aged under 5 years are the age groups that are most secure financially, with 100.0% of males and 100.0% of females in these age groups living above the poverty line.
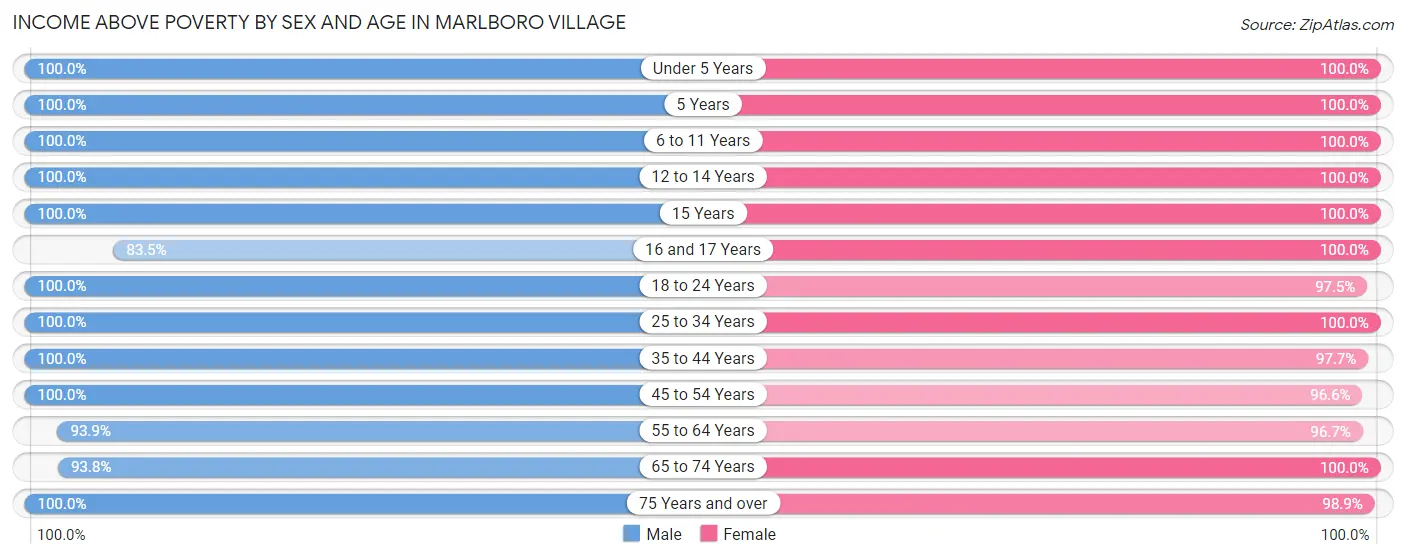
| Age Bracket | Male | Female |
| Under 5 Years | 33 (100.0%) | 336 (100.0%) |
| 5 Years | 7 (100.0%) | 57 (100.0%) |
| 6 to 11 Years | 289 (100.0%) | 326 (100.0%) |
| 12 to 14 Years | 77 (100.0%) | 73 (100.0%) |
| 15 Years | 31 (100.0%) | 89 (100.0%) |
| 16 and 17 Years | 147 (83.5%) | 90 (100.0%) |
| 18 to 24 Years | 331 (100.0%) | 315 (97.5%) |
| 25 to 34 Years | 714 (100.0%) | 579 (100.0%) |
| 35 to 44 Years | 503 (100.0%) | 593 (97.7%) |
| 45 to 54 Years | 591 (100.0%) | 888 (96.6%) |
| 55 to 64 Years | 460 (93.9%) | 610 (96.7%) |
| 65 to 74 Years | 514 (93.8%) | 337 (100.0%) |
| 75 Years and over | 116 (100.0%) | 90 (98.9%) |
| Total | 3,813 (97.6%) | 4,383 (98.3%) |
Income Below Poverty Among Married-Couple Families in Marlboro Village
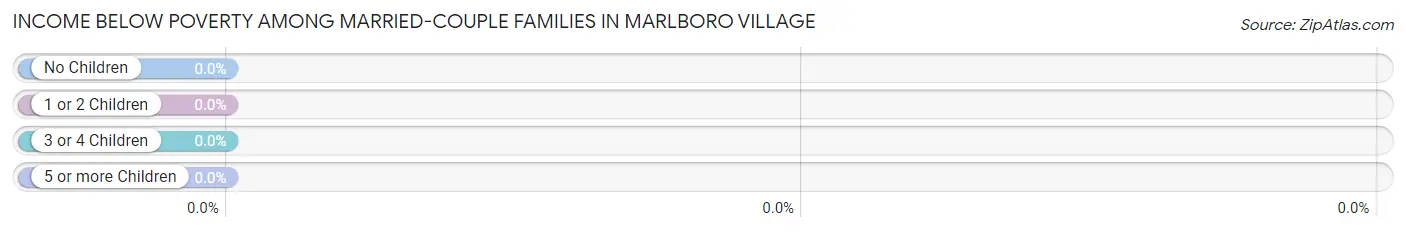
| Children | Above Poverty | Below Poverty |
| No Children | 673 (100.0%) | 0 (0.0%) |
| 1 or 2 Children | 416 (100.0%) | 0 (0.0%) |
| 3 or 4 Children | 107 (100.0%) | 0 (0.0%) |
| 5 or more Children | 13 (100.0%) | 0 (0.0%) |
| Total | 1,209 (100.0%) | 0 (0.0%) |
Income Below Poverty Among Single-Parent Households in Marlboro Village
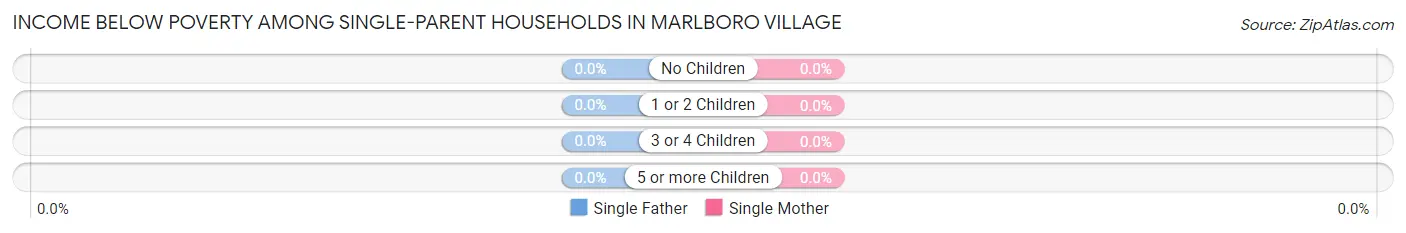
| Children | Single Father | Single Mother |
| No Children | 0 (0.0%) | 0 (0.0%) |
| 1 or 2 Children | 0 (0.0%) | 0 (0.0%) |
| 3 or 4 Children | 0 (0.0%) | 0 (0.0%) |
| 5 or more Children | 0 (0.0%) | 0 (0.0%) |
| Total | 0 (0.0%) | 0 (0.0%) |
Income Below Poverty Among Married-Couple vs Single-Parent Households in Marlboro Village
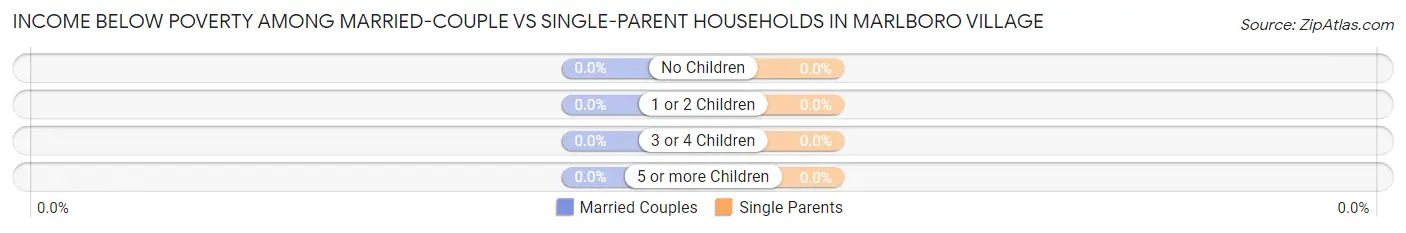
| Children | Married-Couple Families | Single-Parent Households |
| No Children | 0 (0.0%) | 0 (0.0%) |
| 1 or 2 Children | 0 (0.0%) | 0 (0.0%) |
| 3 or 4 Children | 0 (0.0%) | 0 (0.0%) |
| 5 or more Children | 0 (0.0%) | 0 (0.0%) |
| Total | 0 (0.0%) | 0 (0.0%) |
Race in Marlboro Village
The most populous races in Marlboro Village are Black / African American (7,569 | 83.0%), White / Caucasian (1,017 | 11.2%), and Hispanic or Latino (219 | 2.4%).
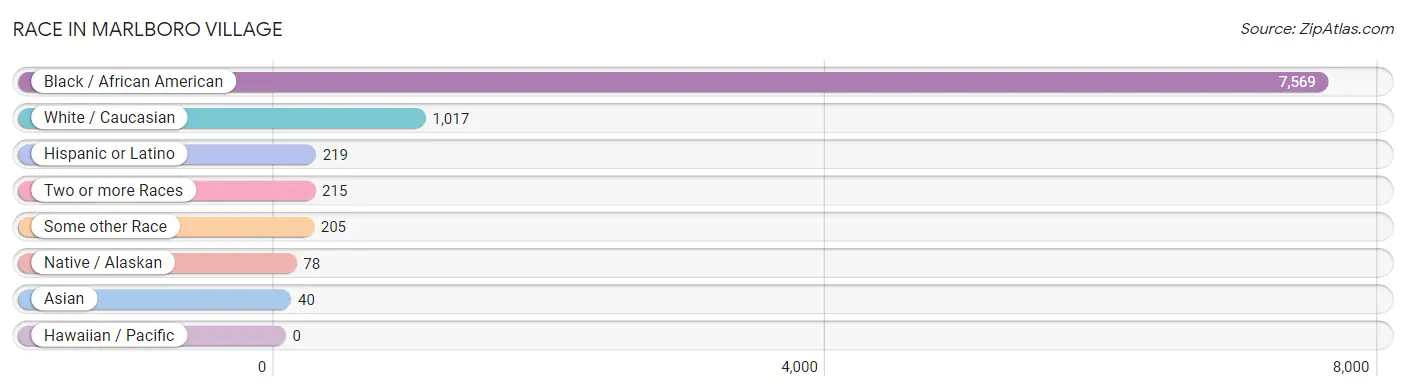
| Race | # Population | % Population |
| Asian | 40 | 0.4% |
| Black / African American | 7,569 | 83.0% |
| Hawaiian / Pacific | 0 | 0.0% |
| Hispanic or Latino | 219 | 2.4% |
| Native / Alaskan | 78 | 0.9% |
| White / Caucasian | 1,017 | 11.2% |
| Two or more Races | 215 | 2.4% |
| Some other Race | 205 | 2.2% |
| Total | 9,124 | 100.0% |
Ancestry in Marlboro Village
The most populous ancestries reported in Marlboro Village are Subsaharan African (935 | 10.2%), Nigerian (487 | 5.3%), African (311 | 3.4%), German (229 | 2.5%), and American (219 | 2.4%), together accounting for 23.9% of all Marlboro Village residents.
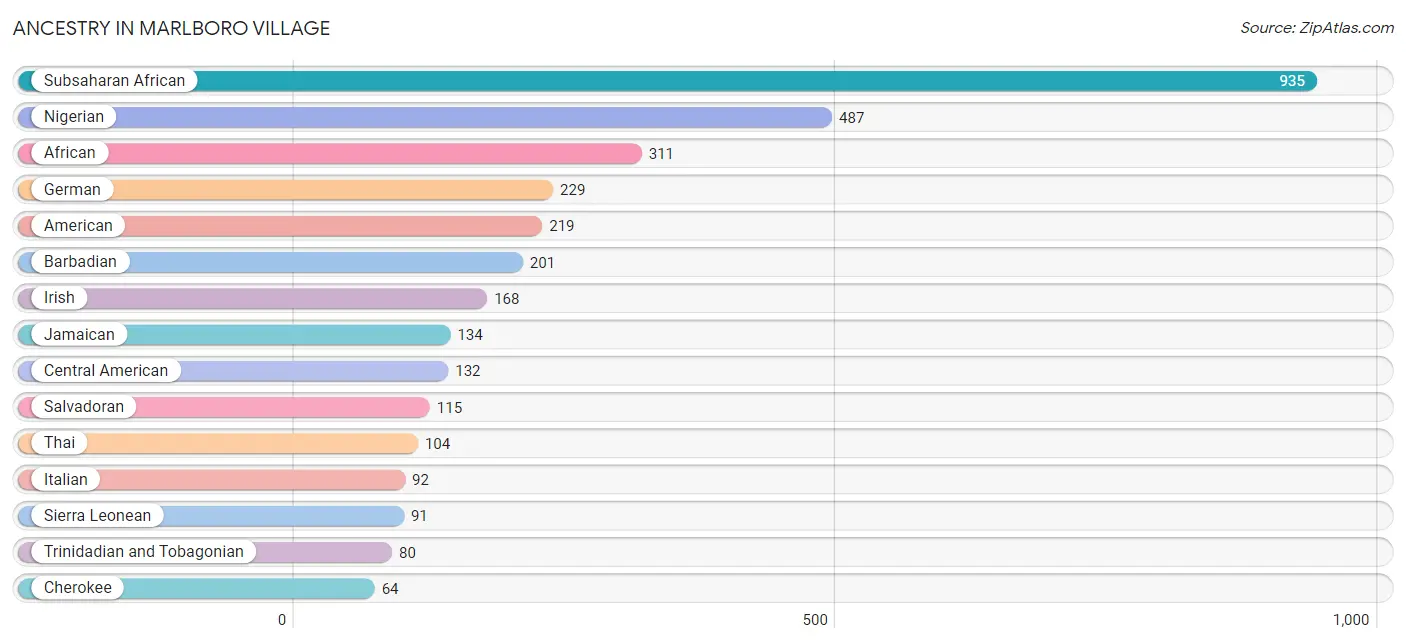
| Ancestry | # Population | % Population |
| African | 311 | 3.4% |
| American | 219 | 2.4% |
| Arab | 5 | 0.1% |
| Austrian | 25 | 0.3% |
| Barbadian | 201 | 2.2% |
| Belizean | 9 | 0.1% |
| British | 31 | 0.3% |
| Burmese | 13 | 0.1% |
| Central American | 132 | 1.5% |
| Central American Indian | 14 | 0.2% |
| Cherokee | 64 | 0.7% |
| Colombian | 7 | 0.1% |
| Danish | 14 | 0.2% |
| Dominican | 8 | 0.1% |
| English | 49 | 0.5% |
| French | 5 | 0.1% |
| German | 229 | 2.5% |
| Guatemalan | 8 | 0.1% |
| Haitian | 22 | 0.2% |
| Hungarian | 8 | 0.1% |
| Icelander | 19 | 0.2% |
| Irish | 168 | 1.8% |
| Italian | 92 | 1.0% |
| Jamaican | 134 | 1.5% |
| Kenyan | 36 | 0.4% |
| Lebanese | 5 | 0.1% |
| Mexican | 28 | 0.3% |
| Nigerian | 487 | 5.3% |
| Panamanian | 9 | 0.1% |
| Peruvian | 14 | 0.2% |
| Polish | 9 | 0.1% |
| Salvadoran | 115 | 1.3% |
| Scottish | 54 | 0.6% |
| Sierra Leonean | 91 | 1.0% |
| South American | 21 | 0.2% |
| Spanish | 20 | 0.2% |
| Subsaharan African | 935 | 10.2% |
| Swedish | 34 | 0.4% |
| Thai | 104 | 1.1% |
| Trinidadian and Tobagonian | 80 | 0.9% | View All 40 Rows |
Immigrants in Marlboro Village
The most numerous immigrant groups reported in Marlboro Village came from Africa (663 | 7.3%), Western Africa (611 | 6.7%), Nigeria (409 | 4.5%), Latin America (253 | 2.8%), and Sierra Leone (188 | 2.1%), together accounting for 23.3% of all Marlboro Village residents.
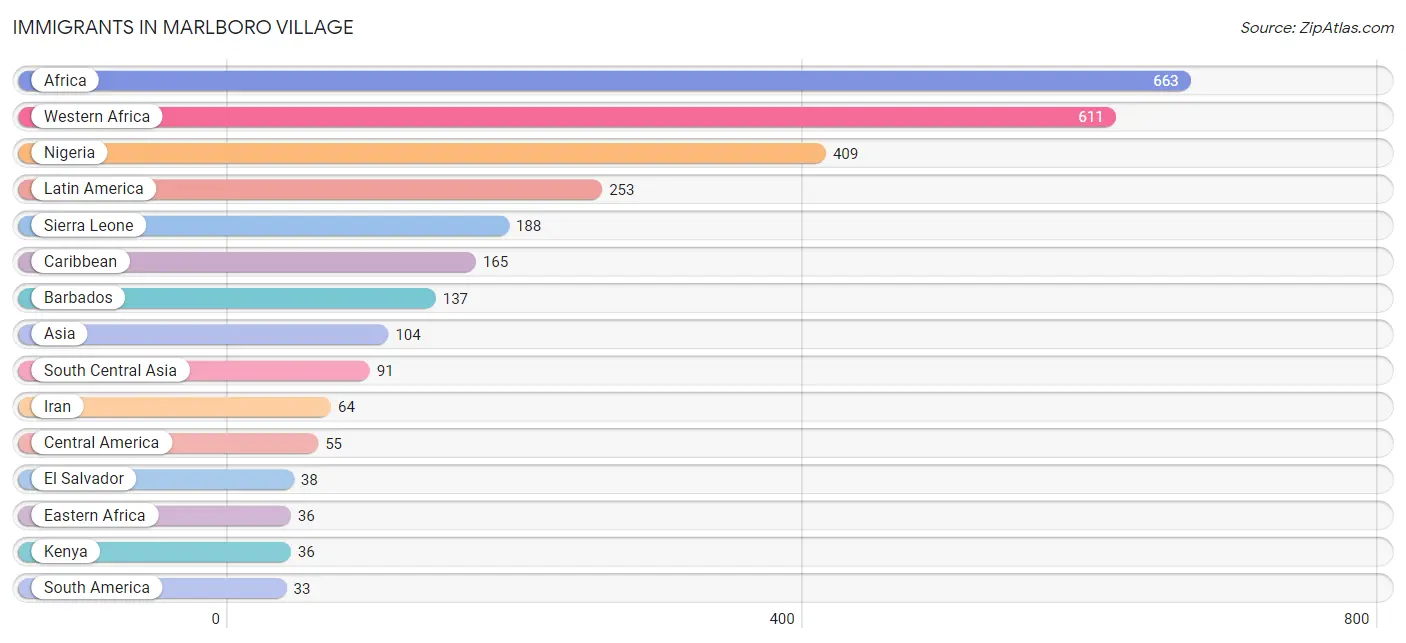
| Immigration Origin | # Population | % Population |
| Africa | 663 | 7.3% |
| Asia | 104 | 1.1% |
| Barbados | 137 | 1.5% |
| Belize | 9 | 0.1% |
| Cameroon | 16 | 0.2% |
| Caribbean | 165 | 1.8% |
| Central America | 55 | 0.6% |
| Colombia | 7 | 0.1% |
| Eastern Africa | 36 | 0.4% |
| Eastern Asia | 13 | 0.1% |
| El Salvador | 38 | 0.4% |
| England | 19 | 0.2% |
| Europe | 19 | 0.2% |
| Ghana | 13 | 0.1% |
| Guatemala | 8 | 0.1% |
| Guyana | 12 | 0.1% |
| India | 27 | 0.3% |
| Iran | 64 | 0.7% |
| Jamaica | 22 | 0.2% |
| Kenya | 36 | 0.4% |
| Korea | 13 | 0.1% |
| Latin America | 253 | 2.8% |
| Liberia | 1 | 0.0% |
| Middle Africa | 16 | 0.2% |
| Nigeria | 409 | 4.5% |
| Northern Europe | 19 | 0.2% |
| Peru | 14 | 0.2% |
| Sierra Leone | 188 | 2.1% |
| South America | 33 | 0.4% |
| South Central Asia | 91 | 1.0% |
| Trinidad and Tobago | 6 | 0.1% |
| Western Africa | 611 | 6.7% | View All 32 Rows |
Sex and Age in Marlboro Village
Sex and Age in Marlboro Village
The most populous age groups in Marlboro Village are 30 to 34 Years (504 | 10.9%) for men and 50 to 54 Years (506 | 11.3%) for women.
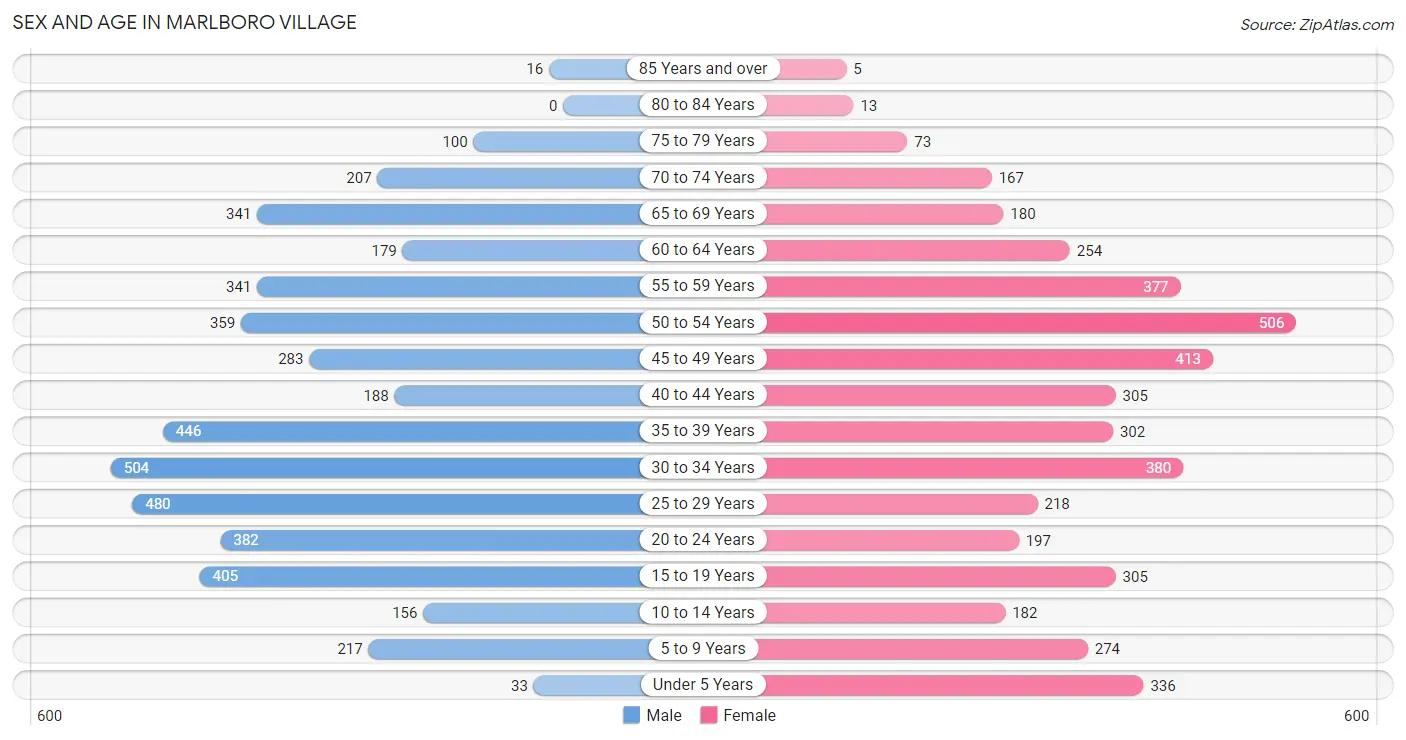
| Age Bracket | Male | Female |
| Under 5 Years | 33 (0.7%) | 336 (7.5%) |
| 5 to 9 Years | 217 (4.7%) | 274 (6.1%) |
| 10 to 14 Years | 156 (3.4%) | 182 (4.1%) |
| 15 to 19 Years | 405 (8.7%) | 305 (6.8%) |
| 20 to 24 Years | 382 (8.2%) | 197 (4.4%) |
| 25 to 29 Years | 480 (10.3%) | 218 (4.9%) |
| 30 to 34 Years | 504 (10.9%) | 380 (8.5%) |
| 35 to 39 Years | 446 (9.6%) | 302 (6.7%) |
| 40 to 44 Years | 188 (4.1%) | 305 (6.8%) |
| 45 to 49 Years | 283 (6.1%) | 413 (9.2%) |
| 50 to 54 Years | 359 (7.7%) | 506 (11.3%) |
| 55 to 59 Years | 341 (7.3%) | 377 (8.4%) |
| 60 to 64 Years | 179 (3.9%) | 254 (5.7%) |
| 65 to 69 Years | 341 (7.3%) | 180 (4.0%) |
| 70 to 74 Years | 207 (4.5%) | 167 (3.7%) |
| 75 to 79 Years | 100 (2.2%) | 73 (1.6%) |
| 80 to 84 Years | 0 (0.0%) | 13 (0.3%) |
| 85 Years and over | 16 (0.4%) | 5 (0.1%) |
| Total | 4,637 (100.0%) | 4,487 (100.0%) |
Families and Households in Marlboro Village
Median Family Size in Marlboro Village
The median family size in Marlboro Village is 3.08 persons per family, with married-couple families (1,209 | 58.1%) accounting for the largest median family size of 3.53 persons per family. On the other hand, single male/father families (201 | 9.7%) represent the smallest median family size with 2.26 persons per family.
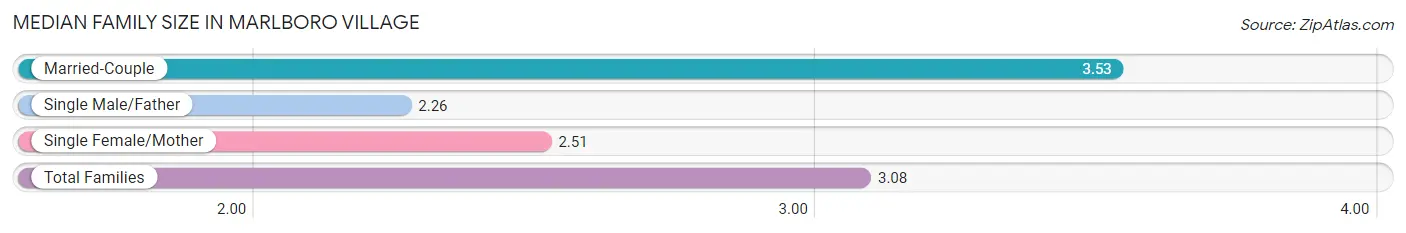
| Family Type | # Families | Family Size |
| Married-Couple | 1,209 (58.1%) | 3.53 |
| Single Male/Father | 201 (9.7%) | 2.26 |
| Single Female/Mother | 671 (32.2%) | 2.51 |
| Total Families | 2,081 (100.0%) | 3.08 |
Median Household Size in Marlboro Village
The median household size in Marlboro Village is 2.33 persons per household, with married-couple households (1,209 | 33.7%) accounting for the largest median household size of 3.58 persons per household. non-family households (1,506 | 42.0%) represent the smallest median household size with 1.21 persons per household.
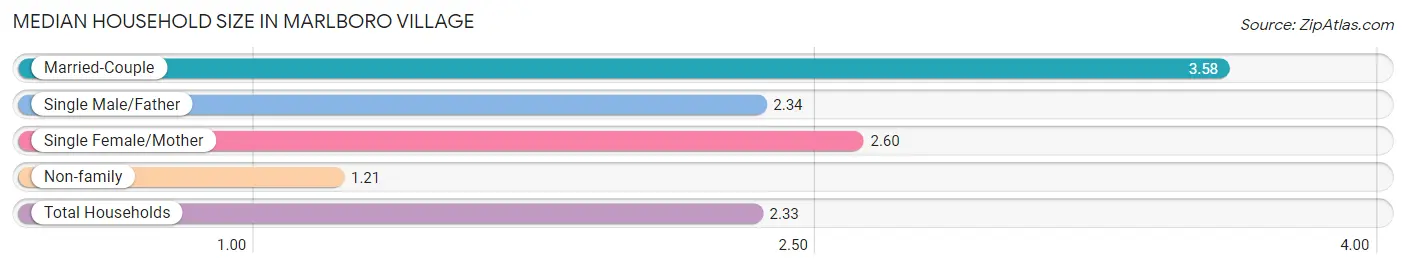
| Household Type | # Households | Household Size |
| Married-Couple | 1,209 (33.7%) | 3.58 |
| Single Male/Father | 201 (5.6%) | 2.34 |
| Single Female/Mother | 671 (18.7%) | 2.60 |
| Non-family | 1,506 (42.0%) | 1.21 |
| Total Households | 3,587 (100.0%) | 2.33 |
Household Size by Marriage Status in Marlboro Village
Out of a total of 3,587 households in Marlboro Village, 2,081 (58.0%) are family households, while 1,506 (42.0%) are nonfamily households. The most numerous type of family households are 2-person households, comprising 1,039, and the most common type of nonfamily households are 1-person households, comprising 1,259.
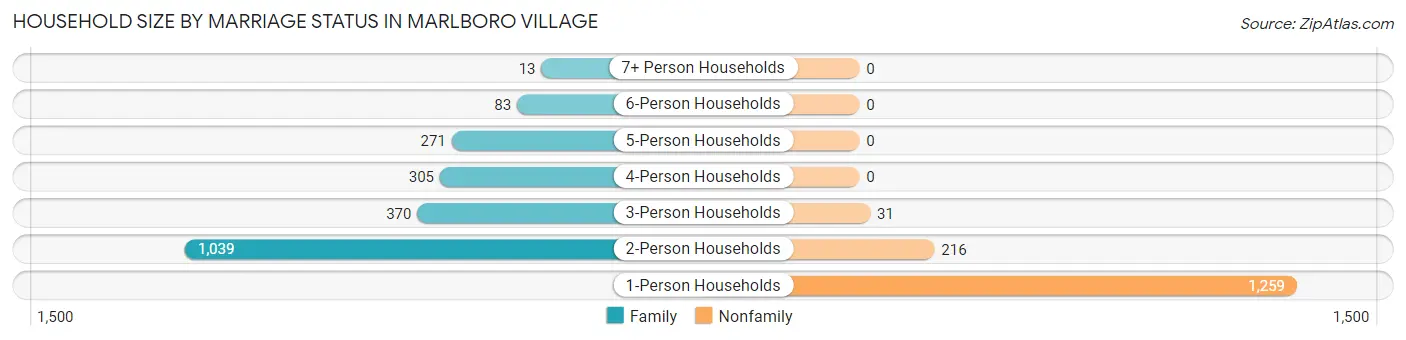
| Household Size | Family Households | Nonfamily Households |
| 1-Person Households | - | 1,259 (35.1%) |
| 2-Person Households | 1,039 (29.0%) | 216 (6.0%) |
| 3-Person Households | 370 (10.3%) | 31 (0.9%) |
| 4-Person Households | 305 (8.5%) | 0 (0.0%) |
| 5-Person Households | 271 (7.6%) | 0 (0.0%) |
| 6-Person Households | 83 (2.3%) | 0 (0.0%) |
| 7+ Person Households | 13 (0.4%) | 0 (0.0%) |
| Total | 2,081 (58.0%) | 1,506 (42.0%) |
Female Fertility in Marlboro Village
Fertility by Age in Marlboro Village
Average fertility rate in Marlboro Village is 56.0 births per 1,000 women. Women in the age bracket of 20 to 34 years have the highest fertility rate with 113.0 births per 1,000 women. Women in the age bracket of 20 to 34 years acount for 73.2% of all women with births.
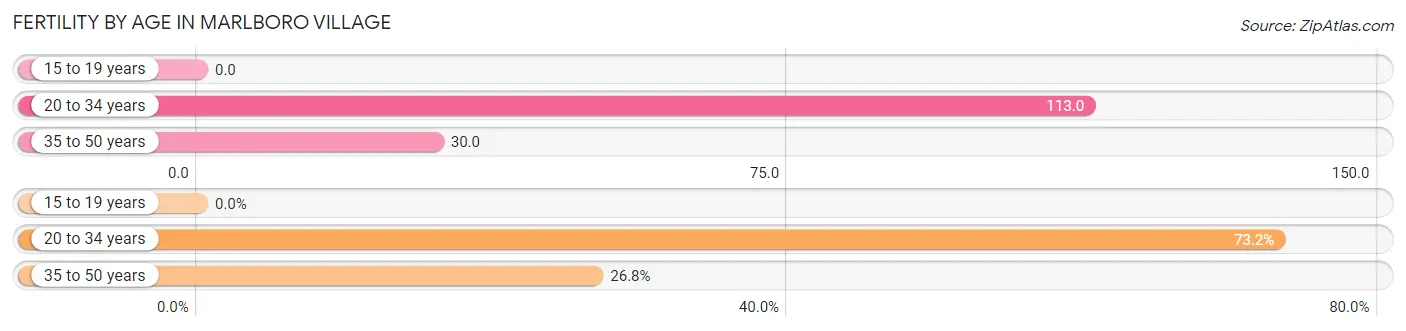
| Age Bracket | Women with Births | Births / 1,000 Women |
| 15 to 19 years | 0 (0.0%) | 0.0 |
| 20 to 34 years | 90 (73.2%) | 113.0 |
| 35 to 50 years | 33 (26.8%) | 30.0 |
| Total | 123 (100.0%) | 56.0 |
Fertility by Age by Marriage Status in Marlboro Village
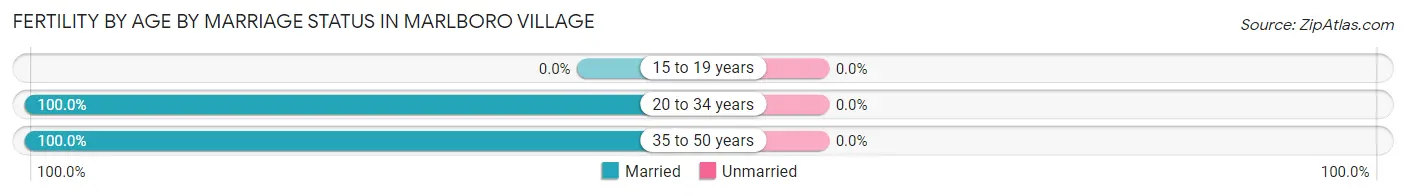
| Age Bracket | Married | Unmarried |
| 15 to 19 years | 0 (0.0%) | 0 (0.0%) |
| 20 to 34 years | 90 (100.0%) | 0 (0.0%) |
| 35 to 50 years | 33 (100.0%) | 0 (0.0%) |
| Total | 123 (100.0%) | 0 (0.0%) |
Fertility by Education in Marlboro Village
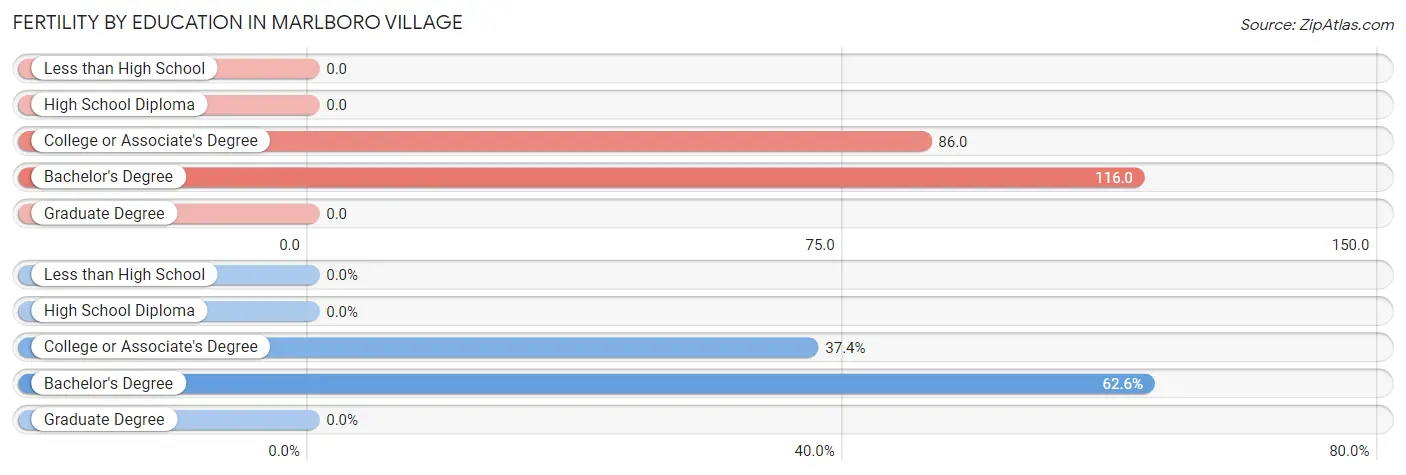
| Educational Attainment | Women with Births | Births / 1,000 Women |
| Less than High School | 0 (0.0%) | 0.0 |
| High School Diploma | 0 (0.0%) | 0.0 |
| College or Associate's Degree | 46 (37.4%) | 86.0 |
| Bachelor's Degree | 77 (62.6%) | 116.0 |
| Graduate Degree | 0 (0.0%) | 0.0 |
| Total | 123 (100.0%) | 56.0 |
Fertility by Education by Marriage Status in Marlboro Village
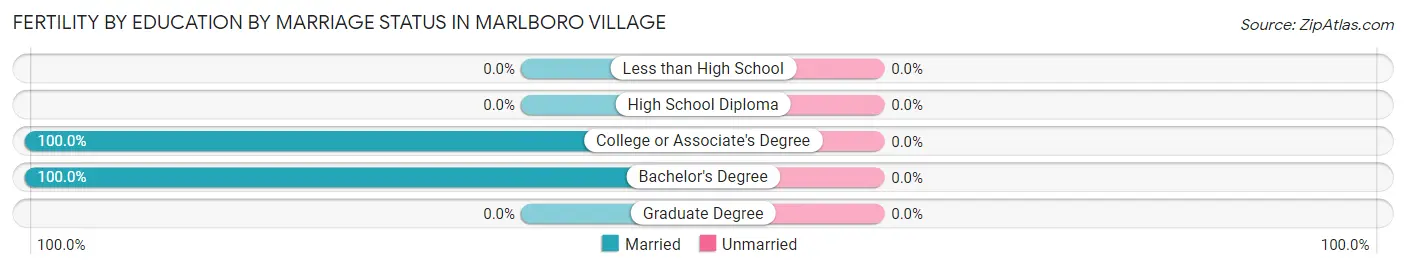
| Educational Attainment | Married | Unmarried |
| Less than High School | 0 (0.0%) | 0 (0.0%) |
| High School Diploma | 0 (0.0%) | 0 (0.0%) |
| College or Associate's Degree | 46 (100.0%) | 0 (0.0%) |
| Bachelor's Degree | 77 (100.0%) | 0 (0.0%) |
| Graduate Degree | 0 (0.0%) | 0 (0.0%) |
| Total | 123 (100.0%) | 0 (0.0%) |
Employment Characteristics in Marlboro Village
Employment by Class of Employer in Marlboro Village
Among the 4,997 employed individuals in Marlboro Village, private company employees (2,227 | 44.6%), federal government employees (1,194 | 23.9%), and not-for-profit organizations (530 | 10.6%) make up the most common classes of employment.
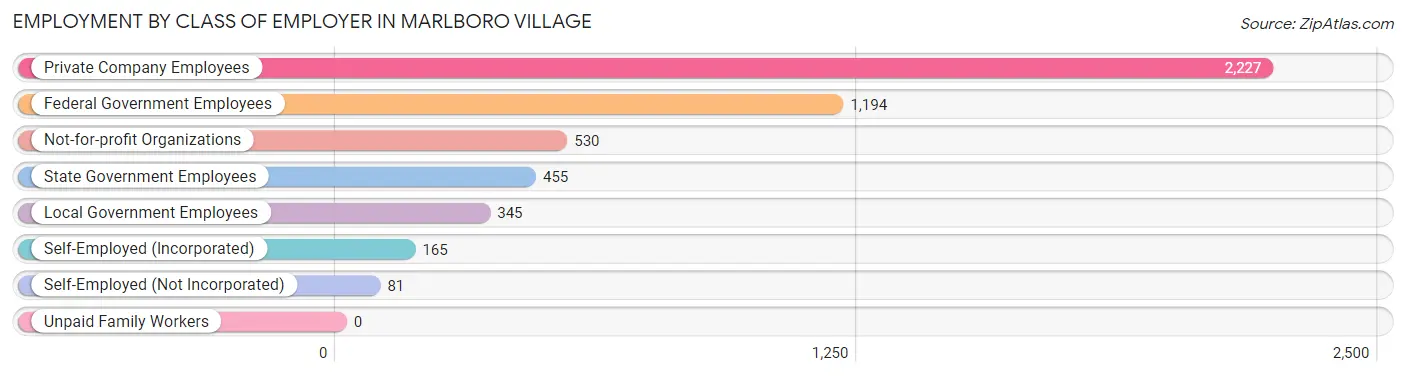
| Employer Class | # Employees | % Employees |
| Private Company Employees | 2,227 | 44.6% |
| Self-Employed (Incorporated) | 165 | 3.3% |
| Self-Employed (Not Incorporated) | 81 | 1.6% |
| Not-for-profit Organizations | 530 | 10.6% |
| Local Government Employees | 345 | 6.9% |
| State Government Employees | 455 | 9.1% |
| Federal Government Employees | 1,194 | 23.9% |
| Unpaid Family Workers | 0 | 0.0% |
| Total | 4,997 | 100.0% |
Employment Status by Age in Marlboro Village
According to the labor force statistics for Marlboro Village, out of the total population over 16 years of age (7,806), 69.2% or 5,402 individuals are in the labor force, with 5.5% or 297 of them unemployed. The age group with the highest labor force participation rate is 35 to 44 years, with 88.6% or 1,100 individuals in the labor force. Within the labor force, the 16 to 19 years age range has the highest percentage of unemployed individuals, with 19.2% or 49 of them being unemployed.
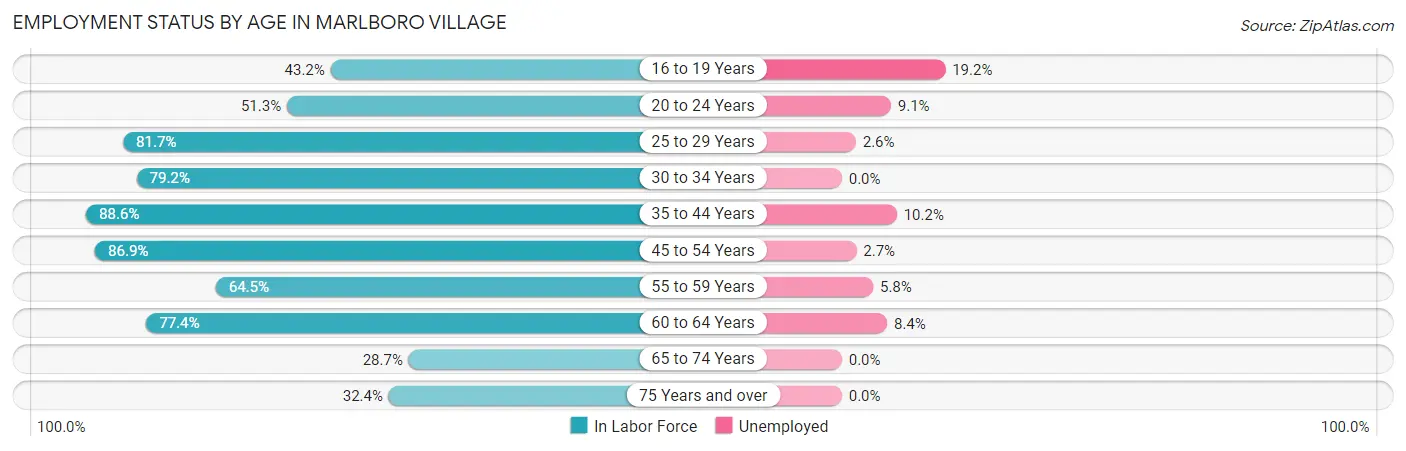
| Age Bracket | In Labor Force | Unemployed |
| 16 to 19 Years | 255 (43.2%) | 49 (19.2%) |
| 20 to 24 Years | 297 (51.3%) | 27 (9.1%) |
| 25 to 29 Years | 570 (81.7%) | 15 (2.6%) |
| 30 to 34 Years | 700 (79.2%) | 0 (0.0%) |
| 35 to 44 Years | 1,100 (88.6%) | 112 (10.2%) |
| 45 to 54 Years | 1,357 (86.9%) | 37 (2.7%) |
| 55 to 59 Years | 463 (64.5%) | 27 (5.8%) |
| 60 to 64 Years | 335 (77.4%) | 28 (8.4%) |
| 65 to 74 Years | 257 (28.7%) | 0 (0.0%) |
| 75 Years and over | 67 (32.4%) | 0 (0.0%) |
| Total | 5,402 (69.2%) | 297 (5.5%) |
Employment Status by Educational Attainment in Marlboro Village
According to labor force statistics for Marlboro Village, 81.7% of individuals (4,522) out of the total population between 25 and 64 years of age (5,535) are in the labor force, with 4.9% or 222 of them being unemployed. The group with the highest labor force participation rate are those with the educational attainment of bachelor's degree or higher, with 93.2% or 2,446 individuals in the labor force. Within the labor force, individuals with college / associate degree education have the highest percentage of unemployment, with 7.4% or 84 of them being unemployed.
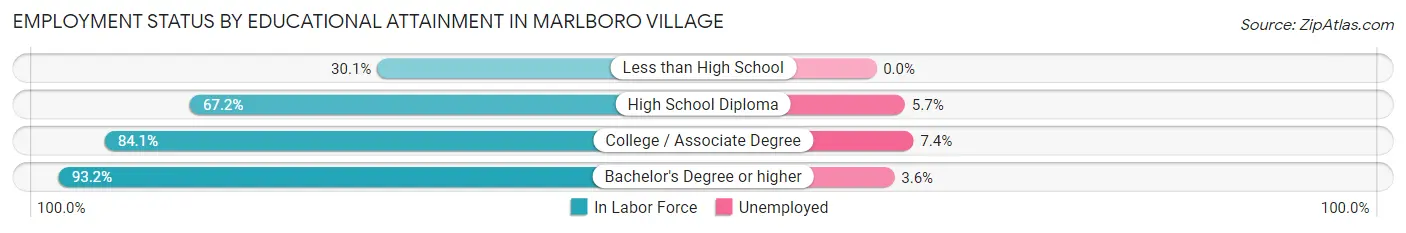
| Educational Attainment | In Labor Force | Unemployed |
| Less than High School | 87 (30.1%) | 0 (0.0%) |
| High School Diploma | 854 (67.2%) | 72 (5.7%) |
| College / Associate Degree | 1,135 (84.1%) | 100 (7.4%) |
| Bachelor's Degree or higher | 2,446 (93.2%) | 94 (3.6%) |
| Total | 4,522 (81.7%) | 271 (4.9%) |
Employment Occupations by Sex in Marlboro Village
Management, Business, Science and Arts Occupations
The most common Management, Business, Science and Arts occupations in Marlboro Village are Community & Social Service (831 | 16.4%), Management (716 | 14.1%), Computers, Engineering & Science (712 | 14.0%), Computers & Mathematics (554 | 10.9%), and Business & Financial (508 | 10.0%).
Management, Business, Science and Arts Occupations by Sex
Within the Management, Business, Science and Arts occupations in Marlboro Village, the most male-oriented occupations are Education, Arts & Media (94.1%), Architecture & Engineering (77.8%), and Arts, Media & Entertainment (62.3%), while the most female-oriented occupations are Legal Services & Support (89.5%), Health Technologists (87.3%), and Health Diagnosing & Treating (83.4%).
| Occupation | Male | Female |
| Management | 237 (33.1%) | 479 (66.9%) |
| Business & Financial | 244 (48.0%) | 264 (52.0%) |
| Computers, Engineering & Science | 391 (54.9%) | 321 (45.1%) |
| Computers & Mathematics | 286 (51.6%) | 268 (48.4%) |
| Architecture & Engineering | 70 (77.8%) | 20 (22.2%) |
| Life, Physical & Social Science | 35 (51.5%) | 33 (48.5%) |
| Community & Social Service | 327 (39.4%) | 504 (60.7%) |
| Education, Arts & Media | 128 (94.1%) | 8 (5.9%) |
| Legal Services & Support | 21 (10.5%) | 179 (89.5%) |
| Education Instruction & Library | 92 (25.8%) | 265 (74.2%) |
| Arts, Media & Entertainment | 86 (62.3%) | 52 (37.7%) |
| Health Diagnosing & Treating | 51 (16.6%) | 256 (83.4%) |
| Health Technologists | 30 (12.7%) | 207 (87.3%) |
| Total (Category) | 1,250 (40.7%) | 1,824 (59.3%) |
| Total (Overall) | 2,474 (48.7%) | 2,604 (51.3%) |
Services Occupations
The most common Services occupations in Marlboro Village are Personal Care & Service (204 | 4.0%), Security & Protection (185 | 3.6%), Food Preparation & Serving (157 | 3.1%), Firefighting & Prevention (127 | 2.5%), and Cleaning & Maintenance (125 | 2.5%).
Services Occupations by Sex
Within the Services occupations in Marlboro Village, the most male-oriented occupations are Law Enforcement (100.0%), Security & Protection (87.6%), and Firefighting & Prevention (81.9%), while the most female-oriented occupations are Personal Care & Service (93.1%), Healthcare Support (74.4%), and Food Preparation & Serving (29.9%).
| Occupation | Male | Female |
| Healthcare Support | 30 (25.6%) | 87 (74.4%) |
| Security & Protection | 162 (87.6%) | 23 (12.4%) |
| Firefighting & Prevention | 104 (81.9%) | 23 (18.1%) |
| Law Enforcement | 58 (100.0%) | 0 (0.0%) |
| Food Preparation & Serving | 110 (70.1%) | 47 (29.9%) |
| Cleaning & Maintenance | 98 (78.4%) | 27 (21.6%) |
| Personal Care & Service | 14 (6.9%) | 190 (93.1%) |
| Total (Category) | 414 (52.5%) | 374 (47.5%) |
| Total (Overall) | 2,474 (48.7%) | 2,604 (51.3%) |
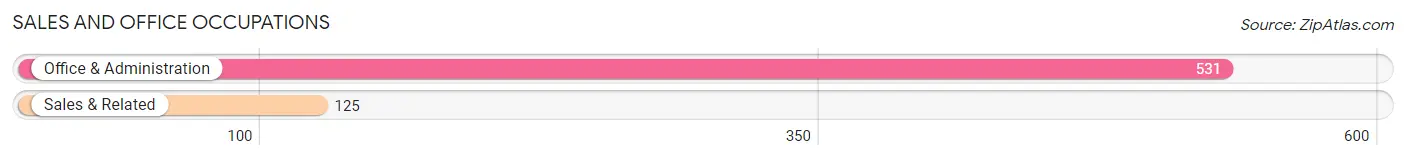
Sales and Office Occupations
The most common Sales and Office occupations in Marlboro Village are Office & Administration (531 | 10.5%), and Sales & Related (125 | 2.5%).
Sales and Office Occupations by Sex
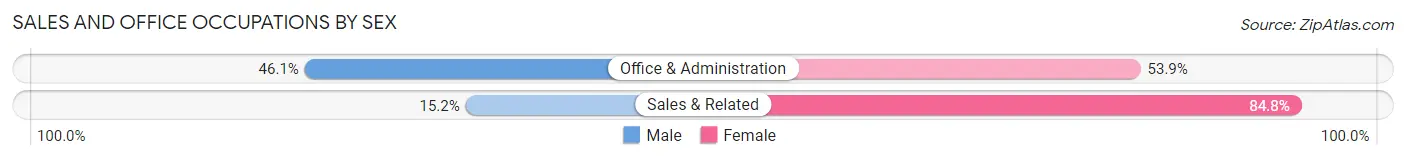
| Occupation | Male | Female |
| Sales & Related | 19 (15.2%) | 106 (84.8%) |
| Office & Administration | 245 (46.1%) | 286 (53.9%) |
| Total (Category) | 264 (40.2%) | 392 (59.8%) |
| Total (Overall) | 2,474 (48.7%) | 2,604 (51.3%) |
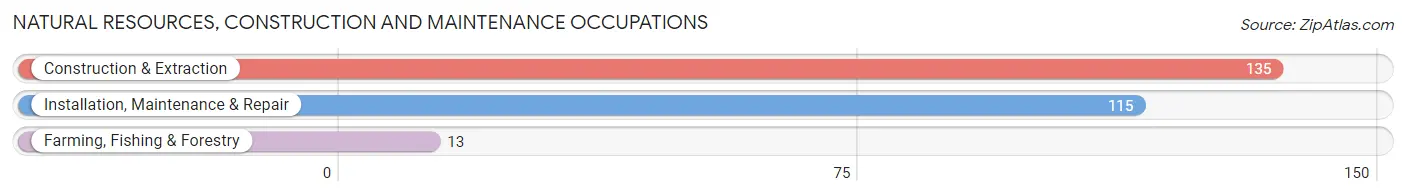
Natural Resources, Construction and Maintenance Occupations
The most common Natural Resources, Construction and Maintenance occupations in Marlboro Village are Construction & Extraction (135 | 2.7%), Installation, Maintenance & Repair (115 | 2.3%), and Farming, Fishing & Forestry (13 | 0.3%).
Natural Resources, Construction and Maintenance Occupations by Sex
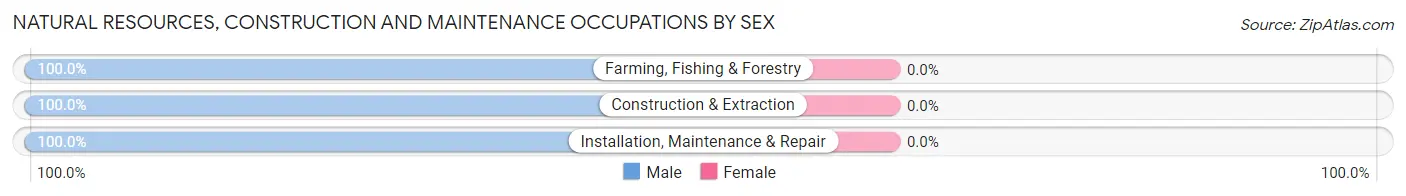
| Occupation | Male | Female |
| Farming, Fishing & Forestry | 13 (100.0%) | 0 (0.0%) |
| Construction & Extraction | 135 (100.0%) | 0 (0.0%) |
| Installation, Maintenance & Repair | 115 (100.0%) | 0 (0.0%) |
| Total (Category) | 263 (100.0%) | 0 (0.0%) |
| Total (Overall) | 2,474 (48.7%) | 2,604 (51.3%) |
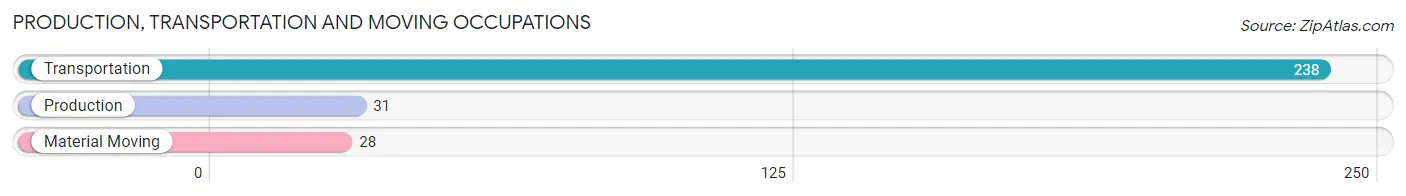
Production, Transportation and Moving Occupations
The most common Production, Transportation and Moving occupations in Marlboro Village are Transportation (238 | 4.7%), Production (31 | 0.6%), and Material Moving (28 | 0.5%).
Production, Transportation and Moving Occupations by Sex
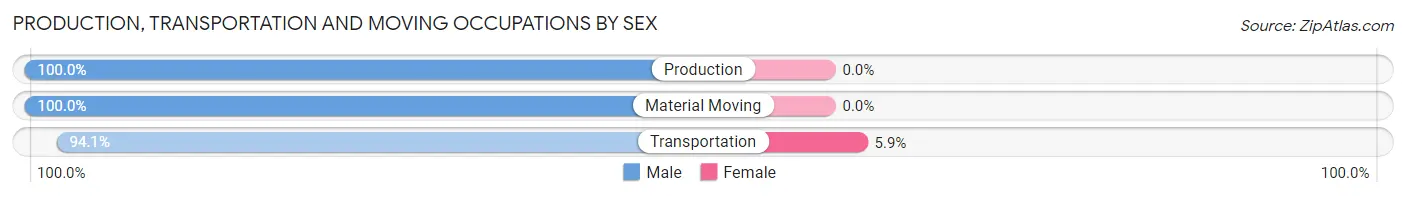
| Occupation | Male | Female |
| Production | 31 (100.0%) | 0 (0.0%) |
| Transportation | 224 (94.1%) | 14 (5.9%) |
| Material Moving | 28 (100.0%) | 0 (0.0%) |
| Total (Category) | 283 (95.3%) | 14 (4.7%) |
| Total (Overall) | 2,474 (48.7%) | 2,604 (51.3%) |
Employment Industries by Sex in Marlboro Village
Employment Industries in Marlboro Village
The major employment industries in Marlboro Village include Public Administration (1,316 | 25.9%), Professional & Scientific (608 | 12.0%), Educational Services (509 | 10.0%), Health Care & Social Assistance (426 | 8.4%), and Administrative & Support (305 | 6.0%).
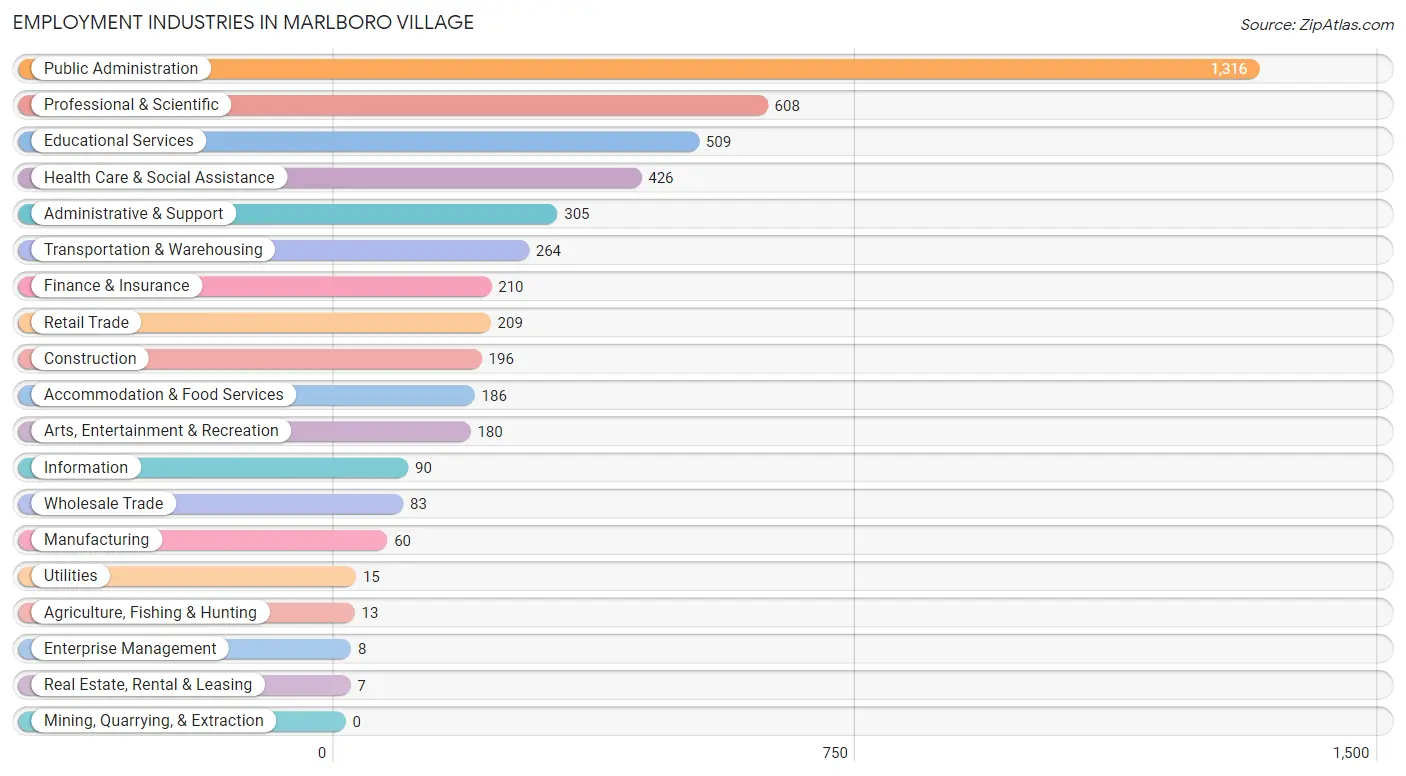
Employment Industries by Sex in Marlboro Village
The Marlboro Village industries that see more men than women are Agriculture, Fishing & Hunting (100.0%), Manufacturing (100.0%), and Wholesale Trade (100.0%), whereas the industries that tend to have a higher number of women are Real Estate, Rental & Leasing (100.0%), Enterprise Management (100.0%), and Information (85.6%).
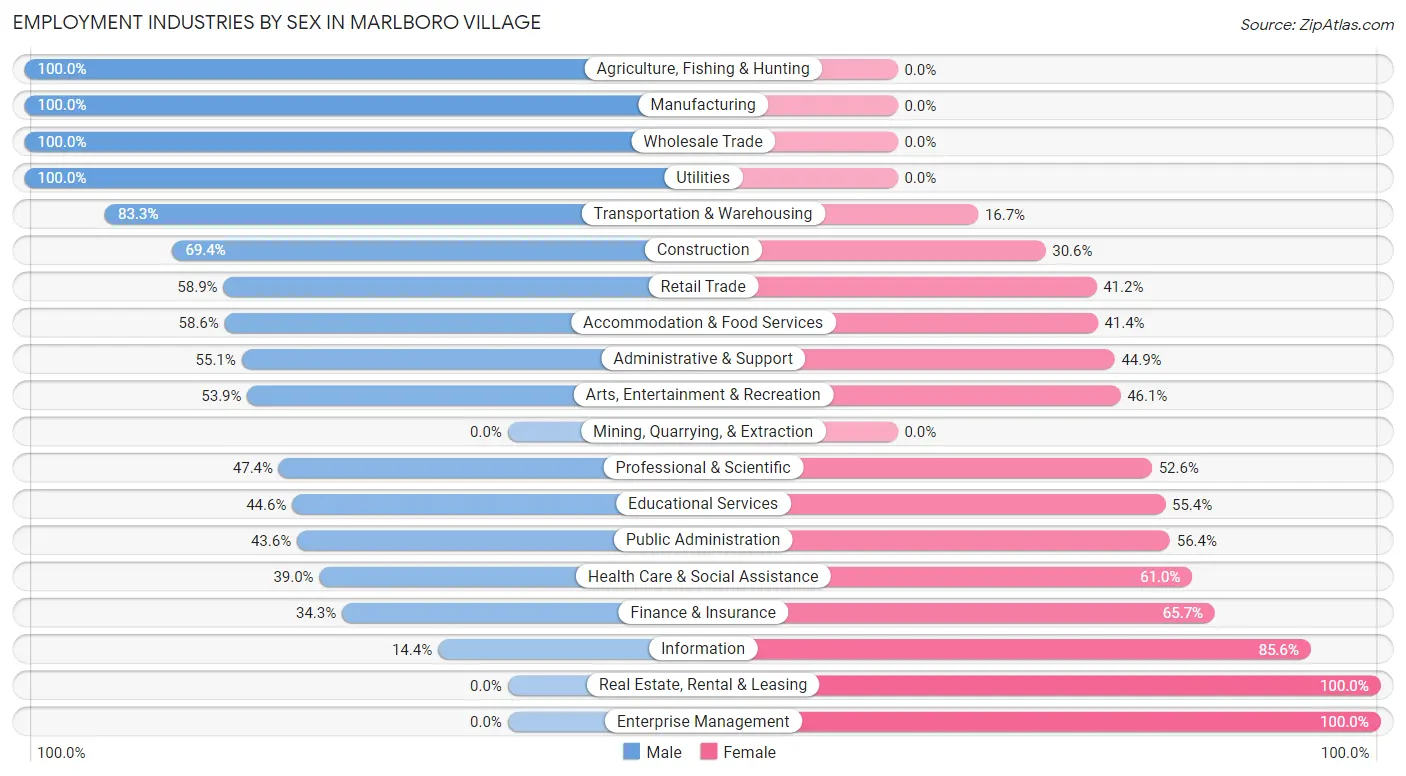
| Industry | Male | Female |
| Agriculture, Fishing & Hunting | 13 (100.0%) | 0 (0.0%) |
| Mining, Quarrying, & Extraction | 0 (0.0%) | 0 (0.0%) |
| Construction | 136 (69.4%) | 60 (30.6%) |
| Manufacturing | 60 (100.0%) | 0 (0.0%) |
| Wholesale Trade | 83 (100.0%) | 0 (0.0%) |
| Retail Trade | 123 (58.9%) | 86 (41.1%) |
| Transportation & Warehousing | 220 (83.3%) | 44 (16.7%) |
| Utilities | 15 (100.0%) | 0 (0.0%) |
| Information | 13 (14.4%) | 77 (85.6%) |
| Finance & Insurance | 72 (34.3%) | 138 (65.7%) |
| Real Estate, Rental & Leasing | 0 (0.0%) | 7 (100.0%) |
| Professional & Scientific | 288 (47.4%) | 320 (52.6%) |
| Enterprise Management | 0 (0.0%) | 8 (100.0%) |
| Administrative & Support | 168 (55.1%) | 137 (44.9%) |
| Educational Services | 227 (44.6%) | 282 (55.4%) |
| Health Care & Social Assistance | 166 (39.0%) | 260 (61.0%) |
| Arts, Entertainment & Recreation | 97 (53.9%) | 83 (46.1%) |
| Accommodation & Food Services | 109 (58.6%) | 77 (41.4%) |
| Public Administration | 574 (43.6%) | 742 (56.4%) |
| Total | 2,474 (48.7%) | 2,604 (51.3%) |
Education in Marlboro Village
School Enrollment in Marlboro Village
The most common levels of schooling among the 2,202 students in Marlboro Village are high school (611 | 27.8%), college / undergraduate (585 | 26.6%), and elementary school (433 | 19.7%).
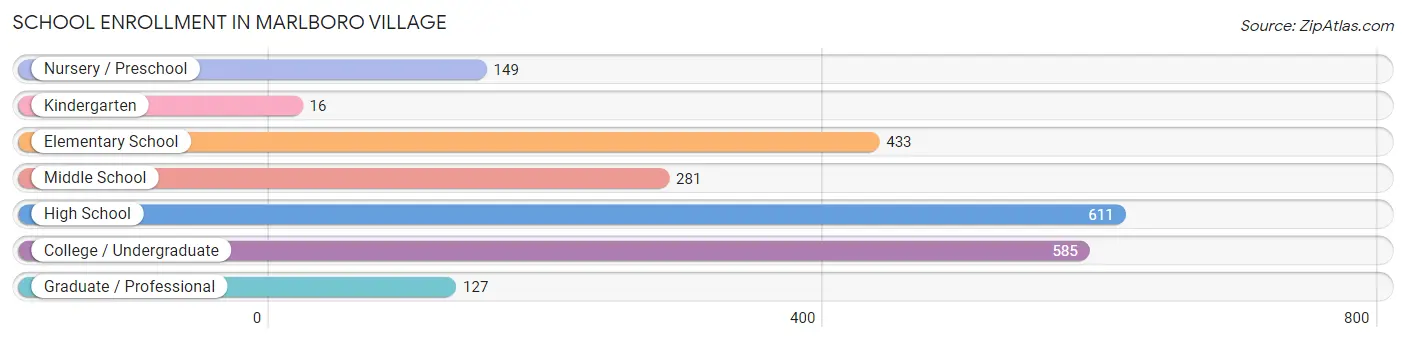
| School Level | # Students | % Students |
| Nursery / Preschool | 149 | 6.8% |
| Kindergarten | 16 | 0.7% |
| Elementary School | 433 | 19.7% |
| Middle School | 281 | 12.8% |
| High School | 611 | 27.8% |
| College / Undergraduate | 585 | 26.6% |
| Graduate / Professional | 127 | 5.8% |
| Total | 2,202 | 100.0% |
School Enrollment by Age by Funding Source in Marlboro Village
Out of a total of 2,202 students who are enrolled in schools in Marlboro Village, 412 (18.7%) attend a private institution, while the remaining 1,790 (81.3%) are enrolled in public schools. The age group of 35 years and over has the highest likelihood of being enrolled in private schools, with 156 (60.7% in the age bracket) enrolled. Conversely, the age group of 20 to 24 year olds has the lowest likelihood of being enrolled in a private school, with 186 (100.0% in the age bracket) attending a public institution.
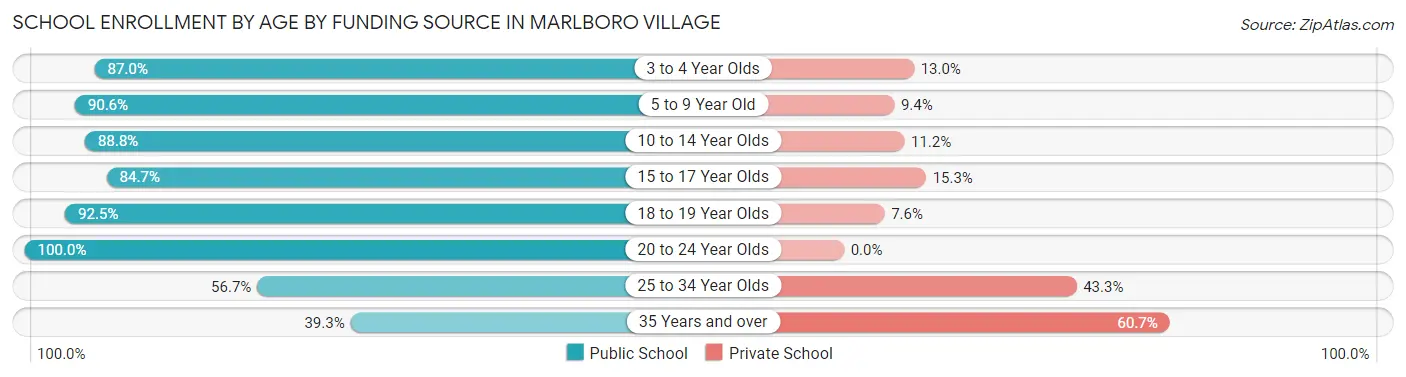
| Age Bracket | Public School | Private School |
| 3 to 4 Year Olds | 80 (87.0%) | 12 (13.0%) |
| 5 to 9 Year Old | 445 (90.6%) | 46 (9.4%) |
| 10 to 14 Year Olds | 300 (88.8%) | 38 (11.2%) |
| 15 to 17 Year Olds | 327 (84.7%) | 59 (15.3%) |
| 18 to 19 Year Olds | 245 (92.4%) | 20 (7.5%) |
| 20 to 24 Year Olds | 186 (100.0%) | 0 (0.0%) |
| 25 to 34 Year Olds | 106 (56.7%) | 81 (43.3%) |
| 35 Years and over | 101 (39.3%) | 156 (60.7%) |
| Total | 1,790 (81.3%) | 412 (18.7%) |
Educational Attainment by Field of Study in Marlboro Village
Business (923 | 28.5%), science & technology (365 | 11.3%), computers & mathematics (339 | 10.5%), social sciences (307 | 9.5%), and psychology (240 | 7.4%) are the most common fields of study among 3,236 individuals in Marlboro Village who have obtained a bachelor's degree or higher.
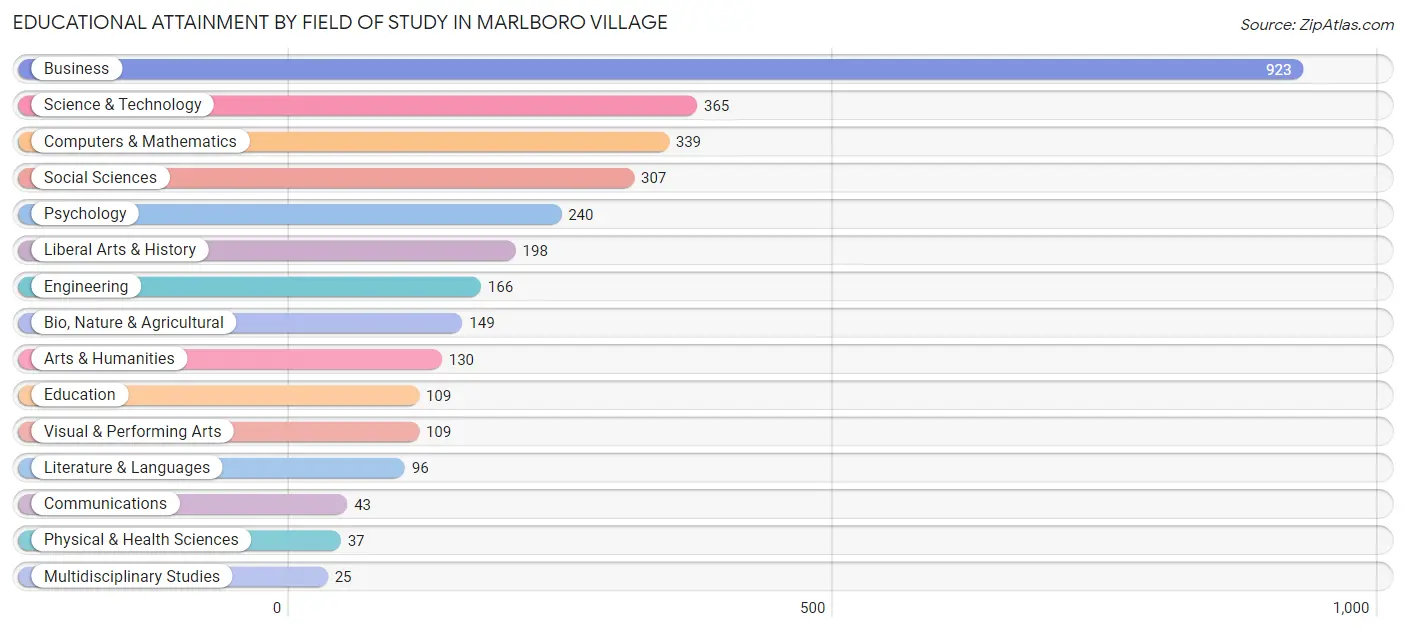
| Field of Study | # Graduates | % Graduates |
| Computers & Mathematics | 339 | 10.5% |
| Bio, Nature & Agricultural | 149 | 4.6% |
| Physical & Health Sciences | 37 | 1.1% |
| Psychology | 240 | 7.4% |
| Social Sciences | 307 | 9.5% |
| Engineering | 166 | 5.1% |
| Multidisciplinary Studies | 25 | 0.8% |
| Science & Technology | 365 | 11.3% |
| Business | 923 | 28.5% |
| Education | 109 | 3.4% |
| Literature & Languages | 96 | 3.0% |
| Liberal Arts & History | 198 | 6.1% |
| Visual & Performing Arts | 109 | 3.4% |
| Communications | 43 | 1.3% |
| Arts & Humanities | 130 | 4.0% |
| Total | 3,236 | 100.0% |
Transportation & Commute in Marlboro Village
Vehicle Availability by Sex in Marlboro Village
The most prevalent vehicle ownership categories in Marlboro Village are males with 2 vehicles (962, accounting for 39.1%) and females with 2 vehicles (861, making up 37.9%).
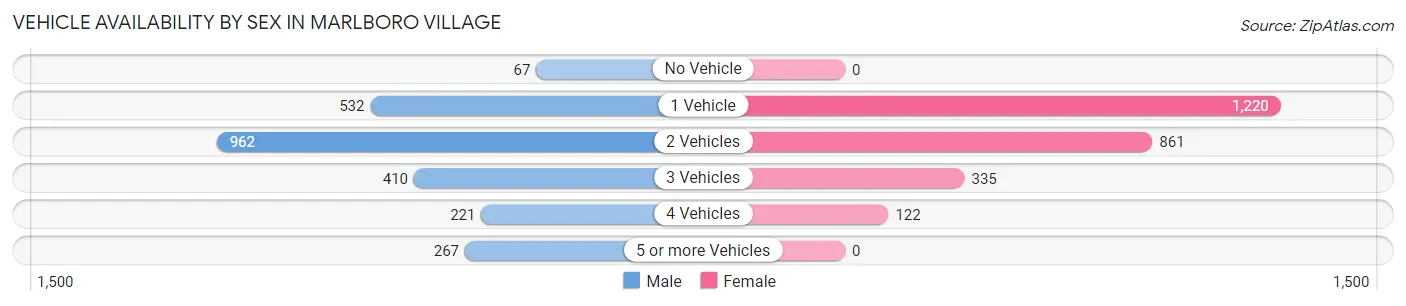
| Vehicles Available | Male | Female |
| No Vehicle | 67 (2.7%) | 0 (0.0%) |
| 1 Vehicle | 532 (21.6%) | 1,220 (48.1%) |
| 2 Vehicles | 962 (39.1%) | 861 (33.9%) |
| 3 Vehicles | 410 (16.7%) | 335 (13.2%) |
| 4 Vehicles | 221 (9.0%) | 122 (4.8%) |
| 5 or more Vehicles | 267 (10.9%) | 0 (0.0%) |
| Total | 2,459 (100.0%) | 2,538 (100.0%) |
Commute Time in Marlboro Village
The most frequently occuring commute durations in Marlboro Village are 45 to 59 minutes (987 commuters, 21.9%), 30 to 34 minutes (789 commuters, 17.5%), and 60 to 89 minutes (749 commuters, 16.6%).
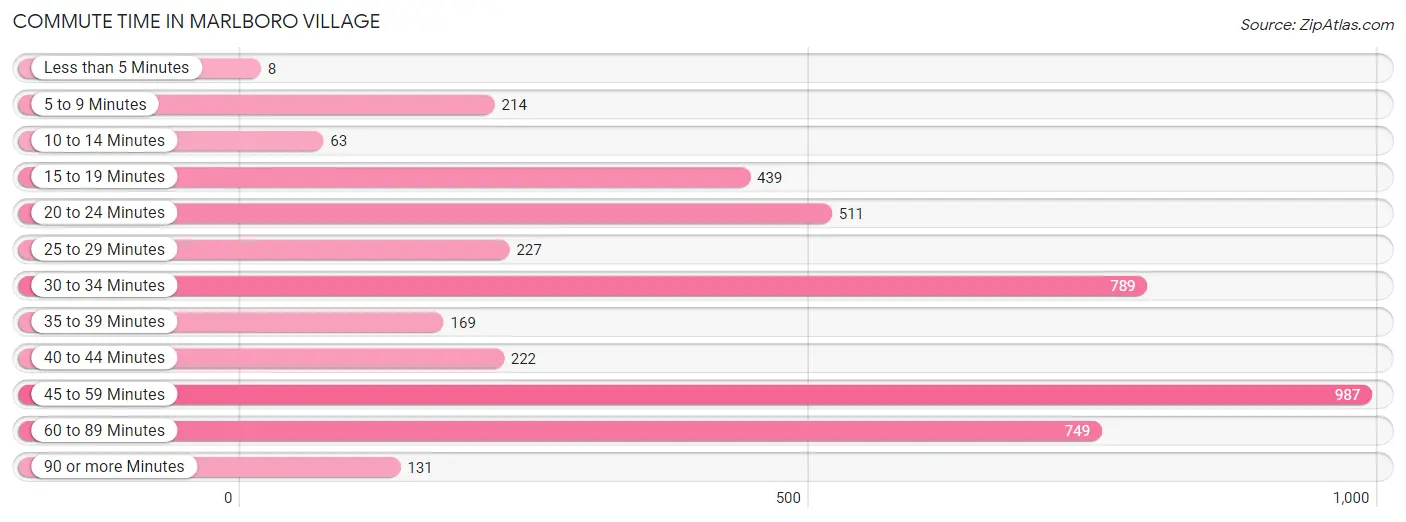
| Commute Time | # Commuters | % Commuters |
| Less than 5 Minutes | 8 | 0.2% |
| 5 to 9 Minutes | 214 | 4.8% |
| 10 to 14 Minutes | 63 | 1.4% |
| 15 to 19 Minutes | 439 | 9.7% |
| 20 to 24 Minutes | 511 | 11.3% |
| 25 to 29 Minutes | 227 | 5.0% |
| 30 to 34 Minutes | 789 | 17.5% |
| 35 to 39 Minutes | 169 | 3.7% |
| 40 to 44 Minutes | 222 | 4.9% |
| 45 to 59 Minutes | 987 | 21.9% |
| 60 to 89 Minutes | 749 | 16.6% |
| 90 or more Minutes | 131 | 2.9% |
Commute Time by Sex in Marlboro Village
The most common commute times in Marlboro Village are 30 to 34 minutes (436 commuters, 19.3%) for males and 45 to 59 minutes (582 commuters, 25.8%) for females.
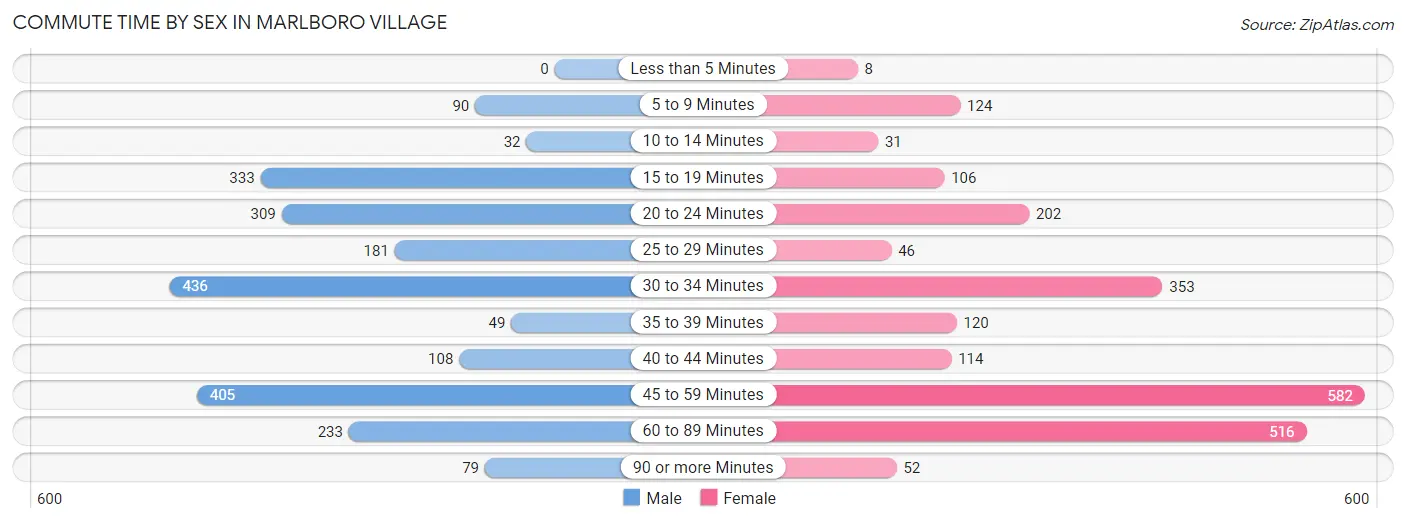
| Commute Time | Male | Female |
| Less than 5 Minutes | 0 (0.0%) | 8 (0.4%) |
| 5 to 9 Minutes | 90 (4.0%) | 124 (5.5%) |
| 10 to 14 Minutes | 32 (1.4%) | 31 (1.4%) |
| 15 to 19 Minutes | 333 (14.8%) | 106 (4.7%) |
| 20 to 24 Minutes | 309 (13.7%) | 202 (9.0%) |
| 25 to 29 Minutes | 181 (8.0%) | 46 (2.0%) |
| 30 to 34 Minutes | 436 (19.3%) | 353 (15.7%) |
| 35 to 39 Minutes | 49 (2.2%) | 120 (5.3%) |
| 40 to 44 Minutes | 108 (4.8%) | 114 (5.1%) |
| 45 to 59 Minutes | 405 (18.0%) | 582 (25.8%) |
| 60 to 89 Minutes | 233 (10.3%) | 516 (22.9%) |
| 90 or more Minutes | 79 (3.5%) | 52 (2.3%) |
Time of Departure to Work by Sex in Marlboro Village
The most frequent times of departure to work in Marlboro Village are 8:00 AM to 8:29 AM (488, 21.6%) for males and 8:00 AM to 8:29 AM (388, 17.2%) for females.
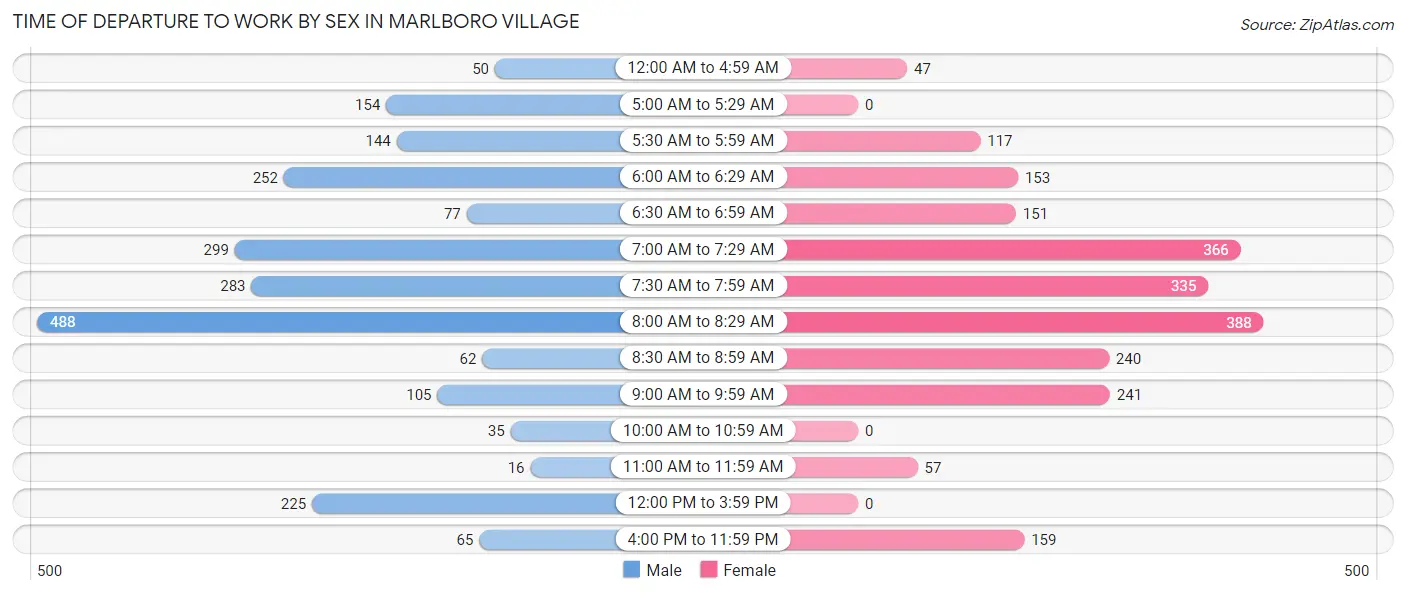
| Time of Departure | Male | Female |
| 12:00 AM to 4:59 AM | 50 (2.2%) | 47 (2.1%) |
| 5:00 AM to 5:29 AM | 154 (6.8%) | 0 (0.0%) |
| 5:30 AM to 5:59 AM | 144 (6.4%) | 117 (5.2%) |
| 6:00 AM to 6:29 AM | 252 (11.2%) | 153 (6.8%) |
| 6:30 AM to 6:59 AM | 77 (3.4%) | 151 (6.7%) |
| 7:00 AM to 7:29 AM | 299 (13.3%) | 366 (16.2%) |
| 7:30 AM to 7:59 AM | 283 (12.6%) | 335 (14.9%) |
| 8:00 AM to 8:29 AM | 488 (21.6%) | 388 (17.2%) |
| 8:30 AM to 8:59 AM | 62 (2.8%) | 240 (10.6%) |
| 9:00 AM to 9:59 AM | 105 (4.7%) | 241 (10.7%) |
| 10:00 AM to 10:59 AM | 35 (1.5%) | 0 (0.0%) |
| 11:00 AM to 11:59 AM | 16 (0.7%) | 57 (2.5%) |
| 12:00 PM to 3:59 PM | 225 (10.0%) | 0 (0.0%) |
| 4:00 PM to 11:59 PM | 65 (2.9%) | 159 (7.0%) |
| Total | 2,255 (100.0%) | 2,254 (100.0%) |
Housing Occupancy in Marlboro Village
Occupancy by Ownership in Marlboro Village
Of the total 3,587 dwellings in Marlboro Village, owner-occupied units account for 2,778 (77.4%), while renter-occupied units make up 809 (22.6%).
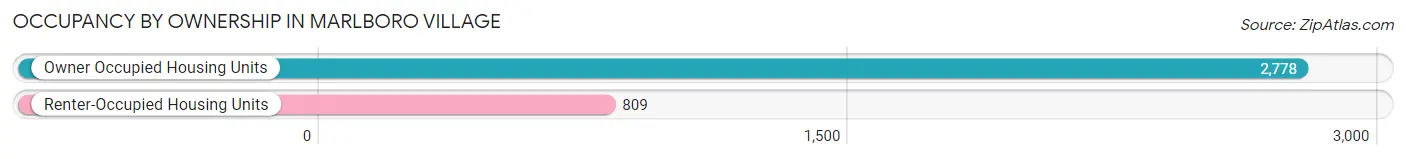
| Occupancy | # Housing Units | % Housing Units |
| Owner Occupied Housing Units | 2,778 | 77.4% |
| Renter-Occupied Housing Units | 809 | 22.6% |
| Total Occupied Housing Units | 3,587 | 100.0% |
Occupancy by Household Size in Marlboro Village
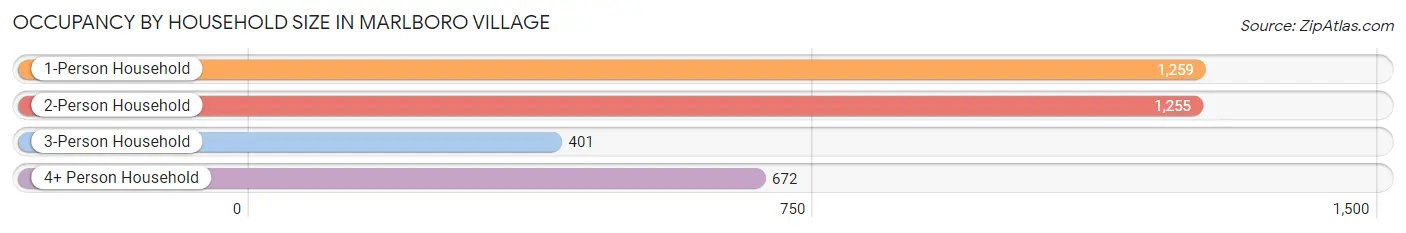
| Household Size | # Housing Units | % Housing Units |
| 1-Person Household | 1,259 | 35.1% |
| 2-Person Household | 1,255 | 35.0% |
| 3-Person Household | 401 | 11.2% |
| 4+ Person Household | 672 | 18.7% |
| Total Housing Units | 3,587 | 100.0% |
Occupancy by Ownership by Household Size in Marlboro Village
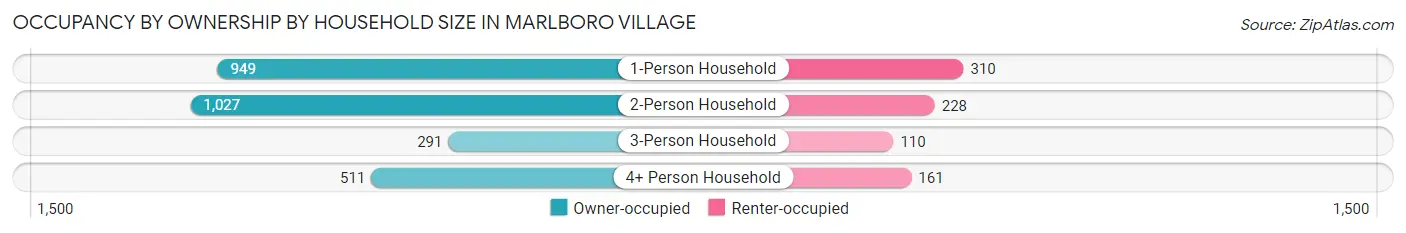
| Household Size | Owner-occupied | Renter-occupied |
| 1-Person Household | 949 (75.4%) | 310 (24.6%) |
| 2-Person Household | 1,027 (81.8%) | 228 (18.2%) |
| 3-Person Household | 291 (72.6%) | 110 (27.4%) |
| 4+ Person Household | 511 (76.0%) | 161 (24.0%) |
| Total Housing Units | 2,778 (77.4%) | 809 (22.6%) |
Occupancy by Educational Attainment in Marlboro Village
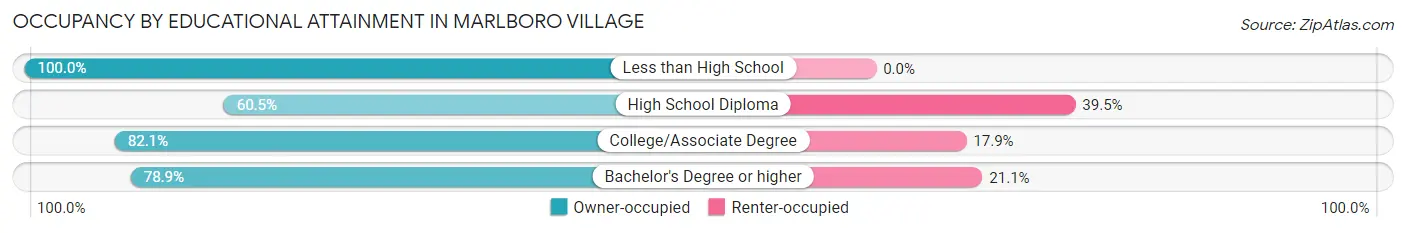
| Household Size | Owner-occupied | Renter-occupied |
| Less than High School | 37 (100.0%) | 0 (0.0%) |
| High School Diploma | 317 (60.5%) | 207 (39.5%) |
| College/Associate Degree | 913 (82.1%) | 199 (17.9%) |
| Bachelor's Degree or higher | 1,511 (78.9%) | 403 (21.1%) |
Occupancy by Age of Householder in Marlboro Village
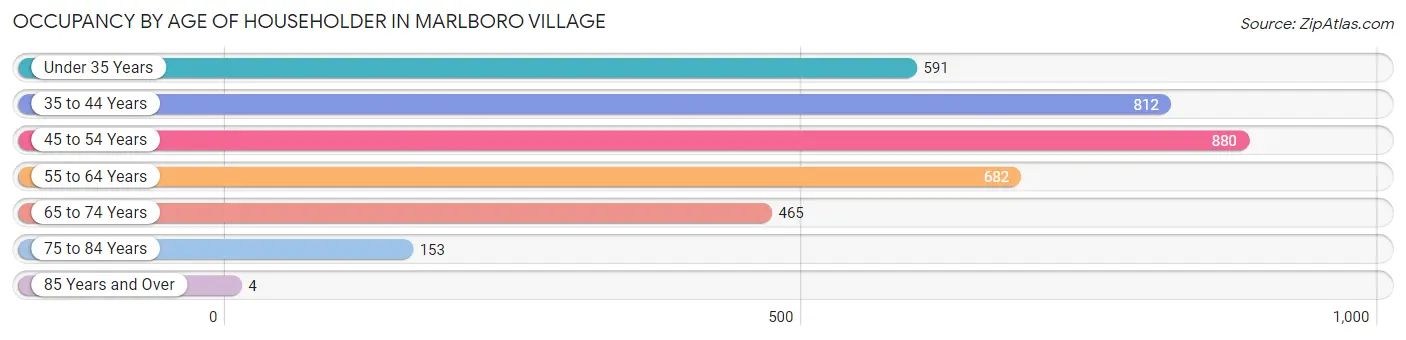
| Age Bracket | # Households | % Households |
| Under 35 Years | 591 | 16.5% |
| 35 to 44 Years | 812 | 22.6% |
| 45 to 54 Years | 880 | 24.5% |
| 55 to 64 Years | 682 | 19.0% |
| 65 to 74 Years | 465 | 13.0% |
| 75 to 84 Years | 153 | 4.3% |
| 85 Years and Over | 4 | 0.1% |
| Total | 3,587 | 100.0% |
Housing Finances in Marlboro Village
Median Income by Occupancy in Marlboro Village
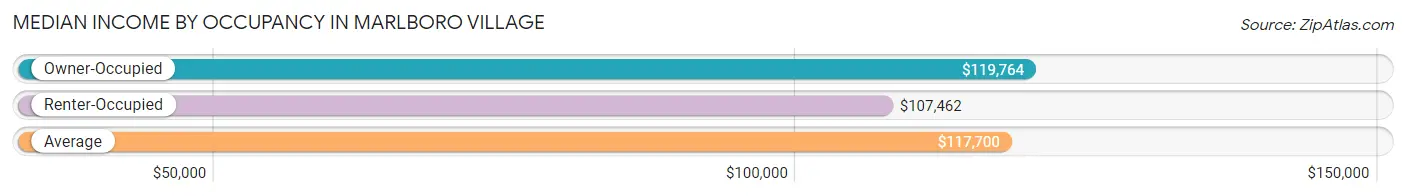
| Occupancy Type | # Households | Median Income |
| Owner-Occupied | 2,778 (77.4%) | $119,764 |
| Renter-Occupied | 809 (22.6%) | $107,462 |
| Average | 3,587 (100.0%) | $117,700 |
Occupancy by Householder Income Bracket in Marlboro Village
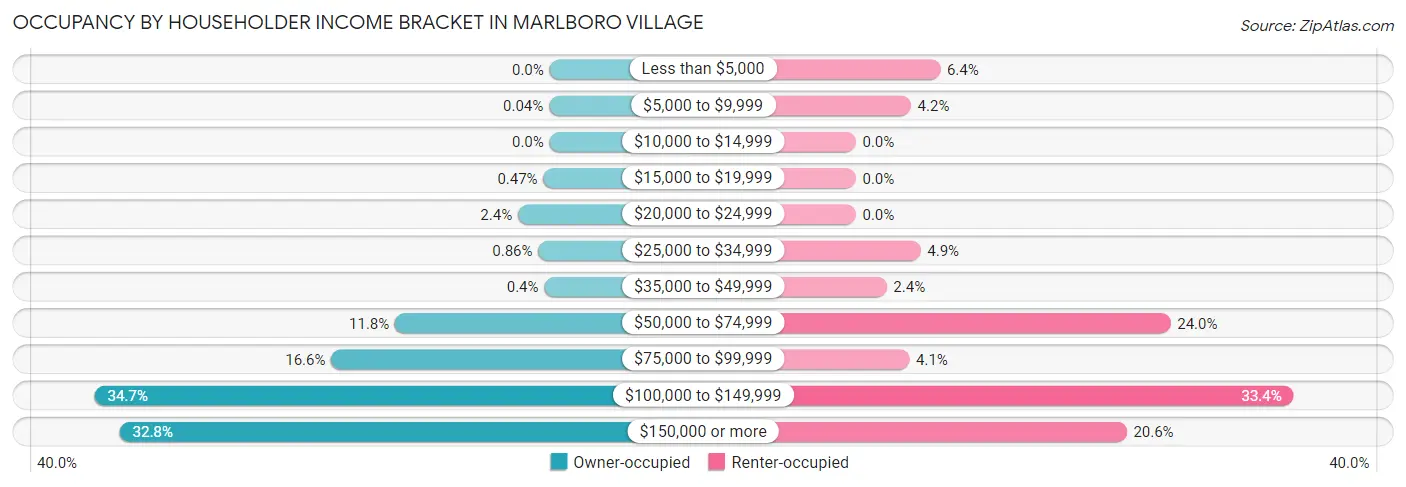
| Income Bracket | Owner-occupied | Renter-occupied |
| Less than $5,000 | 0 (0.0%) | 52 (6.4%) |
| $5,000 to $9,999 | 1 (0.0%) | 34 (4.2%) |
| $10,000 to $14,999 | 0 (0.0%) | 0 (0.0%) |
| $15,000 to $19,999 | 13 (0.5%) | 0 (0.0%) |
| $20,000 to $24,999 | 67 (2.4%) | 0 (0.0%) |
| $25,000 to $34,999 | 24 (0.9%) | 40 (4.9%) |
| $35,000 to $49,999 | 11 (0.4%) | 19 (2.4%) |
| $50,000 to $74,999 | 327 (11.8%) | 194 (24.0%) |
| $75,000 to $99,999 | 462 (16.6%) | 33 (4.1%) |
| $100,000 to $149,999 | 963 (34.7%) | 270 (33.4%) |
| $150,000 or more | 910 (32.8%) | 167 (20.6%) |
| Total | 2,778 (100.0%) | 809 (100.0%) |
Monthly Housing Cost Tiers in Marlboro Village
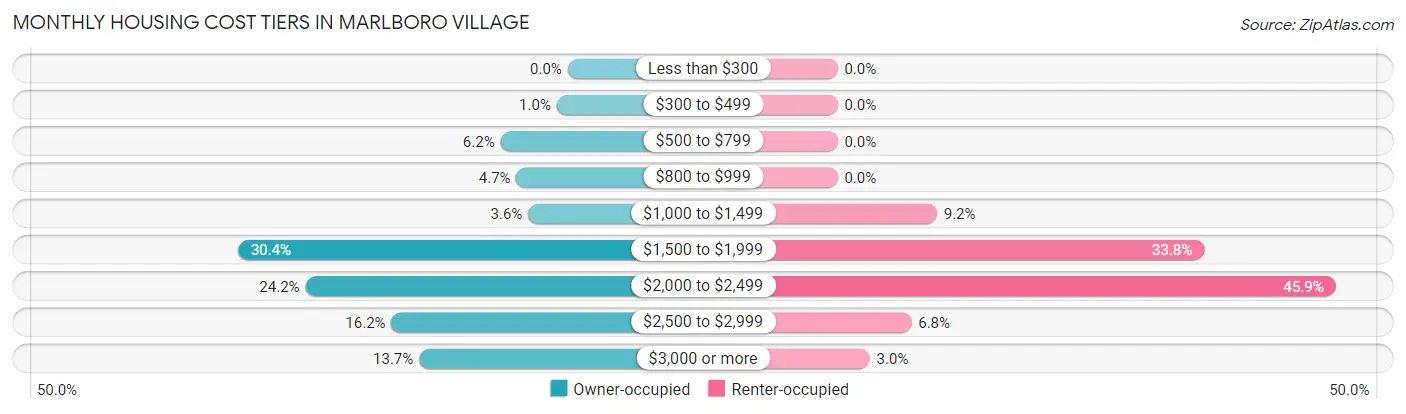
| Monthly Cost | Owner-occupied | Renter-occupied |
| Less than $300 | 0 (0.0%) | 0 (0.0%) |
| $300 to $499 | 28 (1.0%) | 0 (0.0%) |
| $500 to $799 | 172 (6.2%) | 0 (0.0%) |
| $800 to $999 | 131 (4.7%) | 0 (0.0%) |
| $1,000 to $1,499 | 101 (3.6%) | 74 (9.1%) |
| $1,500 to $1,999 | 844 (30.4%) | 273 (33.8%) |
| $2,000 to $2,499 | 671 (24.1%) | 371 (45.9%) |
| $2,500 to $2,999 | 451 (16.2%) | 55 (6.8%) |
| $3,000 or more | 380 (13.7%) | 24 (3.0%) |
| Total | 2,778 (100.0%) | 809 (100.0%) |
Physical Housing Characteristics in Marlboro Village
Housing Structures in Marlboro Village
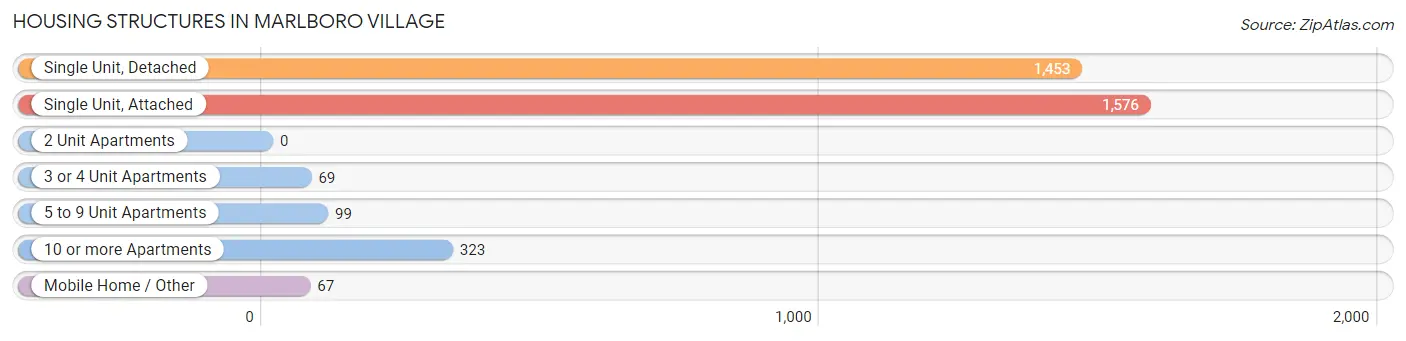
| Structure Type | # Housing Units | % Housing Units |
| Single Unit, Detached | 1,453 | 40.5% |
| Single Unit, Attached | 1,576 | 43.9% |
| 2 Unit Apartments | 0 | 0.0% |
| 3 or 4 Unit Apartments | 69 | 1.9% |
| 5 to 9 Unit Apartments | 99 | 2.8% |
| 10 or more Apartments | 323 | 9.0% |
| Mobile Home / Other | 67 | 1.9% |
| Total | 3,587 | 100.0% |
Housing Structures by Occupancy in Marlboro Village
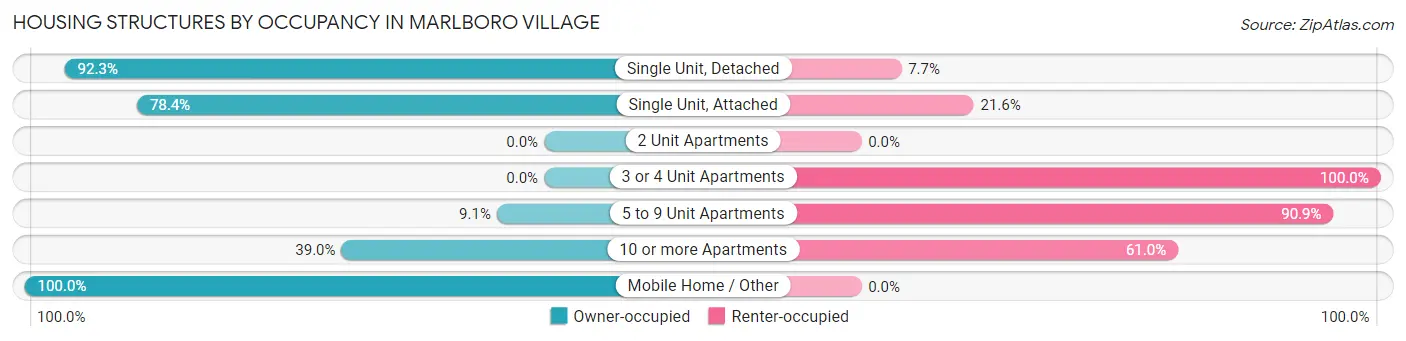
| Structure Type | Owner-occupied | Renter-occupied |
| Single Unit, Detached | 1,341 (92.3%) | 112 (7.7%) |
| Single Unit, Attached | 1,235 (78.4%) | 341 (21.6%) |
| 2 Unit Apartments | 0 (0.0%) | 0 (0.0%) |
| 3 or 4 Unit Apartments | 0 (0.0%) | 69 (100.0%) |
| 5 to 9 Unit Apartments | 9 (9.1%) | 90 (90.9%) |
| 10 or more Apartments | 126 (39.0%) | 197 (61.0%) |
| Mobile Home / Other | 67 (100.0%) | 0 (0.0%) |
| Total | 2,778 (77.4%) | 809 (22.6%) |
Housing Structures by Number of Rooms in Marlboro Village
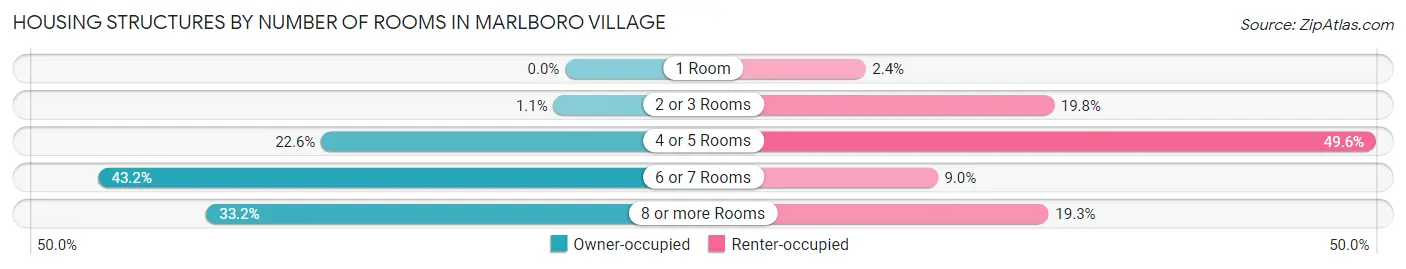
| Number of Rooms | Owner-occupied | Renter-occupied |
| 1 Room | 0 (0.0%) | 19 (2.4%) |
| 2 or 3 Rooms | 30 (1.1%) | 160 (19.8%) |
| 4 or 5 Rooms | 627 (22.6%) | 401 (49.6%) |
| 6 or 7 Rooms | 1,199 (43.2%) | 73 (9.0%) |
| 8 or more Rooms | 922 (33.2%) | 156 (19.3%) |
| Total | 2,778 (100.0%) | 809 (100.0%) |
Housing Structure by Heating Type in Marlboro Village
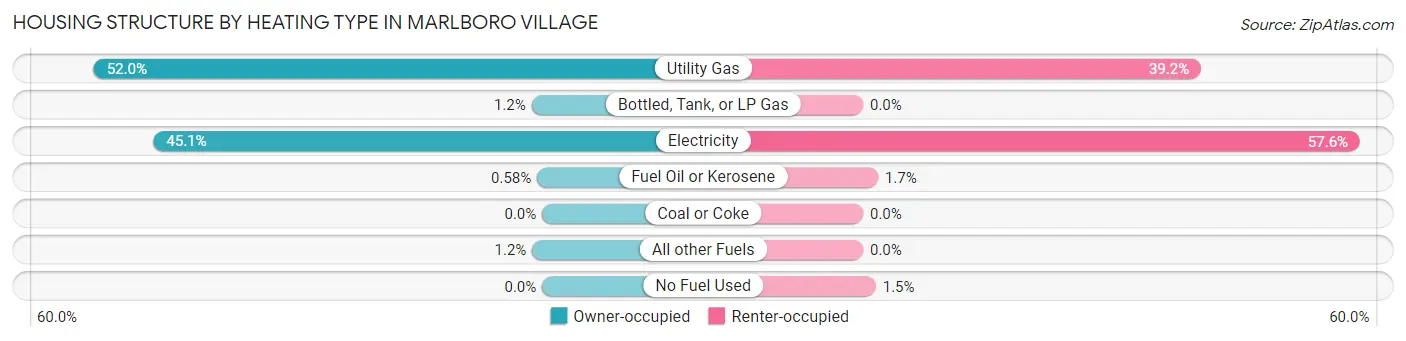
| Heating Type | Owner-occupied | Renter-occupied |
| Utility Gas | 1,444 (52.0%) | 317 (39.2%) |
| Bottled, Tank, or LP Gas | 34 (1.2%) | 0 (0.0%) |
| Electricity | 1,252 (45.1%) | 466 (57.6%) |
| Fuel Oil or Kerosene | 16 (0.6%) | 14 (1.7%) |
| Coal or Coke | 0 (0.0%) | 0 (0.0%) |
| All other Fuels | 32 (1.1%) | 0 (0.0%) |
| No Fuel Used | 0 (0.0%) | 12 (1.5%) |
| Total | 2,778 (100.0%) | 809 (100.0%) |
Household Vehicle Usage in Marlboro Village
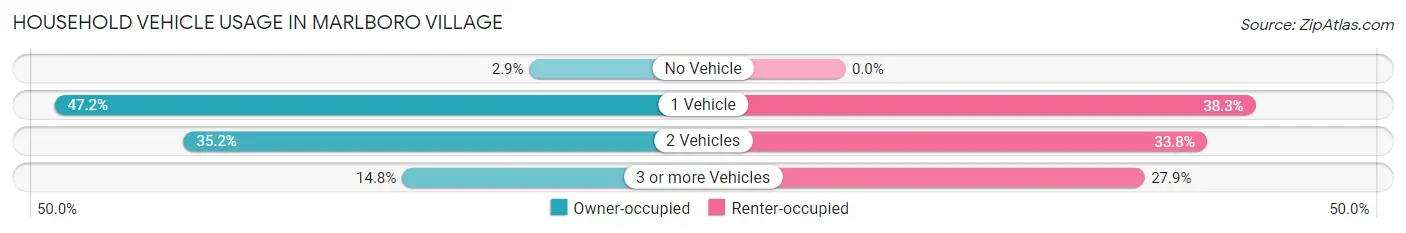
| Vehicles per Household | Owner-occupied | Renter-occupied |
| No Vehicle | 80 (2.9%) | 0 (0.0%) |
| 1 Vehicle | 1,311 (47.2%) | 310 (38.3%) |
| 2 Vehicles | 977 (35.2%) | 273 (33.8%) |
| 3 or more Vehicles | 410 (14.8%) | 226 (27.9%) |
| Total | 2,778 (100.0%) | 809 (100.0%) |
Real Estate & Mortgages in Marlboro Village
Real Estate and Mortgage Overview in Marlboro Village
| Characteristic | Without Mortgage | With Mortgage |
| Housing Units | 353 | 2,425 |
| Median Property Value | $285,400 | $345,700 |
| Median Household Income | $88,750 | $842 |
| Monthly Housing Costs | $845 | $380 |
| Real Estate Taxes | $3,717 | $36 |
Property Value by Mortgage Status in Marlboro Village
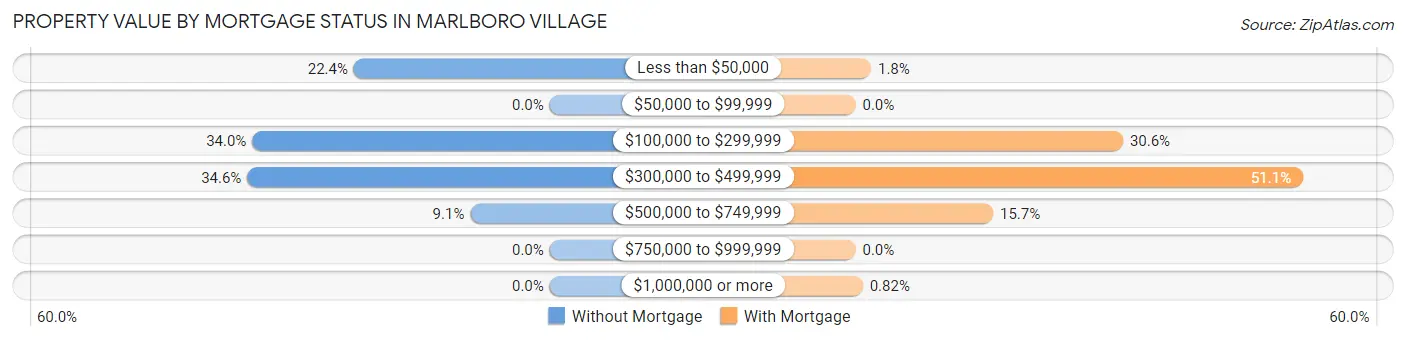
| Property Value | Without Mortgage | With Mortgage |
| Less than $50,000 | 79 (22.4%) | 43 (1.8%) |
| $50,000 to $99,999 | 0 (0.0%) | 0 (0.0%) |
| $100,000 to $299,999 | 120 (34.0%) | 741 (30.6%) |
| $300,000 to $499,999 | 122 (34.6%) | 1,240 (51.1%) |
| $500,000 to $749,999 | 32 (9.1%) | 381 (15.7%) |
| $750,000 to $999,999 | 0 (0.0%) | 0 (0.0%) |
| $1,000,000 or more | 0 (0.0%) | 20 (0.8%) |
| Total | 353 (100.0%) | 2,425 (100.0%) |
Household Income by Mortgage Status in Marlboro Village
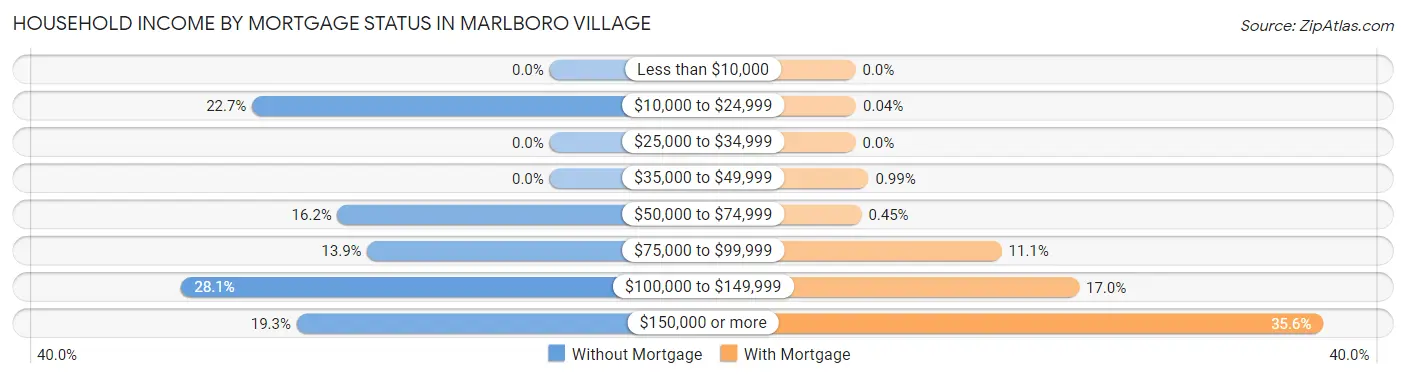
| Household Income | Without Mortgage | With Mortgage |
| Less than $10,000 | 0 (0.0%) | 0 (0.0%) |
| $10,000 to $24,999 | 80 (22.7%) | 1 (0.0%) |
| $25,000 to $34,999 | 0 (0.0%) | 0 (0.0%) |
| $35,000 to $49,999 | 0 (0.0%) | 24 (1.0%) |
| $50,000 to $74,999 | 57 (16.2%) | 11 (0.4%) |
| $75,000 to $99,999 | 49 (13.9%) | 270 (11.1%) |
| $100,000 to $149,999 | 99 (28.1%) | 413 (17.0%) |
| $150,000 or more | 68 (19.3%) | 864 (35.6%) |
| Total | 353 (100.0%) | 2,425 (100.0%) |
Property Value to Household Income Ratio in Marlboro Village
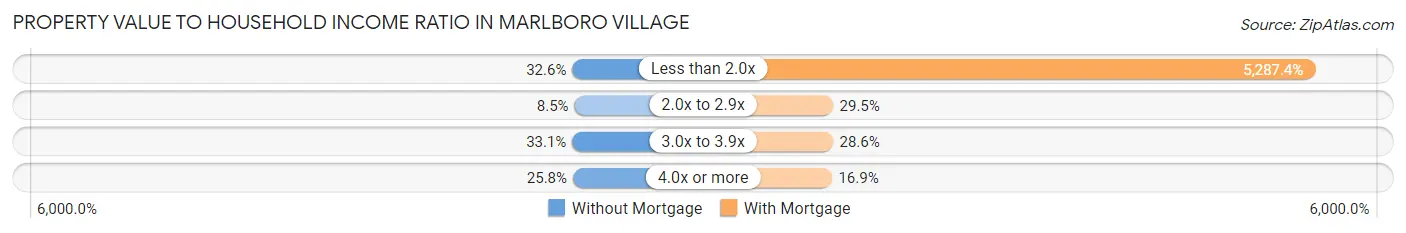
| Value-to-Income Ratio | Without Mortgage | With Mortgage |
| Less than 2.0x | 115 (32.6%) | 128,220 (5,287.4%) |
| 2.0x to 2.9x | 30 (8.5%) | 716 (29.5%) |
| 3.0x to 3.9x | 117 (33.1%) | 694 (28.6%) |
| 4.0x or more | 91 (25.8%) | 409 (16.9%) |
| Total | 353 (100.0%) | 2,425 (100.0%) |
Real Estate Taxes by Mortgage Status in Marlboro Village
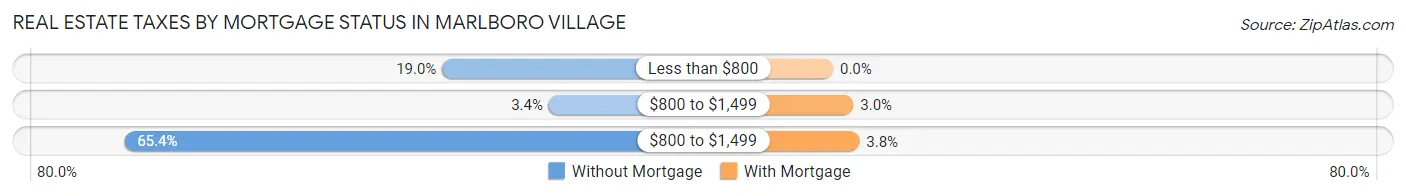
| Property Taxes | Without Mortgage | With Mortgage |
| Less than $800 | 67 (19.0%) | 0 (0.0%) |
| $800 to $1,499 | 12 (3.4%) | 72 (3.0%) |
| $800 to $1,499 | 231 (65.4%) | 93 (3.8%) |
| Total | 353 (100.0%) | 2,425 (100.0%) |
Health & Disability in Marlboro Village
Health Insurance Coverage by Age in Marlboro Village
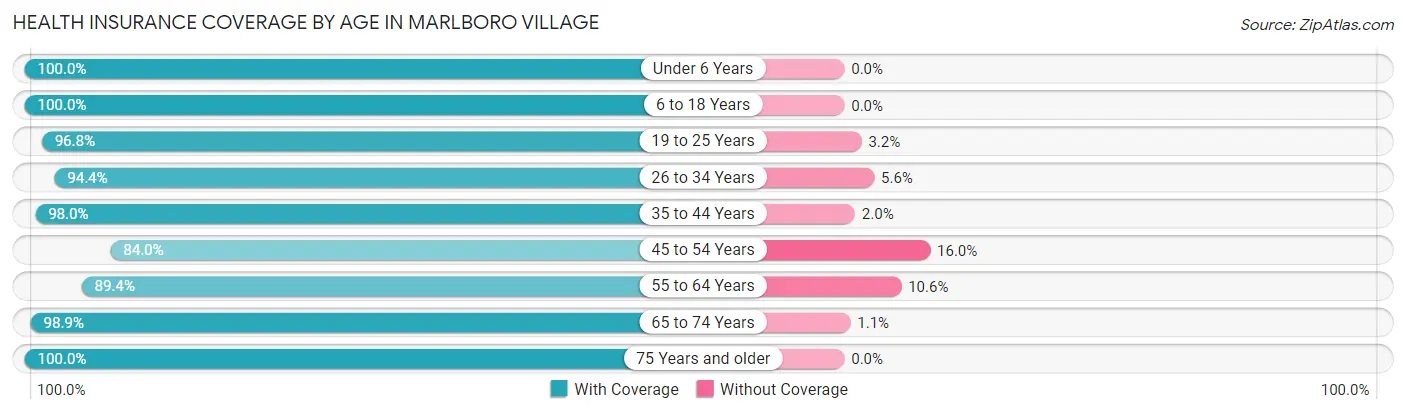
| Age Bracket | With Coverage | Without Coverage |
| Under 6 Years | 433 (100.0%) | 0 (0.0%) |
| 6 to 18 Years | 1,345 (100.0%) | 0 (0.0%) |
| 19 to 25 Years | 635 (96.8%) | 21 (3.2%) |
| 26 to 34 Years | 1,020 (94.4%) | 60 (5.6%) |
| 35 to 44 Years | 1,088 (98.0%) | 22 (2.0%) |
| 45 to 54 Years | 1,260 (84.0%) | 240 (16.0%) |
| 55 to 64 Years | 1,002 (89.4%) | 119 (10.6%) |
| 65 to 74 Years | 875 (98.9%) | 10 (1.1%) |
| 75 Years and older | 207 (100.0%) | 0 (0.0%) |
| Total | 7,865 (94.3%) | 472 (5.7%) |
Health Insurance Coverage by Citizenship Status in Marlboro Village
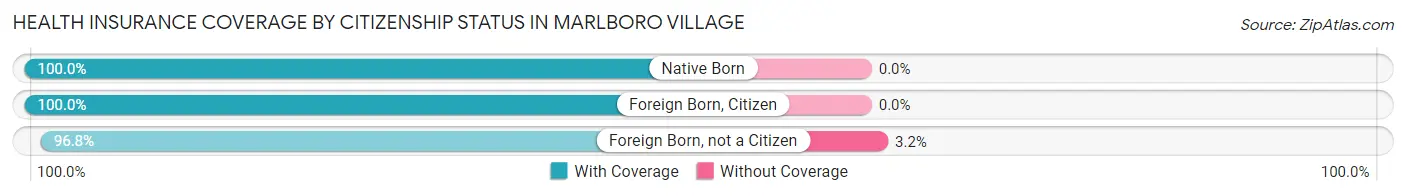
| Citizenship Status | With Coverage | Without Coverage |
| Native Born | 433 (100.0%) | 0 (0.0%) |
| Foreign Born, Citizen | 1,345 (100.0%) | 0 (0.0%) |
| Foreign Born, not a Citizen | 635 (96.8%) | 21 (3.2%) |
Health Insurance Coverage by Household Income in Marlboro Village
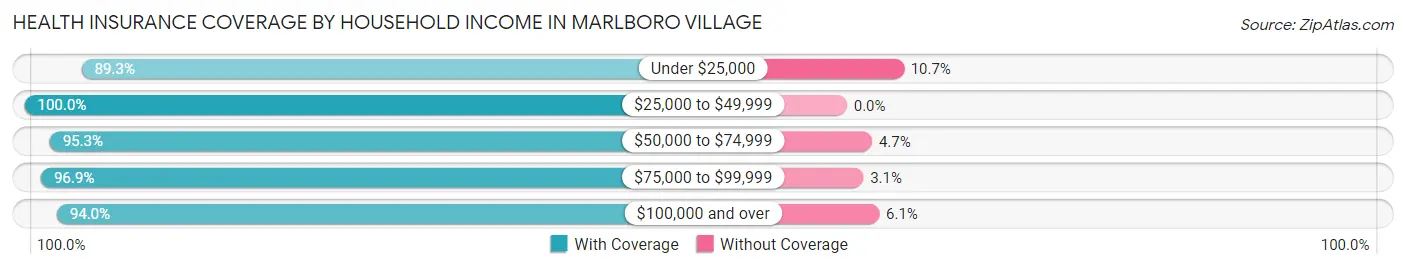
| Household Income | With Coverage | Without Coverage |
| Under $25,000 | 176 (89.3%) | 21 (10.7%) |
| $25,000 to $49,999 | 140 (100.0%) | 0 (0.0%) |
| $50,000 to $74,999 | 890 (95.3%) | 44 (4.7%) |
| $75,000 to $99,999 | 661 (96.9%) | 21 (3.1%) |
| $100,000 and over | 5,998 (94.0%) | 386 (6.0%) |
Public vs Private Health Insurance Coverage by Age in Marlboro Village
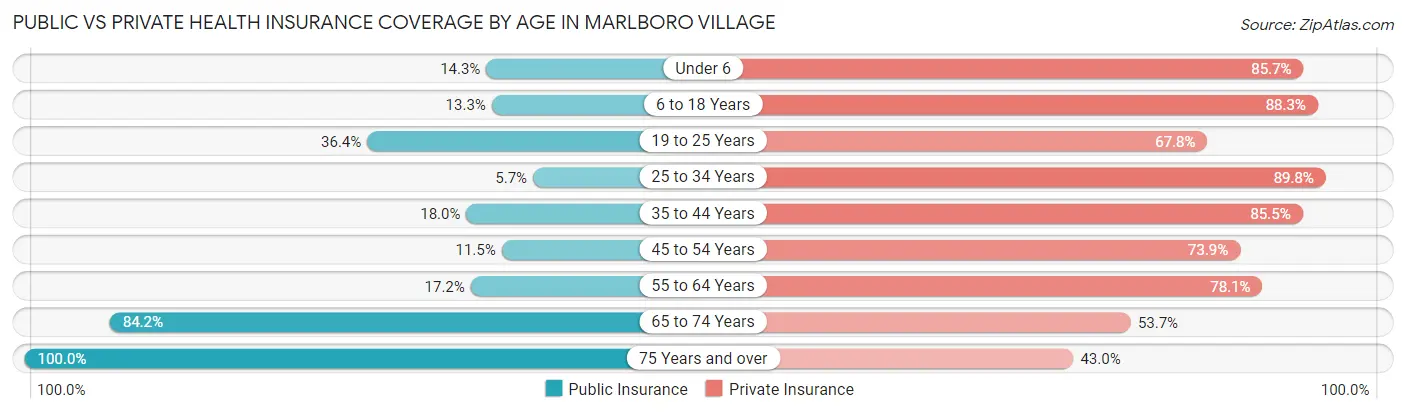
| Age Bracket | Public Insurance | Private Insurance |
| Under 6 | 62 (14.3%) | 371 (85.7%) |
| 6 to 18 Years | 179 (13.3%) | 1,188 (88.3%) |
| 19 to 25 Years | 239 (36.4%) | 445 (67.8%) |
| 25 to 34 Years | 61 (5.7%) | 970 (89.8%) |
| 35 to 44 Years | 200 (18.0%) | 949 (85.5%) |
| 45 to 54 Years | 172 (11.5%) | 1,109 (73.9%) |
| 55 to 64 Years | 193 (17.2%) | 875 (78.1%) |
| 65 to 74 Years | 745 (84.2%) | 475 (53.7%) |
| 75 Years and over | 207 (100.0%) | 89 (43.0%) |
| Total | 2,058 (24.7%) | 6,471 (77.6%) |
Disability Status by Sex by Age in Marlboro Village
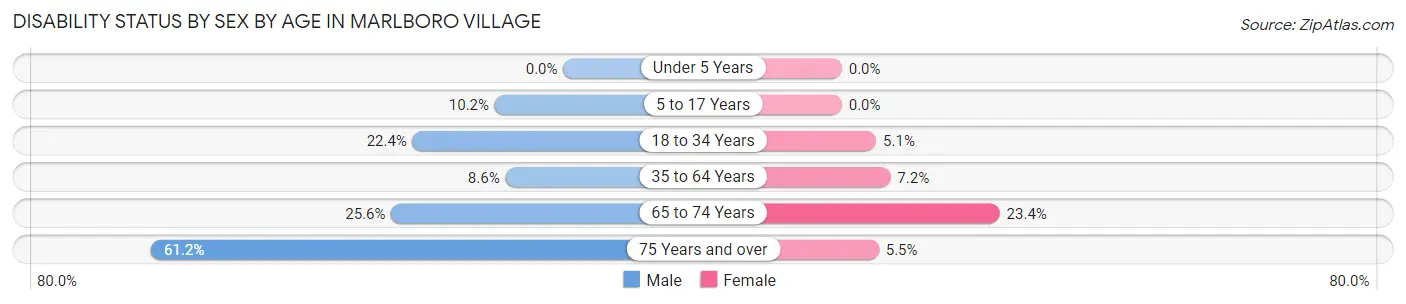
| Age Bracket | Male | Female |
| Under 5 Years | 0 (0.0%) | 0 (0.0%) |
| 5 to 17 Years | 59 (10.2%) | 0 (0.0%) |
| 18 to 34 Years | 230 (22.4%) | 46 (5.1%) |
| 35 to 64 Years | 136 (8.6%) | 155 (7.2%) |
| 65 to 74 Years | 140 (25.6%) | 79 (23.4%) |
| 75 Years and over | 71 (61.2%) | 5 (5.5%) |
Disability Class by Sex by Age in Marlboro Village
Disability Class: Hearing Difficulty
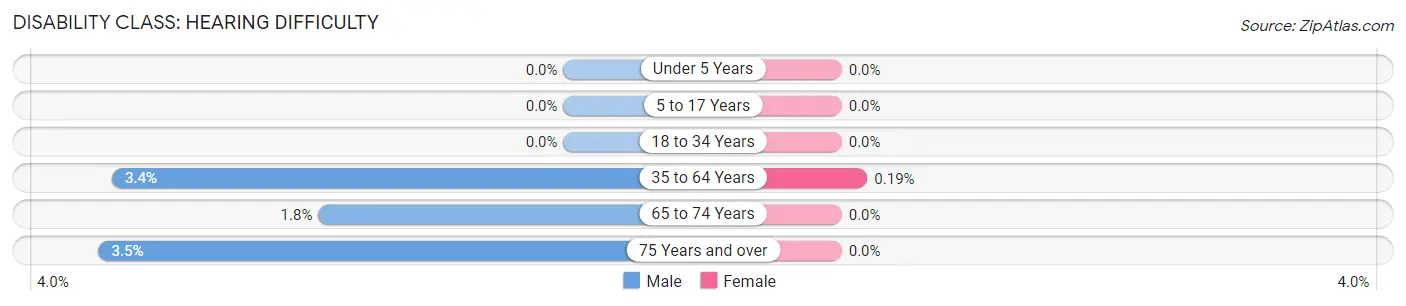
| Age Bracket | Male | Female |
| Under 5 Years | 0 (0.0%) | 0 (0.0%) |
| 5 to 17 Years | 0 (0.0%) | 0 (0.0%) |
| 18 to 34 Years | 0 (0.0%) | 0 (0.0%) |
| 35 to 64 Years | 53 (3.4%) | 4 (0.2%) |
| 65 to 74 Years | 10 (1.8%) | 0 (0.0%) |
| 75 Years and over | 4 (3.5%) | 0 (0.0%) |
Disability Class: Vision Difficulty
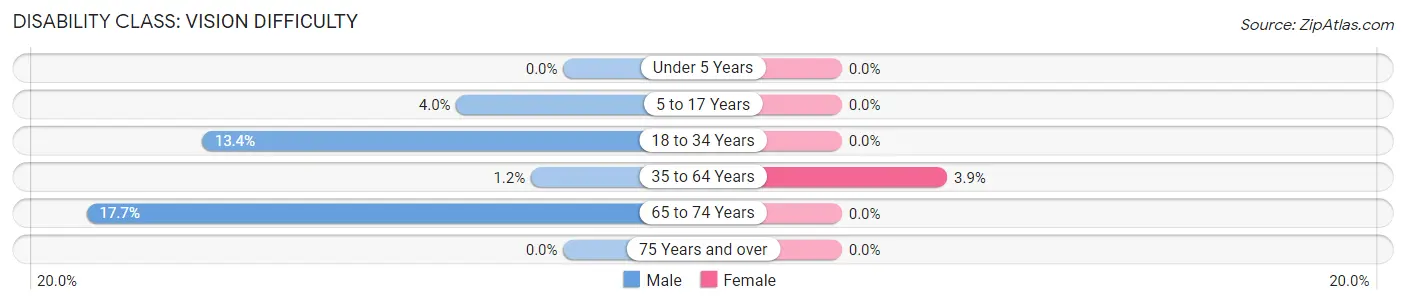
| Age Bracket | Male | Female |
| Under 5 Years | 0 (0.0%) | 0 (0.0%) |
| 5 to 17 Years | 23 (4.0%) | 0 (0.0%) |
| 18 to 34 Years | 138 (13.4%) | 0 (0.0%) |
| 35 to 64 Years | 19 (1.2%) | 84 (3.9%) |
| 65 to 74 Years | 97 (17.7%) | 0 (0.0%) |
| 75 Years and over | 0 (0.0%) | 0 (0.0%) |
Disability Class: Cognitive Difficulty

| Age Bracket | Male | Female |
| 5 to 17 Years | 36 (6.2%) | 0 (0.0%) |
| 18 to 34 Years | 92 (8.9%) | 46 (5.1%) |
| 35 to 64 Years | 25 (1.6%) | 14 (0.6%) |
| 65 to 74 Years | 43 (7.9%) | 0 (0.0%) |
| 75 Years and over | 4 (3.5%) | 5 (5.5%) |
Disability Class: Ambulatory Difficulty
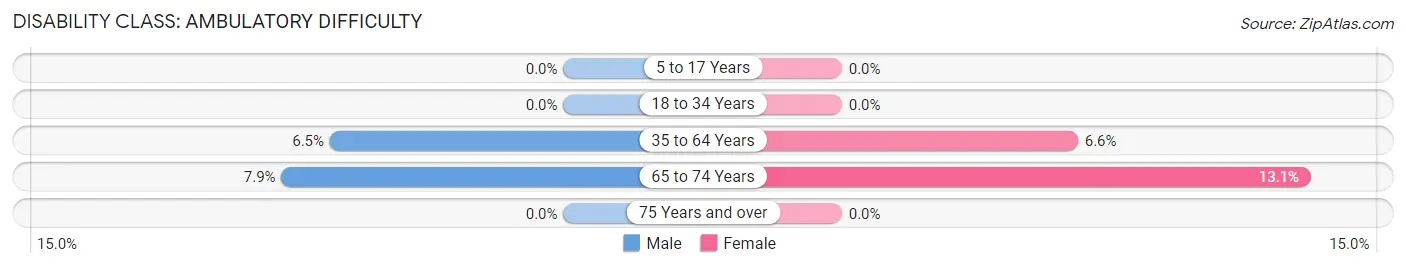
| Age Bracket | Male | Female |
| 5 to 17 Years | 0 (0.0%) | 0 (0.0%) |
| 18 to 34 Years | 0 (0.0%) | 0 (0.0%) |
| 35 to 64 Years | 103 (6.5%) | 141 (6.6%) |
| 65 to 74 Years | 43 (7.9%) | 44 (13.1%) |
| 75 Years and over | 0 (0.0%) | 0 (0.0%) |
Disability Class: Self-Care Difficulty
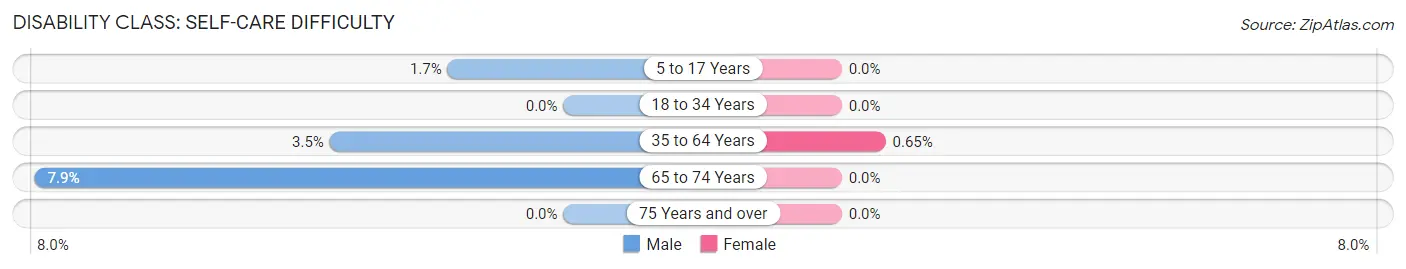
| Age Bracket | Male | Female |
| 5 to 17 Years | 10 (1.7%) | 0 (0.0%) |
| 18 to 34 Years | 0 (0.0%) | 0 (0.0%) |
| 35 to 64 Years | 55 (3.5%) | 14 (0.6%) |
| 65 to 74 Years | 43 (7.9%) | 0 (0.0%) |
| 75 Years and over | 0 (0.0%) | 0 (0.0%) |
Technology Access in Marlboro Village
Computing Device Access in Marlboro Village
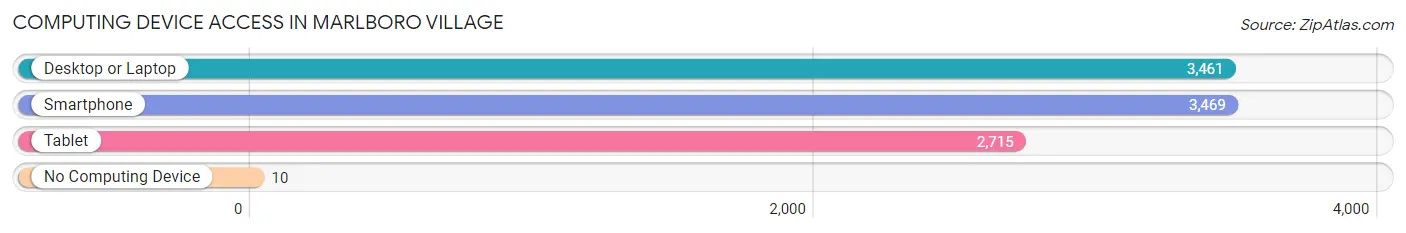
| Device Type | # Households | % Households |
| Desktop or Laptop | 3,461 | 96.5% |
| Smartphone | 3,469 | 96.7% |
| Tablet | 2,715 | 75.7% |
| No Computing Device | 10 | 0.3% |
| Total | 3,587 | 100.0% |
Internet Access in Marlboro Village
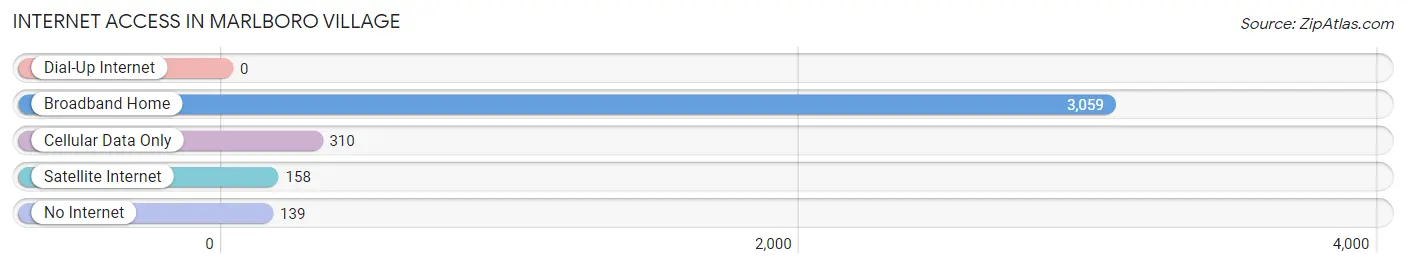
| Internet Type | # Households | % Households |
| Dial-Up Internet | 0 | 0.0% |
| Broadband Home | 3,059 | 85.3% |
| Cellular Data Only | 310 | 8.6% |
| Satellite Internet | 158 | 4.4% |
| No Internet | 139 | 3.9% |
| Total | 3,587 | 100.0% |
Marlboro Village Summary
Marlboro Village is a census-designated place (CDP) located in Prince George’s County, Maryland, United States. The population was 8,845 at the 2010 census. It is located near the intersection of Maryland Route 4 and Maryland Route 301.
History
Marlboro Village was first settled in the late 1700s by a group of Quakers from Pennsylvania. The village was originally known as “Marlborough” and was named after the Duke of Marlborough. The village was incorporated in 1867 and was the first incorporated village in Prince George’s County.
In the early 1900s, the village was a popular summer resort for Washington, D.C. residents. The village was home to several large hotels, including the Marlboro Hotel, which was built in 1891 and was the largest hotel in the county. The hotel was destroyed by fire in 1921.
In the 1950s, the village began to decline as the popularity of summer resorts declined. The village was eventually annexed by the City of Upper Marlboro in 1961.
Geography
Marlboro Village is located at 38 48 17 North 76 45 17 West 38 804722 76 754722
According to the United States Census Bureau, the CDP has a total area of 2.3 square miles (6.0 km2), all of it land.
Economy
Marlboro Village is primarily a residential community. The village is home to several small businesses, including a grocery store, a pharmacy, a gas station, and several restaurants.
Demographics
As of the census of 2000, there were 8,845 people, 3,093 households, and 2,521 families residing in the CDP. The population density was 3,845.3 people per square mile (1,484.2/km2). There were 3,213 housing units at an average density of 1,387.3/sq mi (535.2/km2). The racial makeup of the CDP was 57.45% White, 36.45% African American, 0.20% Native American, 2.45% Asian, 0.03% Pacific Islander, 1.45% from other races, and 2.47% from two or more races. Hispanic or Latino of any race were 3.45% of the population.
There were 3,093 households, out of which 37.2% had children under the age of 18 living with them, 63.2% were married couples living together, 11.2% had a female householder with no husband present, and 21.7% were non-families. 17.2% of all households were made up of individuals, and 5.2% had someone living alone who was 65 years of age or older. The average household size was 2.86 and the average family size was 3.21.
In the CDP, the population was spread out, with 26.2% under the age of 18, 6.7% from 18 to 24, 32.2% from 25 to 44, 24.2% from 45 to 64, and 10.7% who were 65 years of age or older. The median age was 37 years. For every 100 females, there were 93.2 males. For every 100 females age 18 and over, there were 89.7 males.
The median income for a household in the CDP was $71,944, and the median income for a family was $77,944. Males had a median income of $50,000 versus $37,500 for females. The per capita income for the CDP was $27,944. About 2.2% of families and 3.2% of the population were below the poverty line, including 3.7% of those under age 18 and 4.2% of those age 65 or over.
Common Questions
What is Per Capita Income in Marlboro Village?
Per Capita income in Marlboro Village is $53,112.
What is the Median Family Income in Marlboro Village?
Median Family Income in Marlboro Village is $146,875.
What is the Median Household income in Marlboro Village?
Median Household Income in Marlboro Village is $117,700.
What is Income or Wage Gap in Marlboro Village?
Income or Wage Gap in Marlboro Village is 31.9%.
Women in Marlboro Village earn 68.1 cents for every dollar earned by a man.
What is Inequality or Gini Index in Marlboro Village?
Inequality or Gini Index in Marlboro Village is 0.30.
What is the Total Population of Marlboro Village?
Total Population of Marlboro Village is 9,124.
What is the Total Male Population of Marlboro Village?
Total Male Population of Marlboro Village is 4,637.
What is the Total Female Population of Marlboro Village?
Total Female Population of Marlboro Village is 4,487.
What is the Ratio of Males per 100 Females in Marlboro Village?
There are 103.34 Males per 100 Females in Marlboro Village.
What is the Ratio of Females per 100 Males in Marlboro Village?
There are 96.77 Females per 100 Males in Marlboro Village.
What is the Median Population Age in Marlboro Village?
Median Population Age in Marlboro Village is 37.6 Years.
What is the Average Family Size in Marlboro Village
Average Family Size in Marlboro Village is 3.1 People.
What is the Average Household Size in Marlboro Village
Average Household Size in Marlboro Village is 2.3 People.
How Large is the Labor Force in Marlboro Village?
There are 5,402 People in the Labor Forcein in Marlboro Village.
What is the Percentage of People in the Labor Force in Marlboro Village?
69.2% of People are in the Labor Force in Marlboro Village.
What is the Unemployment Rate in Marlboro Village?
Unemployment Rate in Marlboro Village is 5.5%.