Philomath, OR Map & Demographics
Philomath Map
Philomath Overview
$39,415
PER CAPITA INCOME
$89,730
AVG FAMILY INCOME
$80,599
AVG HOUSEHOLD INCOME
19.2%
WAGE / INCOME GAP [ % ]
80.8¢/ $1
WAGE / INCOME GAP [ $ ]
0.38
INEQUALITY / GINI INDEX
5,429
TOTAL POPULATION
2,672
MALE POPULATION
2,757
FEMALE POPULATION
96.92
MALES / 100 FEMALES
103.18
FEMALES / 100 MALES
36.8
MEDIAN AGE
2.9
AVG FAMILY SIZE
2.4
AVG HOUSEHOLD SIZE
3,362
LABOR FORCE [ PEOPLE ]
73.9%
PERCENT IN LABOR FORCE
3.8%
UNEMPLOYMENT RATE
Philomath Zip Codes
Philomath Area Codes
Income in Philomath
Income Overview in Philomath
Per Capita Income in Philomath is $39,415, while median incomes of families and households are $89,730 and $80,599 respectively.
| Characteristic | Number | Measure |
| Per Capita Income | 5,429 | $39,415 |
| Median Family Income | 1,414 | $89,730 |
| Mean Family Income | 1,414 | $100,982 |
| Median Household Income | 2,265 | $80,599 |
| Mean Household Income | 2,265 | $92,466 |
| Income Deficit | 1,414 | $0 |
| Wage / Income Gap (%) | 5,429 | 19.21% |
| Wage / Income Gap ($) | 5,429 | 80.79¢ per $1 |
| Gini / Inequality Index | 5,429 | 0.38 |
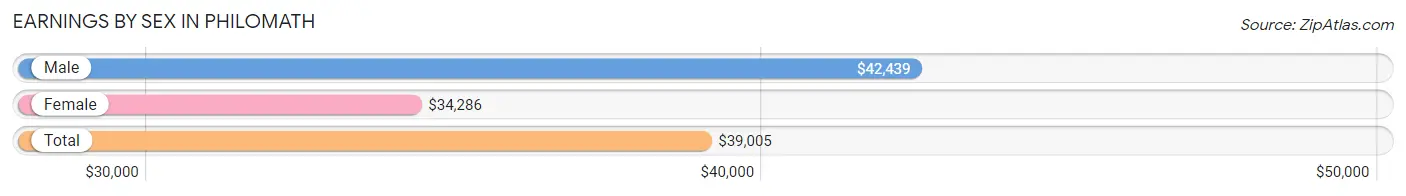
Earnings by Sex in Philomath
Average Earnings in Philomath are $39,005, $42,439 for men and $34,286 for women, a difference of 19.2%.
| Sex | Number | Average Earnings |
| Male | 1,841 (53.0%) | $42,439 |
| Female | 1,634 (47.0%) | $34,286 |
| Total | 3,475 (100.0%) | $39,005 |
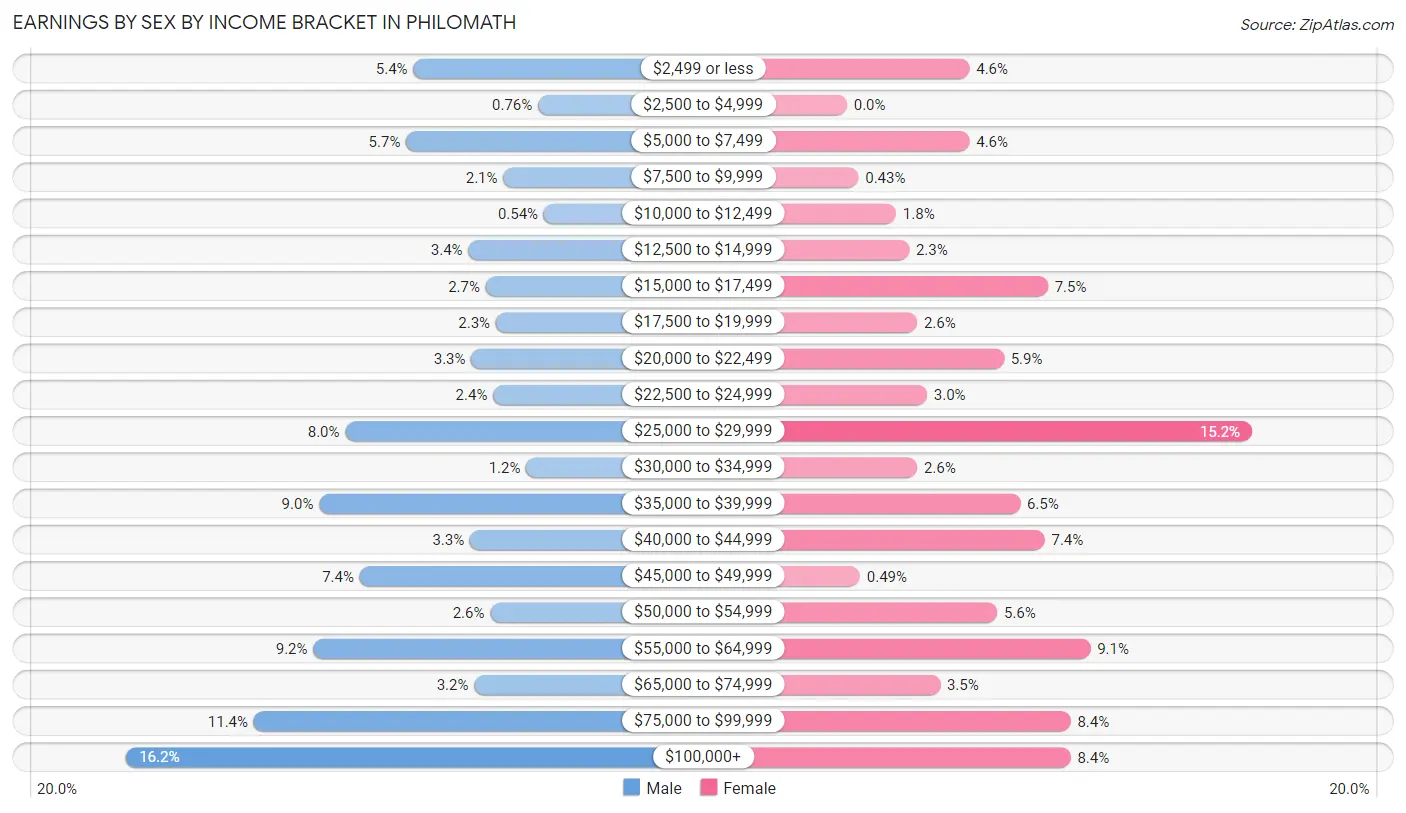
Earnings by Sex by Income Bracket in Philomath
The most common earnings brackets in Philomath are $100,000+ for men (298 | 16.2%) and $25,000 to $29,999 for women (248 | 15.2%).
| Income | Male | Female |
| $2,499 or less | 100 (5.4%) | 75 (4.6%) |
| $2,500 to $4,999 | 14 (0.8%) | 0 (0.0%) |
| $5,000 to $7,499 | 105 (5.7%) | 75 (4.6%) |
| $7,500 to $9,999 | 38 (2.1%) | 7 (0.4%) |
| $10,000 to $12,499 | 10 (0.5%) | 30 (1.8%) |
| $12,500 to $14,999 | 62 (3.4%) | 38 (2.3%) |
| $15,000 to $17,499 | 50 (2.7%) | 123 (7.5%) |
| $17,500 to $19,999 | 43 (2.3%) | 43 (2.6%) |
| $20,000 to $22,499 | 60 (3.3%) | 96 (5.9%) |
| $22,500 to $24,999 | 45 (2.4%) | 49 (3.0%) |
| $25,000 to $29,999 | 147 (8.0%) | 248 (15.2%) |
| $30,000 to $34,999 | 22 (1.2%) | 43 (2.6%) |
| $35,000 to $39,999 | 165 (9.0%) | 106 (6.5%) |
| $40,000 to $44,999 | 61 (3.3%) | 121 (7.4%) |
| $45,000 to $49,999 | 137 (7.4%) | 8 (0.5%) |
| $50,000 to $54,999 | 47 (2.5%) | 92 (5.6%) |
| $55,000 to $64,999 | 169 (9.2%) | 149 (9.1%) |
| $65,000 to $74,999 | 58 (3.2%) | 57 (3.5%) |
| $75,000 to $99,999 | 210 (11.4%) | 137 (8.4%) |
| $100,000+ | 298 (16.2%) | 137 (8.4%) |
| Total | 1,841 (100.0%) | 1,634 (100.0%) |
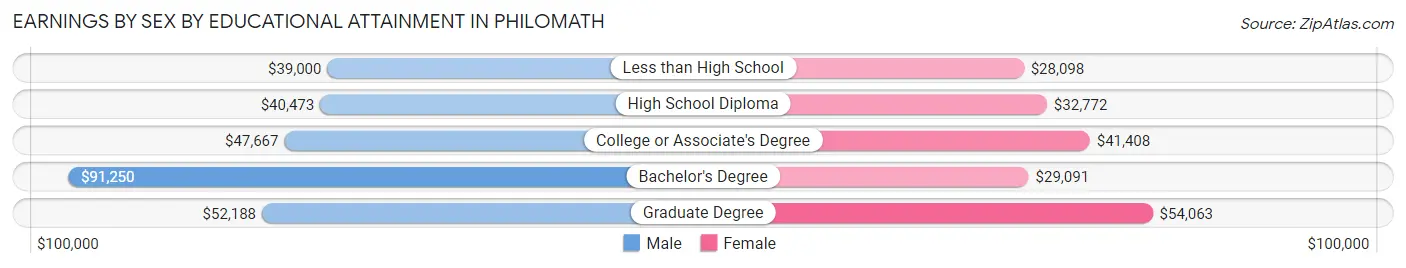
Earnings by Sex by Educational Attainment in Philomath
Average earnings in Philomath are $49,660 for men and $38,634 for women, a difference of 22.2%. Men with an educational attainment of bachelor's degree enjoy the highest average annual earnings of $91,250, while those with less than high school education earn the least with $39,000. Women with an educational attainment of graduate degree earn the most with the average annual earnings of $54,063, while those with less than high school education have the smallest earnings of $28,098.
| Educational Attainment | Male Income | Female Income |
| Less than High School | $39,000 | $28,098 |
| High School Diploma | $40,473 | $32,772 |
| College or Associate's Degree | $47,667 | $41,408 |
| Bachelor's Degree | $91,250 | $29,091 |
| Graduate Degree | $52,188 | $54,063 |
| Total | $49,660 | $38,634 |
Family Income in Philomath
Family Income Brackets in Philomath
According to the Philomath family income data, there are 287 families falling into the $100,000 to $149,999 income range, which is the most common income bracket and makes up 20.3% of all families.

| Income Bracket | # Families | % Families |
| Less than $10,000 | 14 | 1.0% |
| $10,000 to $14,999 | 0 | 0.0% |
| $15,000 to $24,999 | 58 | 4.1% |
| $25,000 to $34,999 | 119 | 8.4% |
| $35,000 to $49,999 | 171 | 12.1% |
| $50,000 to $74,999 | 233 | 16.5% |
| $75,000 to $99,999 | 245 | 17.3% |
| $100,000 to $149,999 | 287 | 20.3% |
| $150,000 to $199,999 | 185 | 13.1% |
| $200,000+ | 103 | 7.3% |
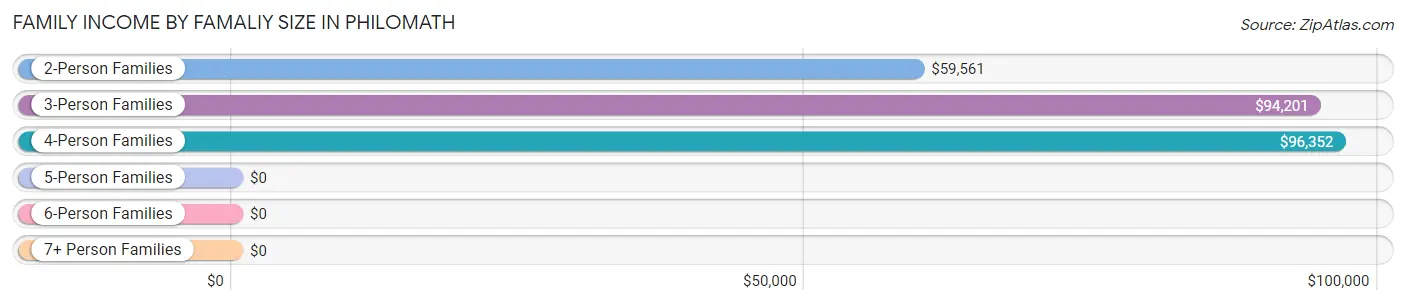
Family Income by Famaliy Size in Philomath
4-person families (285 | 20.2%) account for the highest median family income in Philomath with $96,352 per family, while 3-person families (251 | 17.7%) have the highest median income of $31,400 per family member.
| Income Bracket | # Families | Median Income |
| 2-Person Families | 788 (55.7%) | $59,561 |
| 3-Person Families | 251 (17.7%) | $94,201 |
| 4-Person Families | 285 (20.2%) | $96,352 |
| 5-Person Families | 52 (3.7%) | $0 |
| 6-Person Families | 21 (1.5%) | $0 |
| 7+ Person Families | 17 (1.2%) | $0 |
| Total | 1,414 (100.0%) | $89,730 |
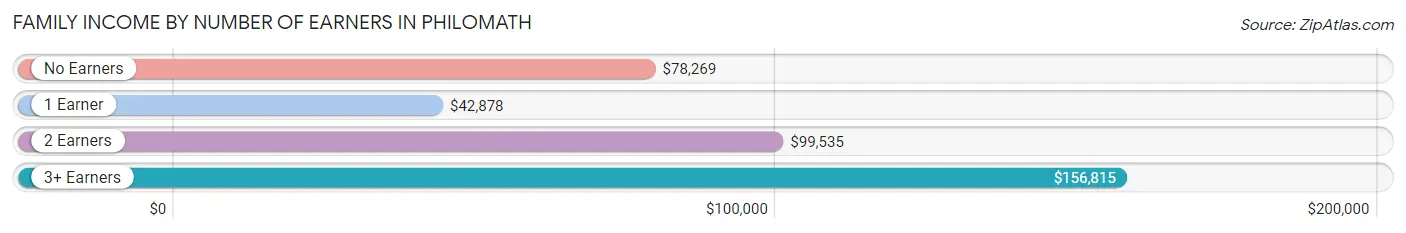
Family Income by Number of Earners in Philomath
The median family income in Philomath is $89,730, with families comprising 3+ earners (163) having the highest median family income of $156,815, while families with 1 earner (499) have the lowest median family income of $42,878, accounting for 11.5% and 35.3% of families, respectively.
| Number of Earners | # Families | Median Income |
| No Earners | 74 (5.2%) | $78,269 |
| 1 Earner | 499 (35.3%) | $42,878 |
| 2 Earners | 678 (47.9%) | $99,535 |
| 3+ Earners | 163 (11.5%) | $156,815 |
| Total | 1,414 (100.0%) | $89,730 |
Household Income in Philomath
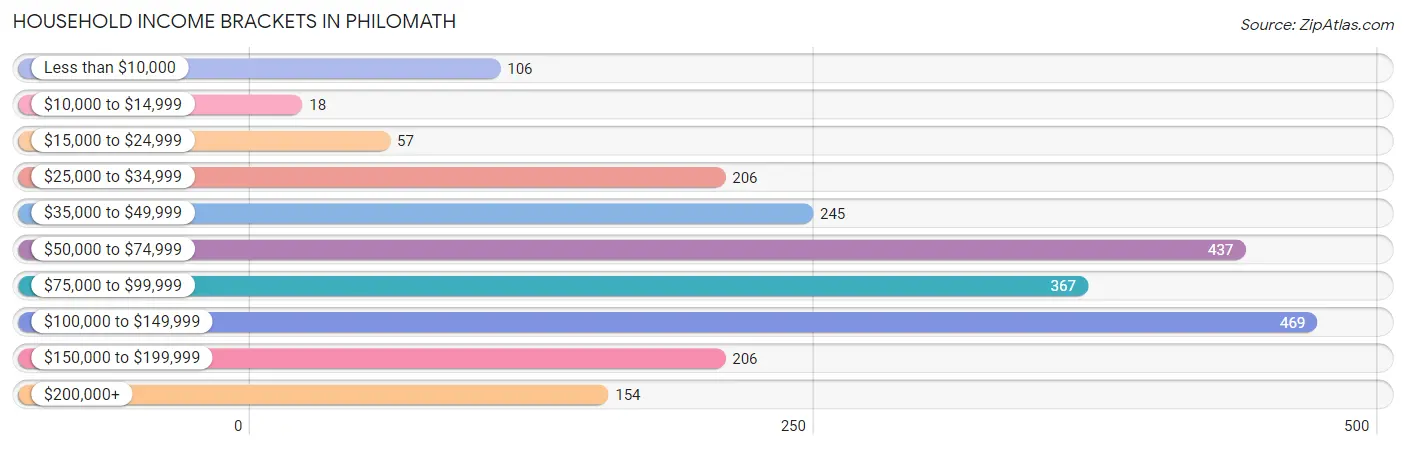
Household Income Brackets in Philomath
With 469 households falling in the category, the $100,000 to $149,999 income range is the most frequent in Philomath, accounting for 20.7% of all households. In contrast, only 18 households (0.8%) fall into the $10,000 to $14,999 income bracket, making it the least populous group.
| Income Bracket | # Households | % Households |
| Less than $10,000 | 106 | 4.7% |
| $10,000 to $14,999 | 18 | 0.8% |
| $15,000 to $24,999 | 57 | 2.5% |
| $25,000 to $34,999 | 206 | 9.1% |
| $35,000 to $49,999 | 245 | 10.8% |
| $50,000 to $74,999 | 437 | 19.3% |
| $75,000 to $99,999 | 367 | 16.2% |
| $100,000 to $149,999 | 469 | 20.7% |
| $150,000 to $199,999 | 206 | 9.1% |
| $200,000+ | 154 | 6.8% |
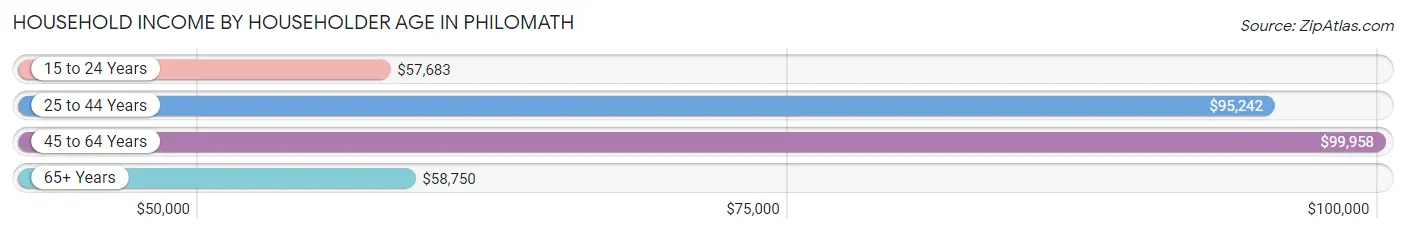
Household Income by Householder Age in Philomath
The median household income in Philomath is $80,599, with the highest median household income of $99,958 found in the 45 to 64 years age bracket for the primary householder. A total of 667 households (29.4%) fall into this category. Meanwhile, the 15 to 24 years age bracket for the primary householder has the lowest median household income of $57,683, with 190 households (8.4%) in this group.
| Income Bracket | # Households | Median Income |
| 15 to 24 Years | 190 (8.4%) | $57,683 |
| 25 to 44 Years | 826 (36.5%) | $95,242 |
| 45 to 64 Years | 667 (29.4%) | $99,958 |
| 65+ Years | 582 (25.7%) | $58,750 |
| Total | 2,265 (100.0%) | $80,599 |
Poverty in Philomath
Income Below Poverty by Sex and Age in Philomath
With 4.8% poverty level for males and 5.8% for females among the residents of Philomath, 5 year old males and 15 year old females are the most vulnerable to poverty, with 9 males (100.0%) and 19 females (21.1%) in their respective age groups living below the poverty level.
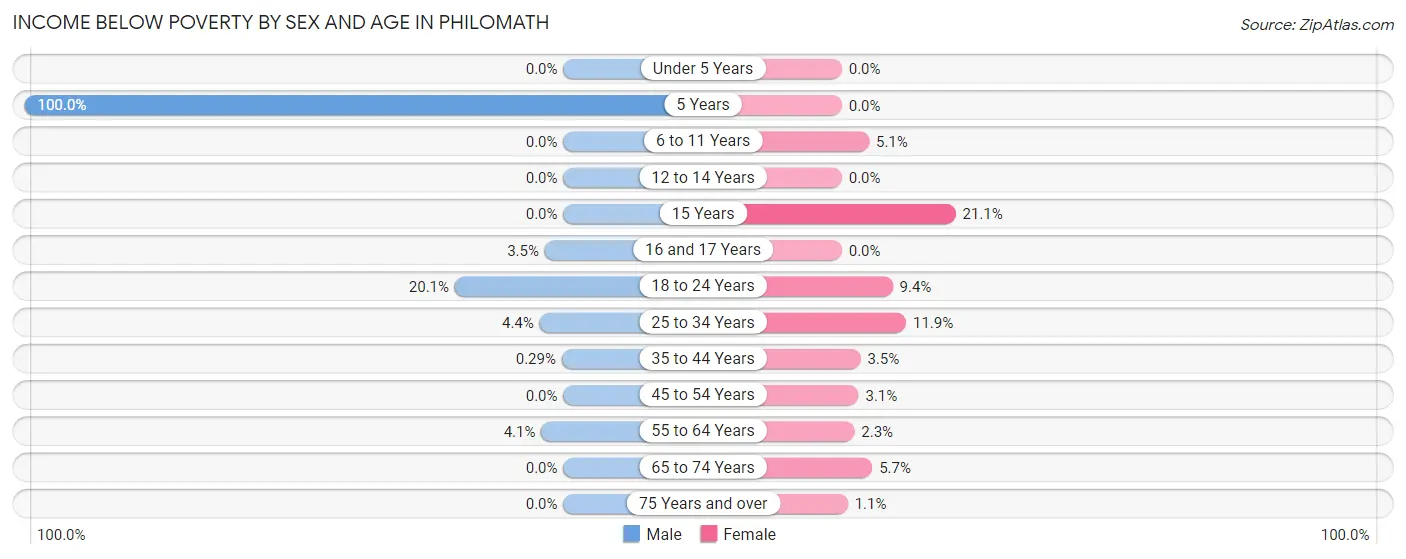
| Age Bracket | Male | Female |
| Under 5 Years | 0 (0.0%) | 0 (0.0%) |
| 5 Years | 9 (100.0%) | 0 (0.0%) |
| 6 to 11 Years | 0 (0.0%) | 8 (5.1%) |
| 12 to 14 Years | 0 (0.0%) | 0 (0.0%) |
| 15 Years | 0 (0.0%) | 19 (21.1%) |
| 16 and 17 Years | 1 (3.5%) | 0 (0.0%) |
| 18 to 24 Years | 88 (20.1%) | 23 (9.4%) |
| 25 to 34 Years | 19 (4.4%) | 58 (11.9%) |
| 35 to 44 Years | 1 (0.3%) | 14 (3.5%) |
| 45 to 54 Years | 0 (0.0%) | 10 (3.1%) |
| 55 to 64 Years | 10 (4.1%) | 8 (2.3%) |
| 65 to 74 Years | 0 (0.0%) | 19 (5.7%) |
| 75 Years and over | 0 (0.0%) | 1 (1.1%) |
| Total | 128 (4.8%) | 160 (5.8%) |
Income Above Poverty by Sex and Age in Philomath
According to the poverty statistics in Philomath, males aged under 5 years and females aged under 5 years are the age groups that are most secure financially, with 100.0% of males and 100.0% of females in these age groups living above the poverty line.
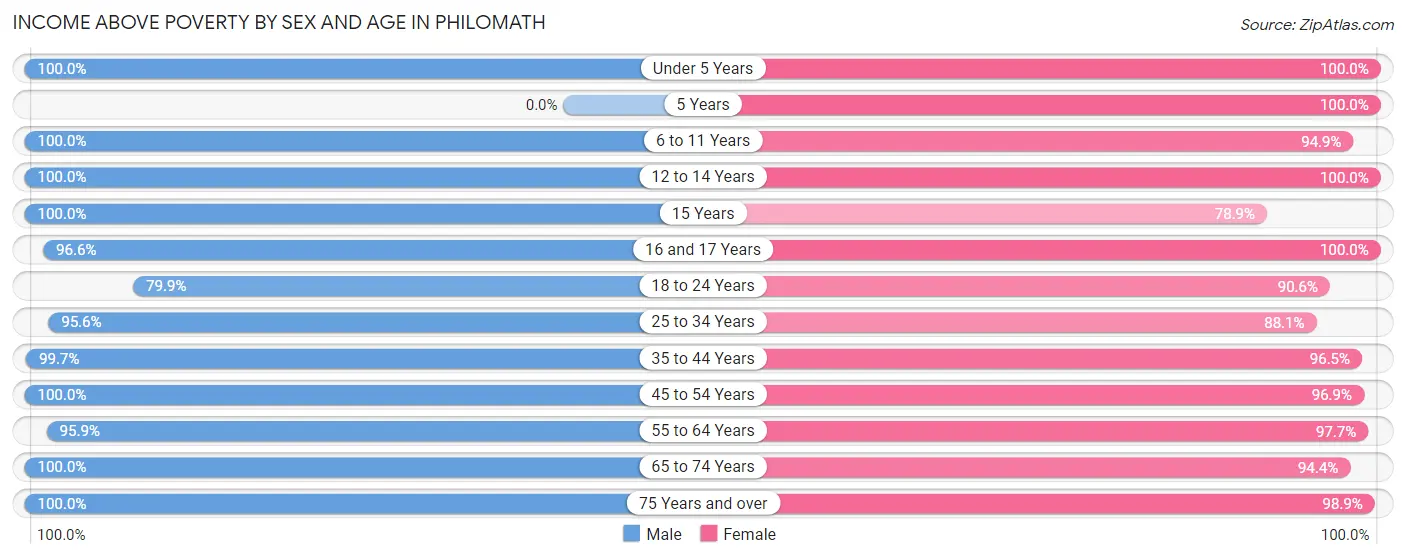
| Age Bracket | Male | Female |
| Under 5 Years | 104 (100.0%) | 86 (100.0%) |
| 5 Years | 0 (0.0%) | 44 (100.0%) |
| 6 to 11 Years | 136 (100.0%) | 150 (94.9%) |
| 12 to 14 Years | 88 (100.0%) | 81 (100.0%) |
| 15 Years | 62 (100.0%) | 71 (78.9%) |
| 16 and 17 Years | 28 (96.6%) | 72 (100.0%) |
| 18 to 24 Years | 349 (79.9%) | 221 (90.6%) |
| 25 to 34 Years | 412 (95.6%) | 428 (88.1%) |
| 35 to 44 Years | 339 (99.7%) | 390 (96.5%) |
| 45 to 54 Years | 315 (100.0%) | 312 (96.9%) |
| 55 to 64 Years | 234 (95.9%) | 335 (97.7%) |
| 65 to 74 Years | 371 (100.0%) | 317 (94.4%) |
| 75 Years and over | 76 (100.0%) | 90 (98.9%) |
| Total | 2,514 (95.2%) | 2,597 (94.2%) |
Income Below Poverty Among Married-Couple Families in Philomath
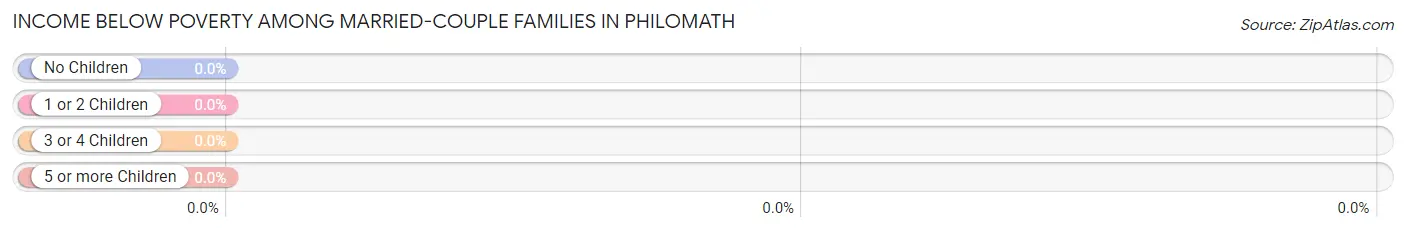
| Children | Above Poverty | Below Poverty |
| No Children | 731 (100.0%) | 0 (0.0%) |
| 1 or 2 Children | 304 (100.0%) | 0 (0.0%) |
| 3 or 4 Children | 35 (100.0%) | 0 (0.0%) |
| 5 or more Children | 17 (100.0%) | 0 (0.0%) |
| Total | 1,087 (100.0%) | 0 (0.0%) |
Income Below Poverty Among Single-Parent Households in Philomath
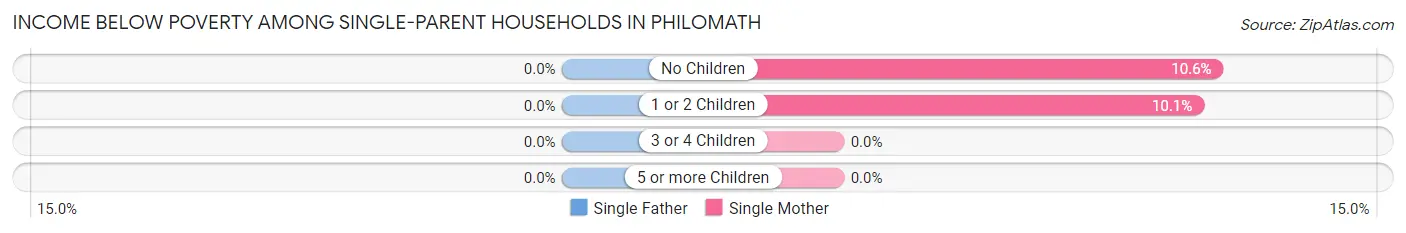
| Children | Single Father | Single Mother |
| No Children | 0 (0.0%) | 14 (10.6%) |
| 1 or 2 Children | 0 (0.0%) | 15 (10.1%) |
| 3 or 4 Children | 0 (0.0%) | 0 (0.0%) |
| 5 or more Children | 0 (0.0%) | 0 (0.0%) |
| Total | 0 (0.0%) | 29 (10.3%) |
Income Below Poverty Among Married-Couple vs Single-Parent Households in Philomath
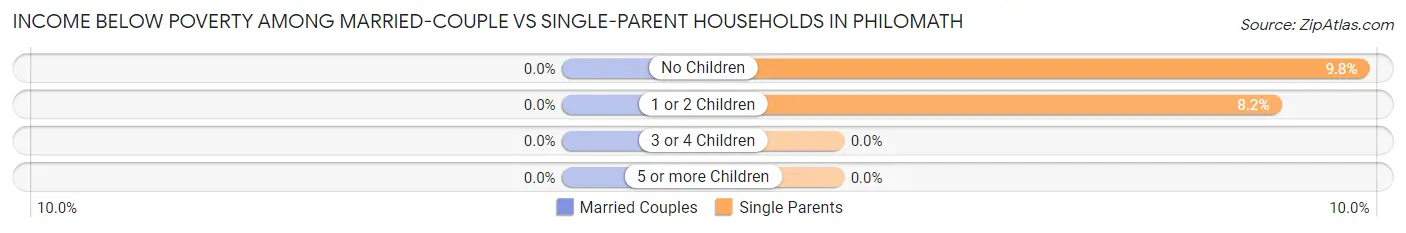
| Children | Married-Couple Families | Single-Parent Households |
| No Children | 0 (0.0%) | 14 (9.8%) |
| 1 or 2 Children | 0 (0.0%) | 15 (8.2%) |
| 3 or 4 Children | 0 (0.0%) | 0 (0.0%) |
| 5 or more Children | 0 (0.0%) | 0 (0.0%) |
| Total | 0 (0.0%) | 29 (8.9%) |
Race in Philomath
The most populous races in Philomath are White / Caucasian (4,859 | 89.5%), Two or more Races (253 | 4.7%), and Hispanic or Latino (199 | 3.7%).
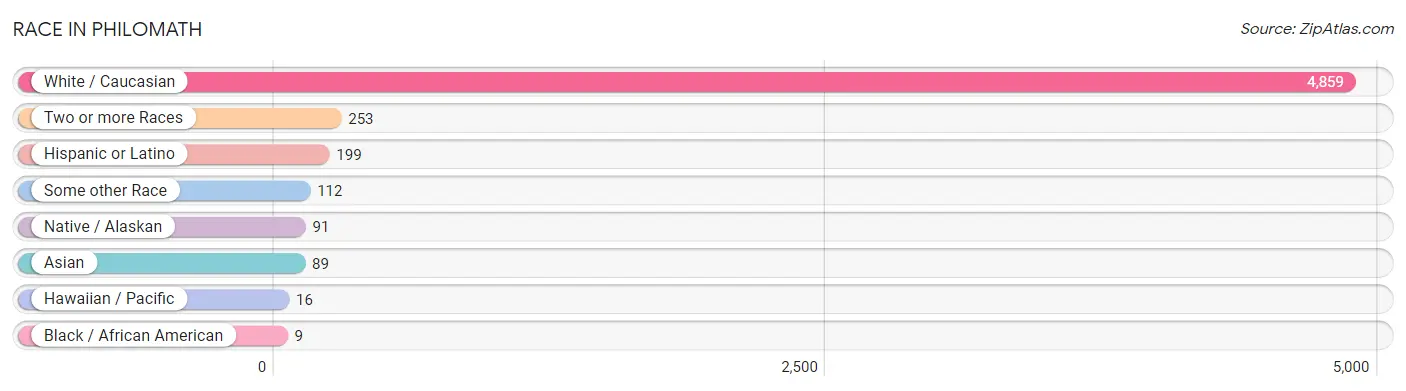
| Race | # Population | % Population |
| Asian | 89 | 1.6% |
| Black / African American | 9 | 0.2% |
| Hawaiian / Pacific | 16 | 0.3% |
| Hispanic or Latino | 199 | 3.7% |
| Native / Alaskan | 91 | 1.7% |
| White / Caucasian | 4,859 | 89.5% |
| Two or more Races | 253 | 4.7% |
| Some other Race | 112 | 2.1% |
| Total | 5,429 | 100.0% |
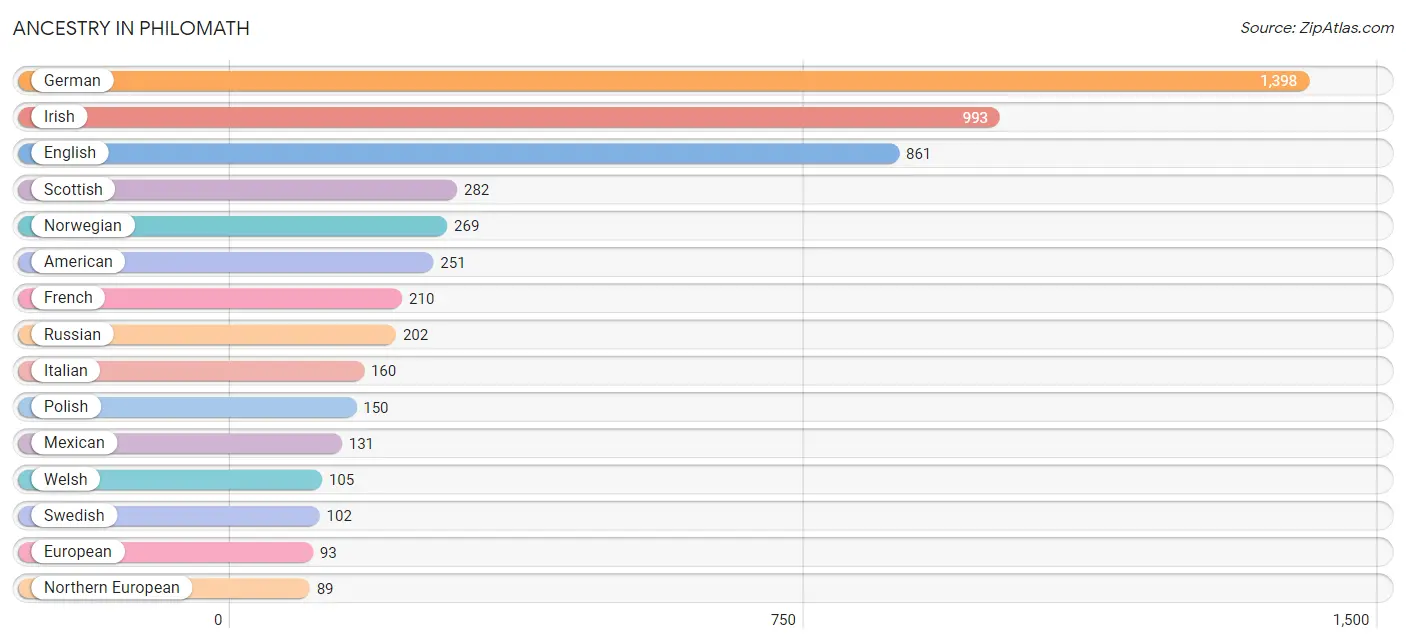
Ancestry in Philomath
The most populous ancestries reported in Philomath are German (1,398 | 25.8%), Irish (993 | 18.3%), English (861 | 15.9%), Scottish (282 | 5.2%), and Norwegian (269 | 5.0%), together accounting for 70.0% of all Philomath residents.
| Ancestry | # Population | % Population |
| American | 251 | 4.6% |
| Apache | 17 | 0.3% |
| Argentinean | 1 | 0.0% |
| Austrian | 15 | 0.3% |
| Blackfeet | 16 | 0.3% |
| British | 52 | 1.0% |
| Celtic | 12 | 0.2% |
| Central American | 13 | 0.2% |
| Cherokee | 53 | 1.0% |
| Cuban | 10 | 0.2% |
| Czech | 23 | 0.4% |
| Czechoslovakian | 12 | 0.2% |
| Dominican | 19 | 0.4% |
| Dutch | 50 | 0.9% |
| Eastern European | 11 | 0.2% |
| English | 861 | 15.9% |
| European | 93 | 1.7% |
| Finnish | 29 | 0.5% |
| French | 210 | 3.9% |
| French Canadian | 24 | 0.4% |
| German | 1,398 | 25.8% |
| Greek | 32 | 0.6% |
| Guatemalan | 13 | 0.2% |
| Hungarian | 69 | 1.3% |
| Indian (Asian) | 73 | 1.3% |
| Inupiat | 25 | 0.5% |
| Irish | 993 | 18.3% |
| Italian | 160 | 2.9% |
| Kiowa | 7 | 0.1% |
| Korean | 42 | 0.8% |
| Luxembourger | 12 | 0.2% |
| Mexican | 131 | 2.4% |
| Mexican American Indian | 7 | 0.1% |
| Native Hawaiian | 32 | 0.6% |
| Northern European | 89 | 1.6% |
| Norwegian | 269 | 5.0% |
| Pakistani | 41 | 0.8% |
| Peruvian | 23 | 0.4% |
| Polish | 150 | 2.8% |
| Portuguese | 38 | 0.7% |
| Romanian | 14 | 0.3% |
| Russian | 202 | 3.7% |
| Scandinavian | 46 | 0.9% |
| Scotch-Irish | 46 | 0.9% |
| Scottish | 282 | 5.2% |
| Shoshone | 25 | 0.5% |
| Sioux | 18 | 0.3% |
| South American | 24 | 0.4% |
| Spaniard | 1 | 0.0% |
| Sri Lankan | 14 | 0.3% |
| Swedish | 102 | 1.9% |
| Swiss | 49 | 0.9% |
| Turkish | 69 | 1.3% |
| Welsh | 105 | 1.9% |
| Yakama | 19 | 0.4% |
| Yup'ik | 25 | 0.5% | View All 56 Rows |
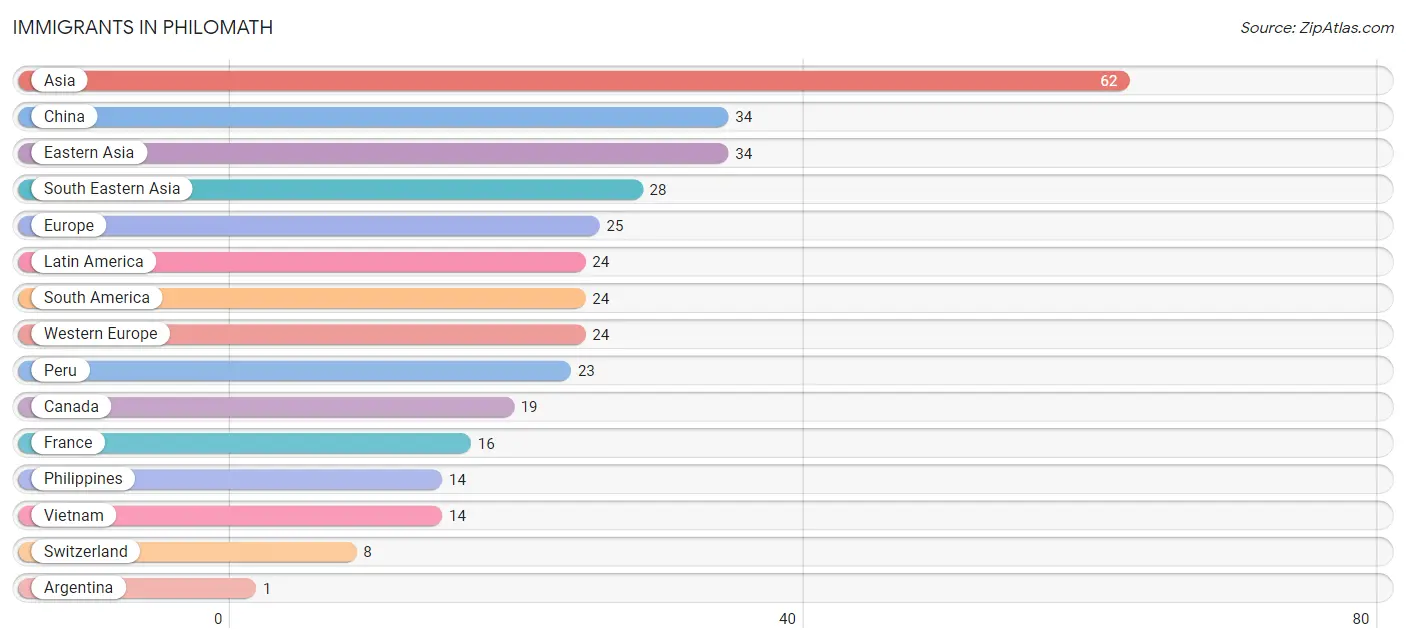
Immigrants in Philomath
The most numerous immigrant groups reported in Philomath came from Asia (62 | 1.1%), China (34 | 0.6%), Eastern Asia (34 | 0.6%), South Eastern Asia (28 | 0.5%), and Europe (25 | 0.5%), together accounting for 3.4% of all Philomath residents.
| Immigration Origin | # Population | % Population |
| Argentina | 1 | 0.0% |
| Asia | 62 | 1.1% |
| Canada | 19 | 0.4% |
| China | 34 | 0.6% |
| Eastern Asia | 34 | 0.6% |
| Eastern Europe | 1 | 0.0% |
| Europe | 25 | 0.5% |
| France | 16 | 0.3% |
| Latin America | 24 | 0.4% |
| Peru | 23 | 0.4% |
| Philippines | 14 | 0.3% |
| Russia | 1 | 0.0% |
| South America | 24 | 0.4% |
| South Eastern Asia | 28 | 0.5% |
| Switzerland | 8 | 0.2% |
| Vietnam | 14 | 0.3% |
| Western Europe | 24 | 0.4% | View All 17 Rows |
Sex and Age in Philomath
Sex and Age in Philomath
The most populous age groups in Philomath are 20 to 24 Years (351 | 13.1%) for men and 25 to 29 Years (376 | 13.6%) for women.
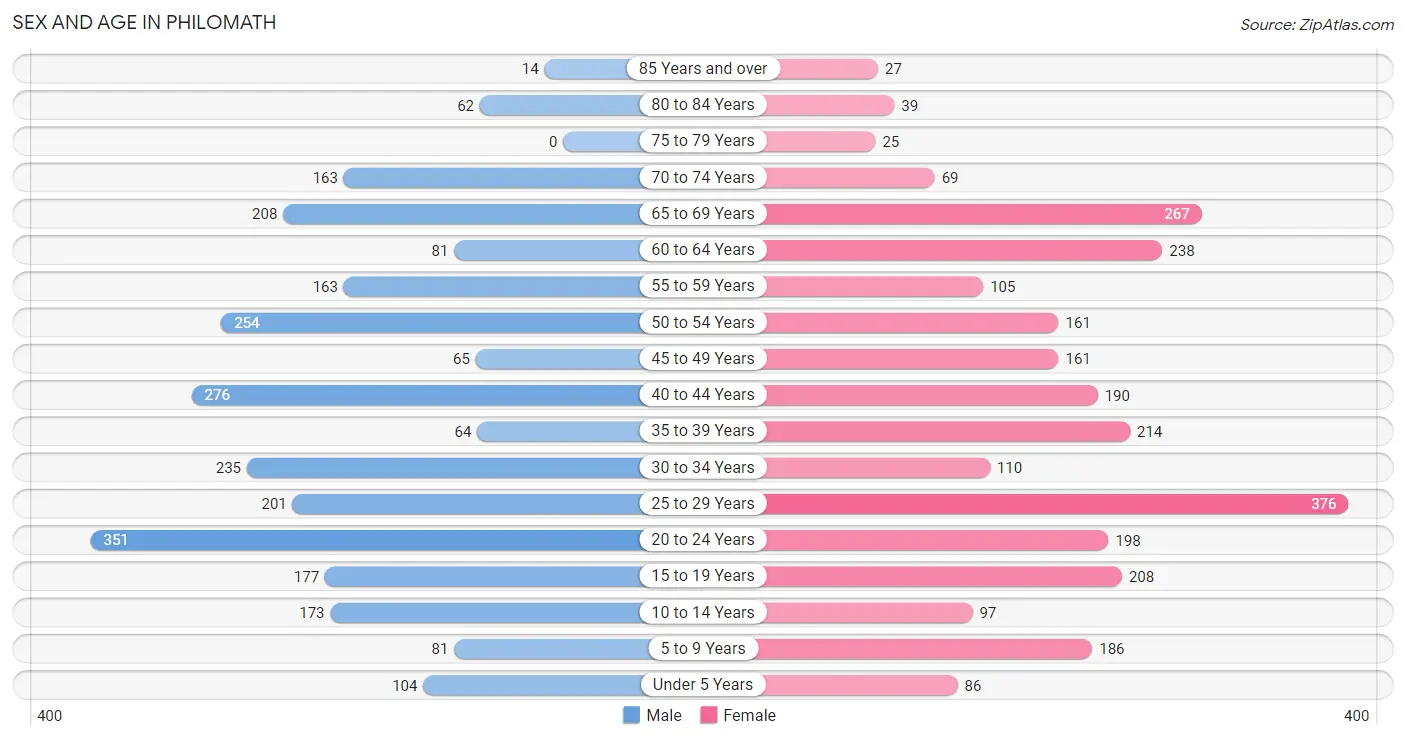
| Age Bracket | Male | Female |
| Under 5 Years | 104 (3.9%) | 86 (3.1%) |
| 5 to 9 Years | 81 (3.0%) | 186 (6.8%) |
| 10 to 14 Years | 173 (6.5%) | 97 (3.5%) |
| 15 to 19 Years | 177 (6.6%) | 208 (7.5%) |
| 20 to 24 Years | 351 (13.1%) | 198 (7.2%) |
| 25 to 29 Years | 201 (7.5%) | 376 (13.6%) |
| 30 to 34 Years | 235 (8.8%) | 110 (4.0%) |
| 35 to 39 Years | 64 (2.4%) | 214 (7.8%) |
| 40 to 44 Years | 276 (10.3%) | 190 (6.9%) |
| 45 to 49 Years | 65 (2.4%) | 161 (5.8%) |
| 50 to 54 Years | 254 (9.5%) | 161 (5.8%) |
| 55 to 59 Years | 163 (6.1%) | 105 (3.8%) |
| 60 to 64 Years | 81 (3.0%) | 238 (8.6%) |
| 65 to 69 Years | 208 (7.8%) | 267 (9.7%) |
| 70 to 74 Years | 163 (6.1%) | 69 (2.5%) |
| 75 to 79 Years | 0 (0.0%) | 25 (0.9%) |
| 80 to 84 Years | 62 (2.3%) | 39 (1.4%) |
| 85 Years and over | 14 (0.5%) | 27 (1.0%) |
| Total | 2,672 (100.0%) | 2,757 (100.0%) |
Families and Households in Philomath
Median Family Size in Philomath
The median family size in Philomath is 2.89 persons per family, with married-couple families (1,087 | 76.9%) accounting for the largest median family size of 2.99 persons per family. On the other hand, single male/father families (46 | 3.3%) represent the smallest median family size with 2.20 persons per family.
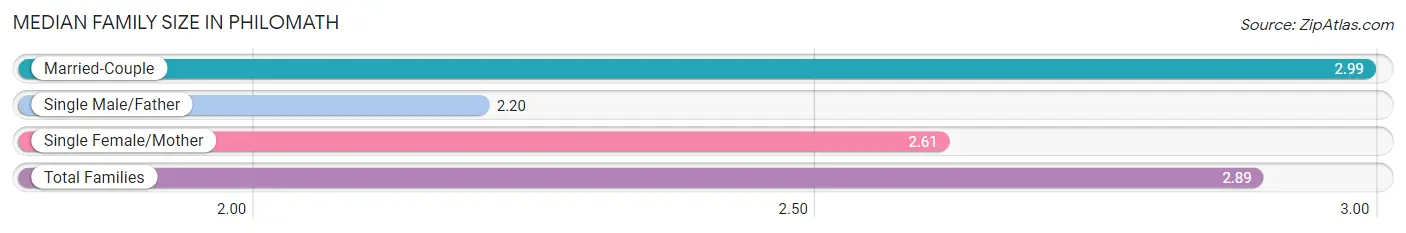
| Family Type | # Families | Family Size |
| Married-Couple | 1,087 (76.9%) | 2.99 |
| Single Male/Father | 46 (3.3%) | 2.20 |
| Single Female/Mother | 281 (19.9%) | 2.61 |
| Total Families | 1,414 (100.0%) | 2.89 |
Median Household Size in Philomath
The median household size in Philomath is 2.39 persons per household, with married-couple households (1,087 | 48.0%) accounting for the largest median household size of 3.03 persons per household. non-family households (851 | 37.6%) represent the smallest median household size with 1.41 persons per household.
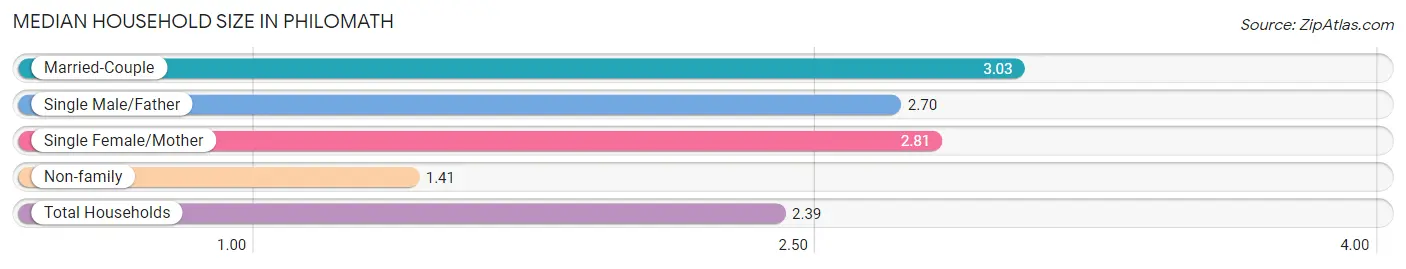
| Household Type | # Households | Household Size |
| Married-Couple | 1,087 (48.0%) | 3.03 |
| Single Male/Father | 46 (2.0%) | 2.70 |
| Single Female/Mother | 281 (12.4%) | 2.81 |
| Non-family | 851 (37.6%) | 1.41 |
| Total Households | 2,265 (100.0%) | 2.39 |
Household Size by Marriage Status in Philomath
Out of a total of 2,265 households in Philomath, 1,414 (62.4%) are family households, while 851 (37.6%) are nonfamily households. The most numerous type of family households are 2-person households, comprising 743, and the most common type of nonfamily households are 1-person households, comprising 613.
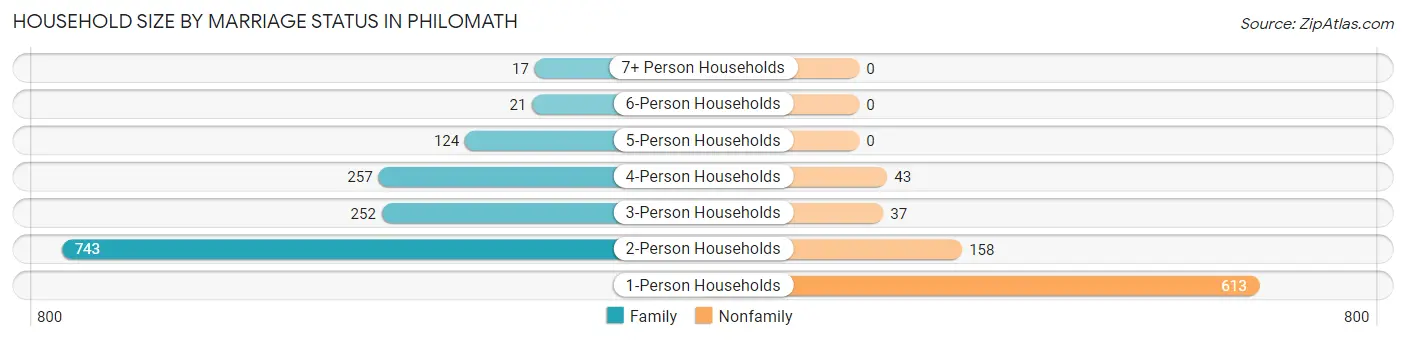
| Household Size | Family Households | Nonfamily Households |
| 1-Person Households | - | 613 (27.1%) |
| 2-Person Households | 743 (32.8%) | 158 (7.0%) |
| 3-Person Households | 252 (11.1%) | 37 (1.6%) |
| 4-Person Households | 257 (11.4%) | 43 (1.9%) |
| 5-Person Households | 124 (5.5%) | 0 (0.0%) |
| 6-Person Households | 21 (0.9%) | 0 (0.0%) |
| 7+ Person Households | 17 (0.7%) | 0 (0.0%) |
| Total | 1,414 (62.4%) | 851 (37.6%) |
Female Fertility in Philomath
Fertility by Age in Philomath
Average fertility rate in Philomath is 30.0 births per 1,000 women. Women in the age bracket of 20 to 34 years have the highest fertility rate with 44.0 births per 1,000 women. Women in the age bracket of 20 to 34 years acount for 63.8% of all women with births.
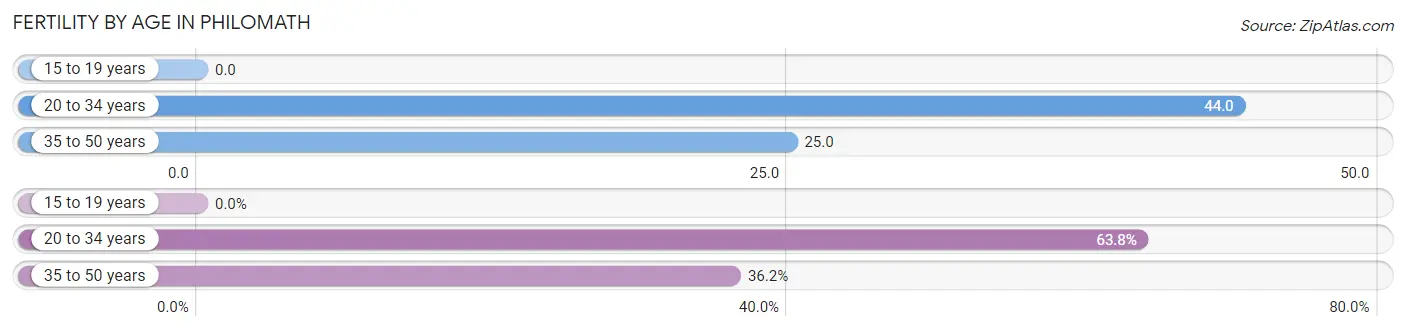
| Age Bracket | Women with Births | Births / 1,000 Women |
| 15 to 19 years | 0 (0.0%) | 0.0 |
| 20 to 34 years | 30 (63.8%) | 44.0 |
| 35 to 50 years | 17 (36.2%) | 25.0 |
| Total | 47 (100.0%) | 30.0 |
Fertility by Age by Marriage Status in Philomath
74.5% of women with births (47) in Philomath are married. The highest percentage of unmarried women with births falls into 20 to 34 years age bracket with 40.0% of them unmarried at the time of birth, while the lowest percentage of unmarried women with births belong to 35 to 50 years age bracket with 0.0% of them unmarried.
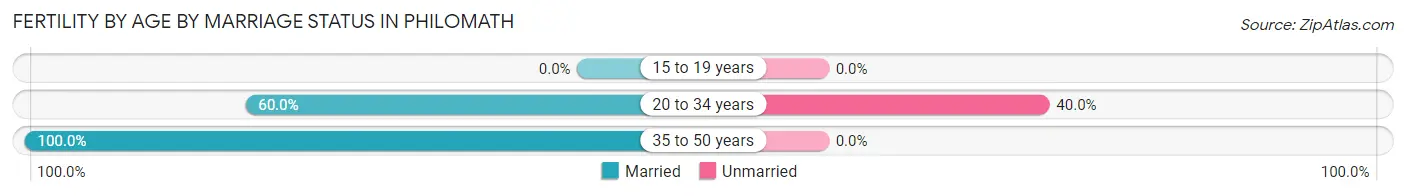
| Age Bracket | Married | Unmarried |
| 15 to 19 years | 0 (0.0%) | 0 (0.0%) |
| 20 to 34 years | 18 (60.0%) | 12 (40.0%) |
| 35 to 50 years | 17 (100.0%) | 0 (0.0%) |
| Total | 35 (74.5%) | 12 (25.5%) |
Fertility by Education in Philomath
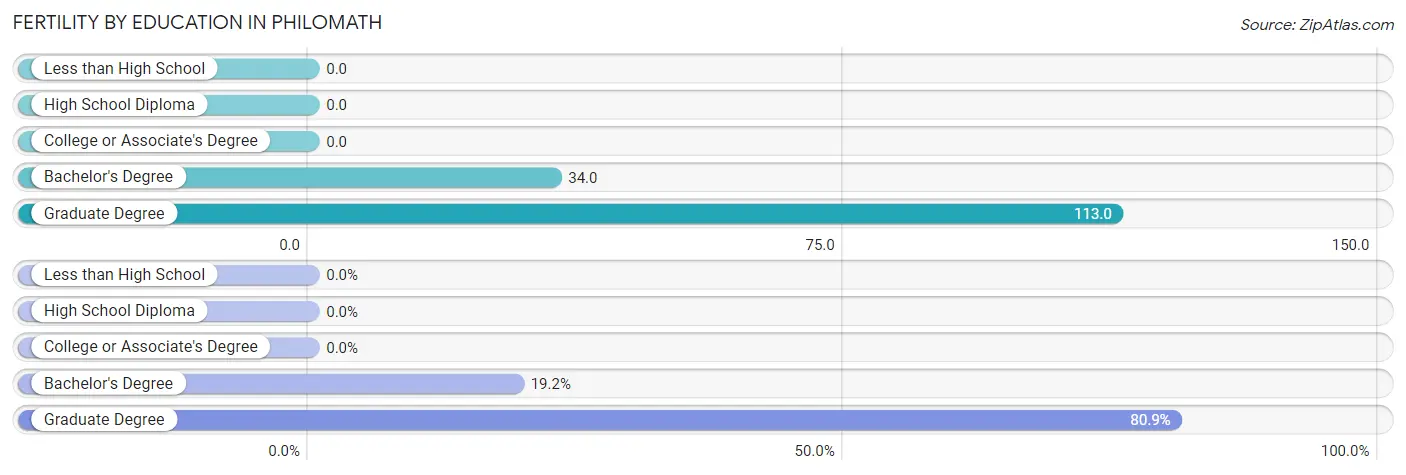
| Educational Attainment | Women with Births | Births / 1,000 Women |
| Less than High School | 0 (0.0%) | 0.0 |
| High School Diploma | 0 (0.0%) | 0.0 |
| College or Associate's Degree | 0 (0.0%) | 0.0 |
| Bachelor's Degree | 9 (19.2%) | 34.0 |
| Graduate Degree | 38 (80.8%) | 113.0 |
| Total | 47 (100.0%) | 30.0 |
Fertility by Education by Marriage Status in Philomath
25.5% of women with births in Philomath are unmarried. Women with the educational attainment of bachelor's degree are most likely to be married with 100.0% of them married at childbirth, while women with the educational attainment of graduate degree are least likely to be married with 31.6% of them unmarried at childbirth.
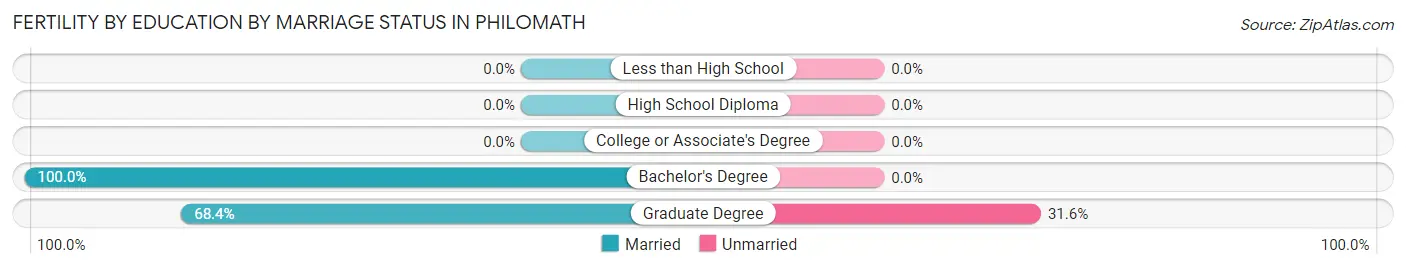
| Educational Attainment | Married | Unmarried |
| Less than High School | 0 (0.0%) | 0 (0.0%) |
| High School Diploma | 0 (0.0%) | 0 (0.0%) |
| College or Associate's Degree | 0 (0.0%) | 0 (0.0%) |
| Bachelor's Degree | 9 (100.0%) | 0 (0.0%) |
| Graduate Degree | 26 (68.4%) | 12 (31.6%) |
| Total | 35 (74.5%) | 12 (25.5%) |
Employment Characteristics in Philomath
Employment by Class of Employer in Philomath
Among the 3,179 employed individuals in Philomath, private company employees (1,761 | 55.4%), not-for-profit organizations (452 | 14.2%), and state government employees (349 | 11.0%) make up the most common classes of employment.
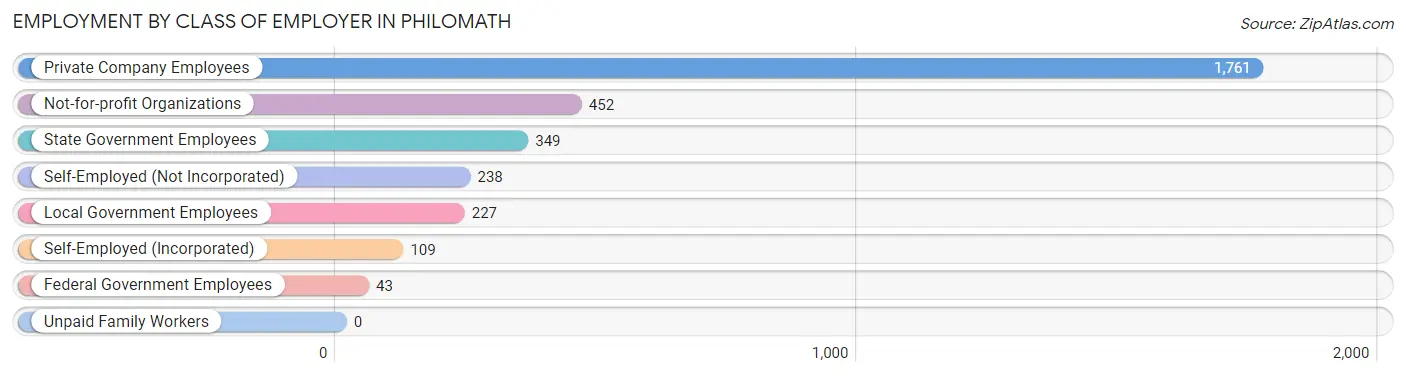
| Employer Class | # Employees | % Employees |
| Private Company Employees | 1,761 | 55.4% |
| Self-Employed (Incorporated) | 109 | 3.4% |
| Self-Employed (Not Incorporated) | 238 | 7.5% |
| Not-for-profit Organizations | 452 | 14.2% |
| Local Government Employees | 227 | 7.1% |
| State Government Employees | 349 | 11.0% |
| Federal Government Employees | 43 | 1.3% |
| Unpaid Family Workers | 0 | 0.0% |
| Total | 3,179 | 100.0% |
Employment Status by Age in Philomath
According to the labor force statistics for Philomath, out of the total population over 16 years of age (4,550), 73.9% or 3,362 individuals are in the labor force, with 3.8% or 128 of them unemployed. The age group with the highest labor force participation rate is 30 to 34 years, with 96.2% or 332 individuals in the labor force. Within the labor force, the 25 to 29 years age range has the highest percentage of unemployed individuals, with 11.2% or 56 of them being unemployed.
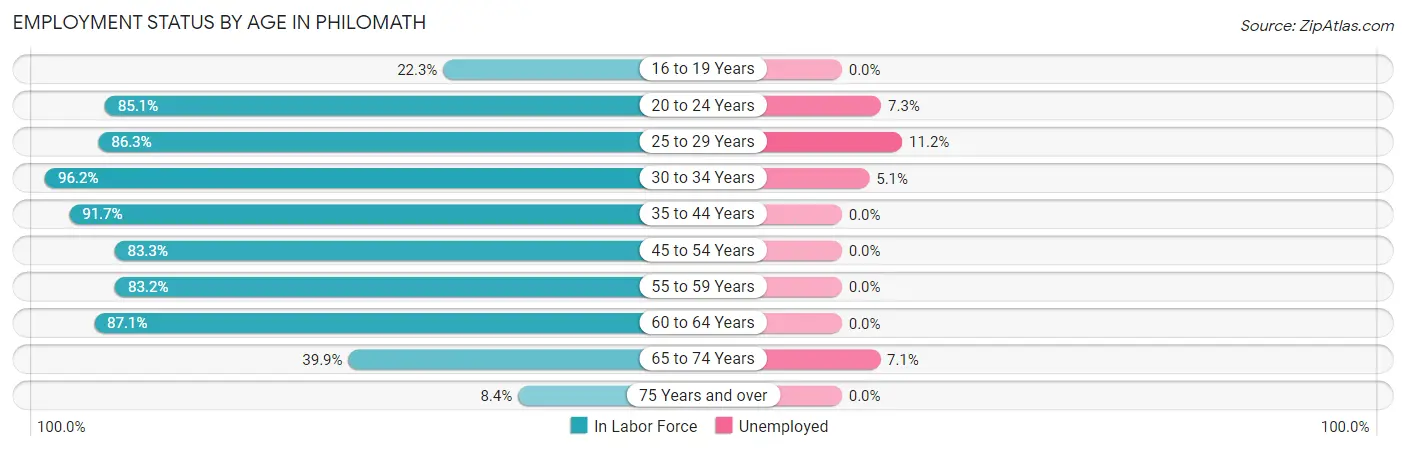
| Age Bracket | In Labor Force | Unemployed |
| 16 to 19 Years | 52 (22.3%) | 0 (0.0%) |
| 20 to 24 Years | 467 (85.1%) | 34 (7.3%) |
| 25 to 29 Years | 498 (86.3%) | 56 (11.2%) |
| 30 to 34 Years | 332 (96.2%) | 17 (5.1%) |
| 35 to 44 Years | 682 (91.7%) | 0 (0.0%) |
| 45 to 54 Years | 534 (83.3%) | 0 (0.0%) |
| 55 to 59 Years | 223 (83.2%) | 0 (0.0%) |
| 60 to 64 Years | 278 (87.1%) | 0 (0.0%) |
| 65 to 74 Years | 282 (39.9%) | 20 (7.1%) |
| 75 Years and over | 14 (8.4%) | 0 (0.0%) |
| Total | 3,362 (73.9%) | 128 (3.8%) |
Employment Status by Educational Attainment in Philomath
According to labor force statistics for Philomath, 88.0% of individuals (2,547) out of the total population between 25 and 64 years of age (2,894) are in the labor force, with 2.9% or 74 of them being unemployed. The group with the highest labor force participation rate are those with the educational attainment of college / associate degree, with 91.3% or 840 individuals in the labor force. Within the labor force, individuals with college / associate degree education have the highest percentage of unemployment, with 5.0% or 42 of them being unemployed.
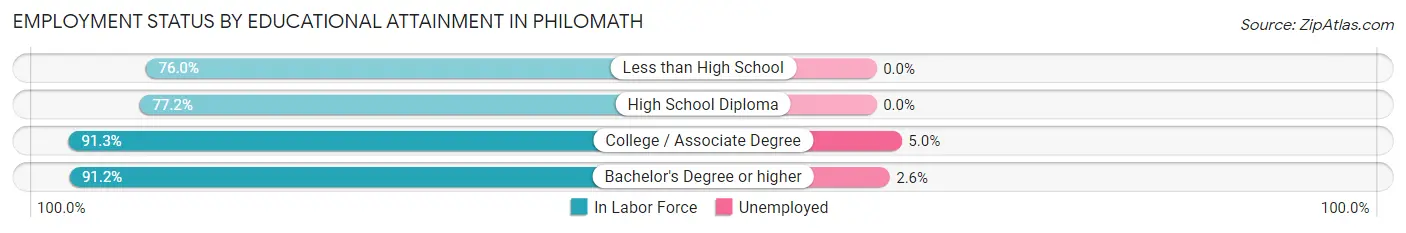
| Educational Attainment | In Labor Force | Unemployed |
| Less than High School | 111 (76.0%) | 0 (0.0%) |
| High School Diploma | 390 (77.2%) | 0 (0.0%) |
| College / Associate Degree | 840 (91.3%) | 46 (5.0%) |
| Bachelor's Degree or higher | 1,207 (91.2%) | 34 (2.6%) |
| Total | 2,547 (88.0%) | 84 (2.9%) |
Employment Occupations by Sex in Philomath
Management, Business, Science and Arts Occupations
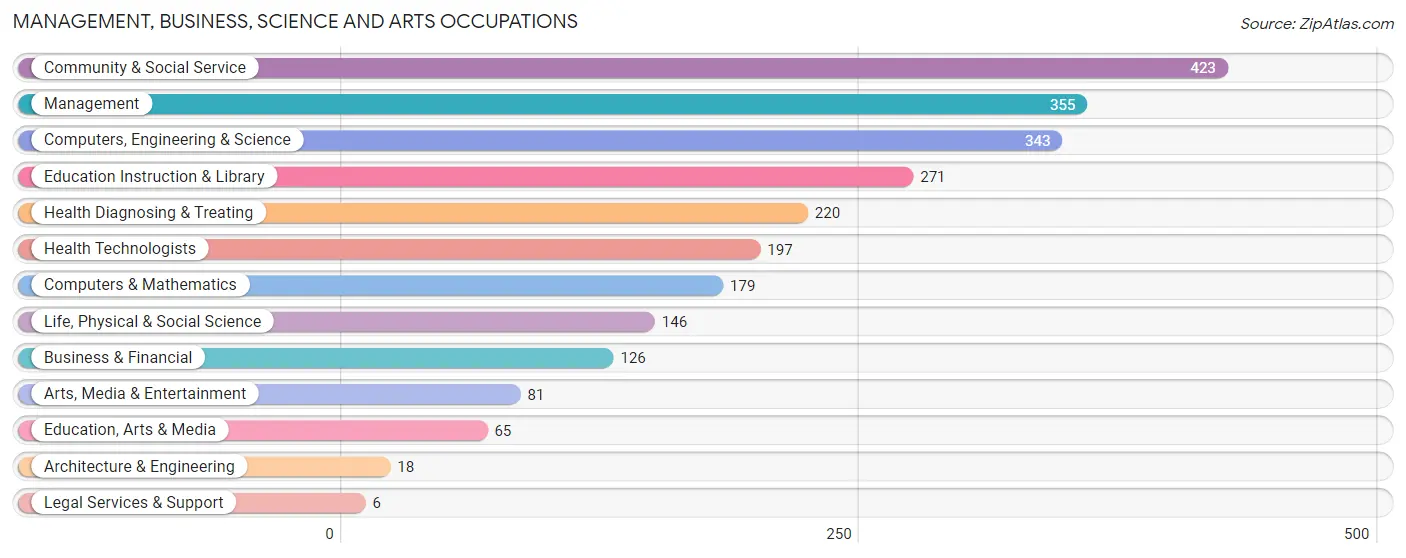
The most common Management, Business, Science and Arts occupations in Philomath are Community & Social Service (423 | 13.1%), Management (355 | 11.0%), Computers, Engineering & Science (343 | 10.6%), Education Instruction & Library (271 | 8.4%), and Health Diagnosing & Treating (220 | 6.8%).
Management, Business, Science and Arts Occupations by Sex
Within the Management, Business, Science and Arts occupations in Philomath, the most male-oriented occupations are Architecture & Engineering (100.0%), Management (82.8%), and Computers & Mathematics (71.0%), while the most female-oriented occupations are Legal Services & Support (100.0%), Health Technologists (85.8%), and Health Diagnosing & Treating (83.6%).
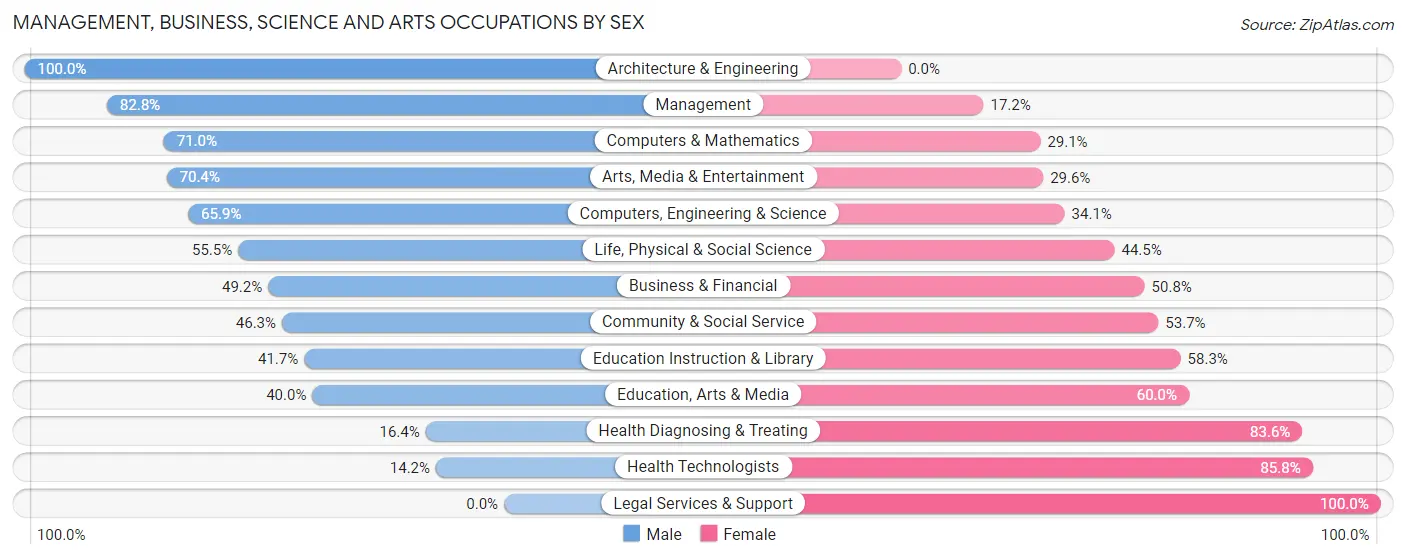
| Occupation | Male | Female |
| Management | 294 (82.8%) | 61 (17.2%) |
| Business & Financial | 62 (49.2%) | 64 (50.8%) |
| Computers, Engineering & Science | 226 (65.9%) | 117 (34.1%) |
| Computers & Mathematics | 127 (71.0%) | 52 (29.0%) |
| Architecture & Engineering | 18 (100.0%) | 0 (0.0%) |
| Life, Physical & Social Science | 81 (55.5%) | 65 (44.5%) |
| Community & Social Service | 196 (46.3%) | 227 (53.7%) |
| Education, Arts & Media | 26 (40.0%) | 39 (60.0%) |
| Legal Services & Support | 0 (0.0%) | 6 (100.0%) |
| Education Instruction & Library | 113 (41.7%) | 158 (58.3%) |
| Arts, Media & Entertainment | 57 (70.4%) | 24 (29.6%) |
| Health Diagnosing & Treating | 36 (16.4%) | 184 (83.6%) |
| Health Technologists | 28 (14.2%) | 169 (85.8%) |
| Total (Category) | 814 (55.5%) | 653 (44.5%) |
| Total (Overall) | 1,708 (52.8%) | 1,527 (47.2%) |
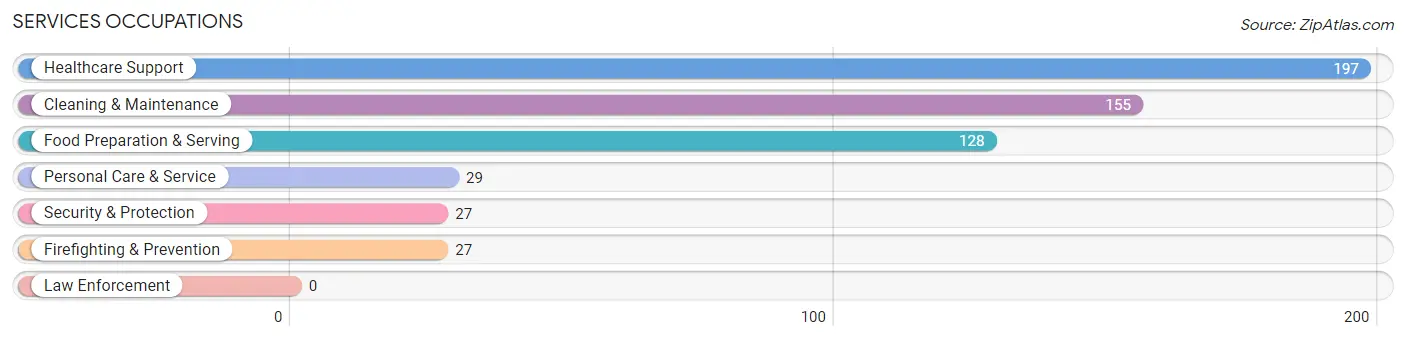
Services Occupations
The most common Services occupations in Philomath are Healthcare Support (197 | 6.1%), Cleaning & Maintenance (155 | 4.8%), Food Preparation & Serving (128 | 4.0%), Personal Care & Service (29 | 0.9%), and Security & Protection (27 | 0.8%).
Services Occupations by Sex
Within the Services occupations in Philomath, the most male-oriented occupations are Security & Protection (100.0%), Firefighting & Prevention (100.0%), and Cleaning & Maintenance (41.3%), while the most female-oriented occupations are Personal Care & Service (100.0%), Healthcare Support (93.4%), and Food Preparation & Serving (71.1%).
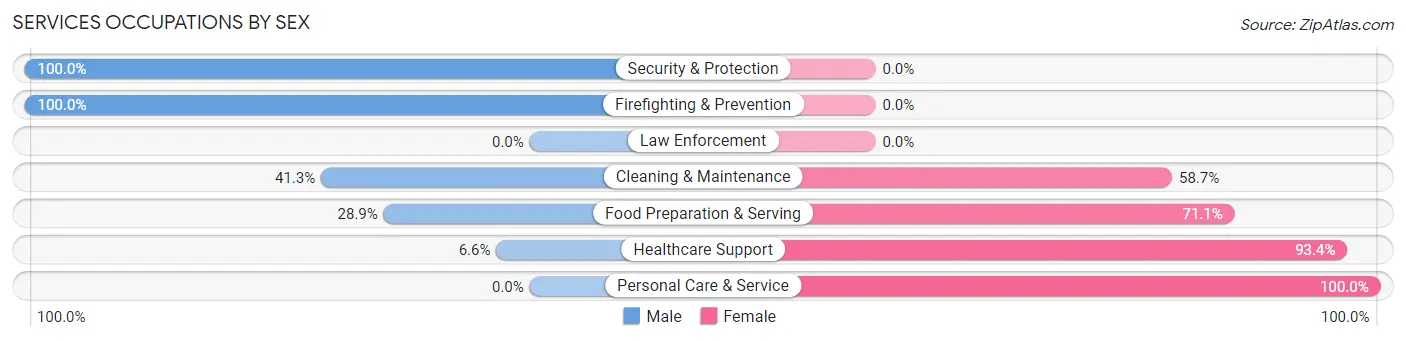
| Occupation | Male | Female |
| Healthcare Support | 13 (6.6%) | 184 (93.4%) |
| Security & Protection | 27 (100.0%) | 0 (0.0%) |
| Firefighting & Prevention | 27 (100.0%) | 0 (0.0%) |
| Law Enforcement | 0 (0.0%) | 0 (0.0%) |
| Food Preparation & Serving | 37 (28.9%) | 91 (71.1%) |
| Cleaning & Maintenance | 64 (41.3%) | 91 (58.7%) |
| Personal Care & Service | 0 (0.0%) | 29 (100.0%) |
| Total (Category) | 141 (26.3%) | 395 (73.7%) |
| Total (Overall) | 1,708 (52.8%) | 1,527 (47.2%) |
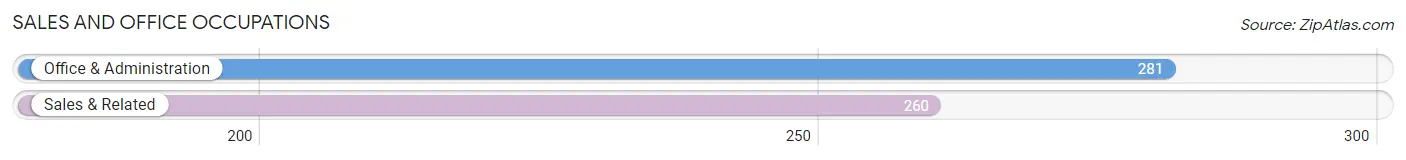
Sales and Office Occupations
The most common Sales and Office occupations in Philomath are Office & Administration (281 | 8.7%), and Sales & Related (260 | 8.0%).
Sales and Office Occupations by Sex
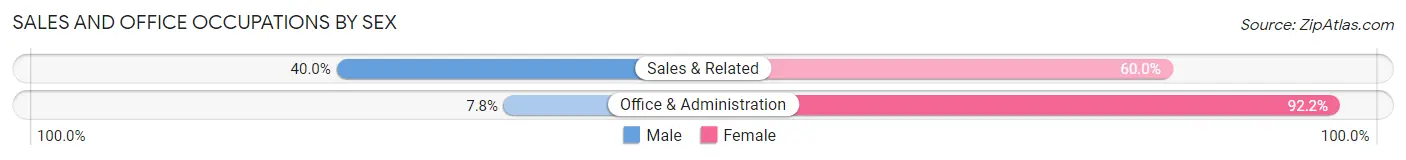
| Occupation | Male | Female |
| Sales & Related | 104 (40.0%) | 156 (60.0%) |
| Office & Administration | 22 (7.8%) | 259 (92.2%) |
| Total (Category) | 126 (23.3%) | 415 (76.7%) |
| Total (Overall) | 1,708 (52.8%) | 1,527 (47.2%) |
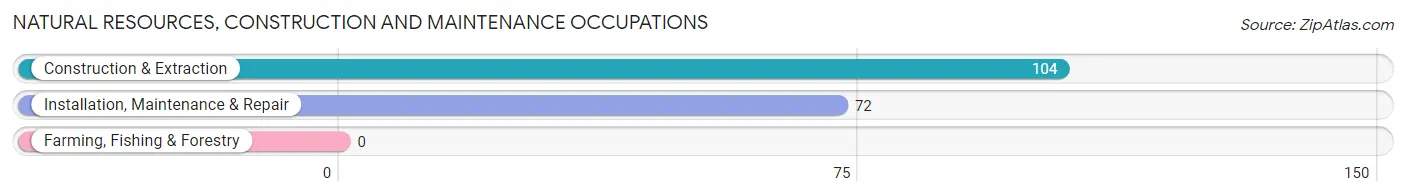
Natural Resources, Construction and Maintenance Occupations
The most common Natural Resources, Construction and Maintenance occupations in Philomath are Construction & Extraction (104 | 3.2%), and Installation, Maintenance & Repair (72 | 2.2%).
Natural Resources, Construction and Maintenance Occupations by Sex
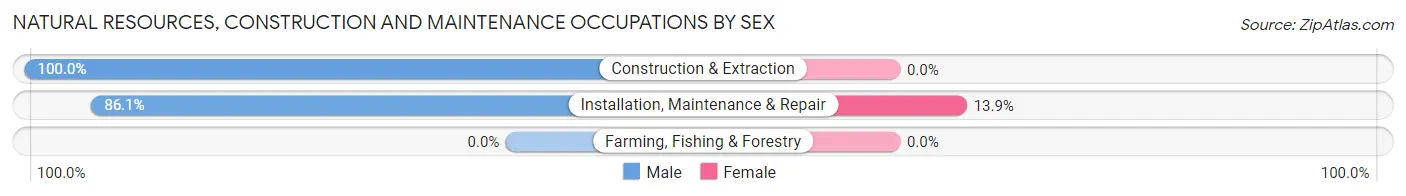
| Occupation | Male | Female |
| Farming, Fishing & Forestry | 0 (0.0%) | 0 (0.0%) |
| Construction & Extraction | 104 (100.0%) | 0 (0.0%) |
| Installation, Maintenance & Repair | 62 (86.1%) | 10 (13.9%) |
| Total (Category) | 166 (94.3%) | 10 (5.7%) |
| Total (Overall) | 1,708 (52.8%) | 1,527 (47.2%) |
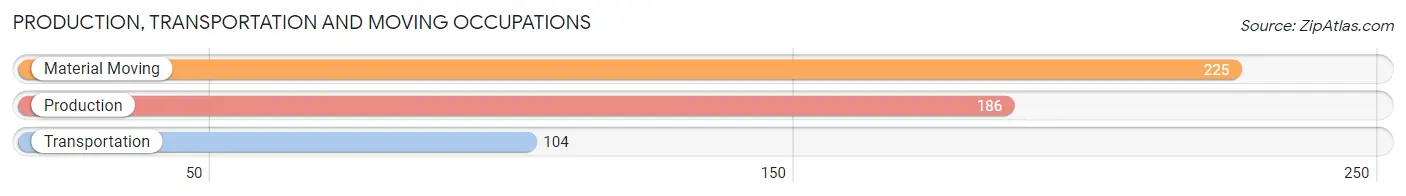
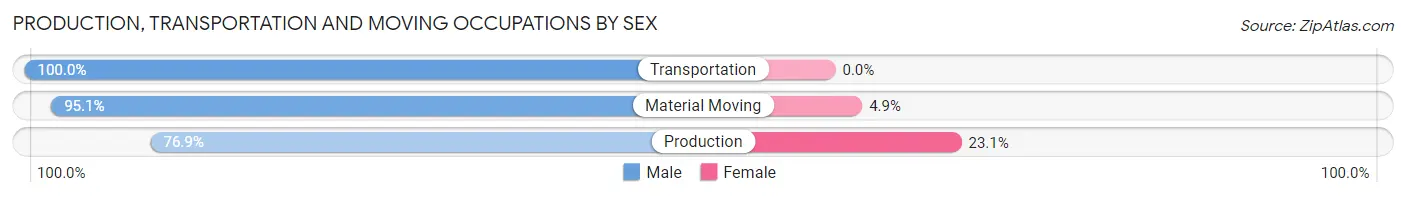
Production, Transportation and Moving Occupations
The most common Production, Transportation and Moving occupations in Philomath are Material Moving (225 | 7.0%), Production (186 | 5.8%), and Transportation (104 | 3.2%).
Production, Transportation and Moving Occupations by Sex
| Occupation | Male | Female |
| Production | 143 (76.9%) | 43 (23.1%) |
| Transportation | 104 (100.0%) | 0 (0.0%) |
| Material Moving | 214 (95.1%) | 11 (4.9%) |
| Total (Category) | 461 (89.5%) | 54 (10.5%) |
| Total (Overall) | 1,708 (52.8%) | 1,527 (47.2%) |
Employment Industries by Sex in Philomath
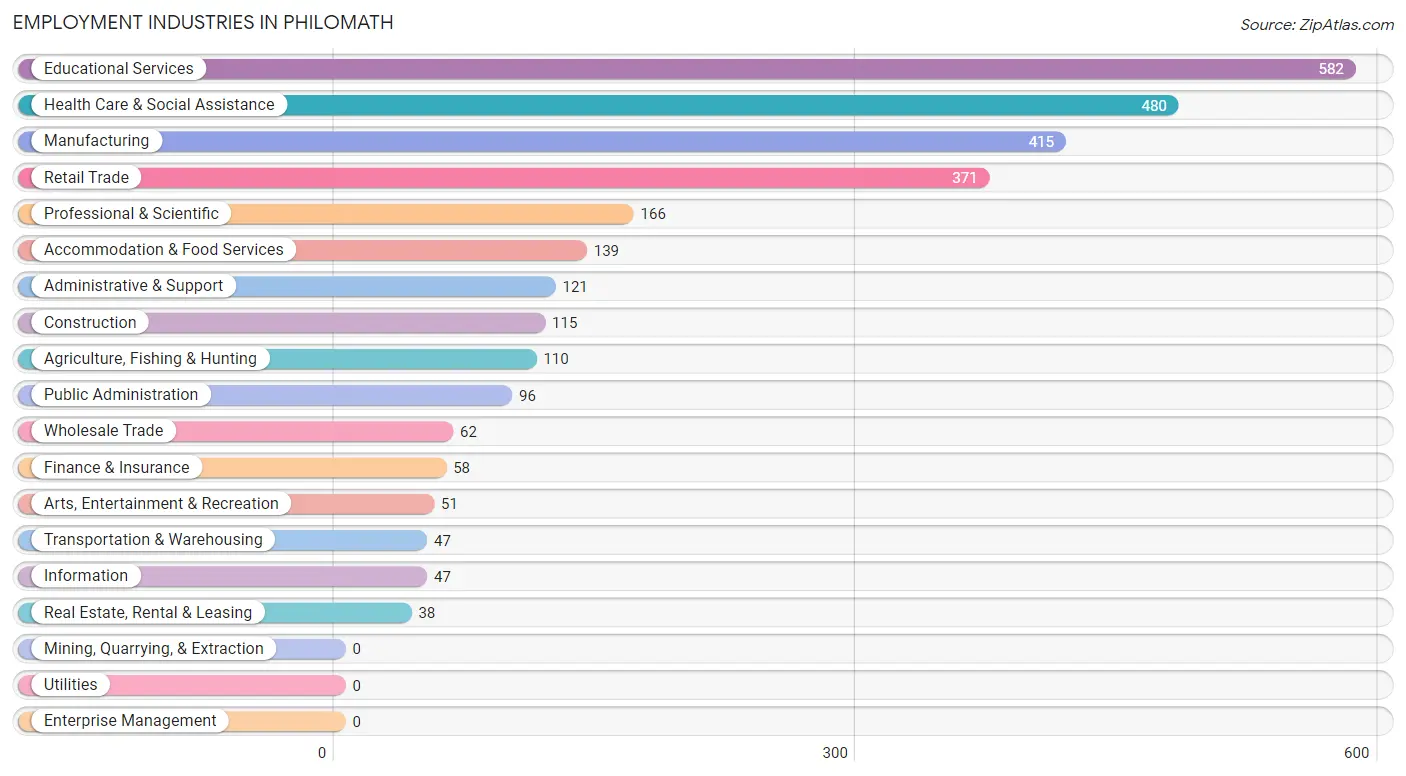
Employment Industries in Philomath
The major employment industries in Philomath include Educational Services (582 | 18.0%), Health Care & Social Assistance (480 | 14.8%), Manufacturing (415 | 12.8%), Retail Trade (371 | 11.5%), and Professional & Scientific (166 | 5.1%).
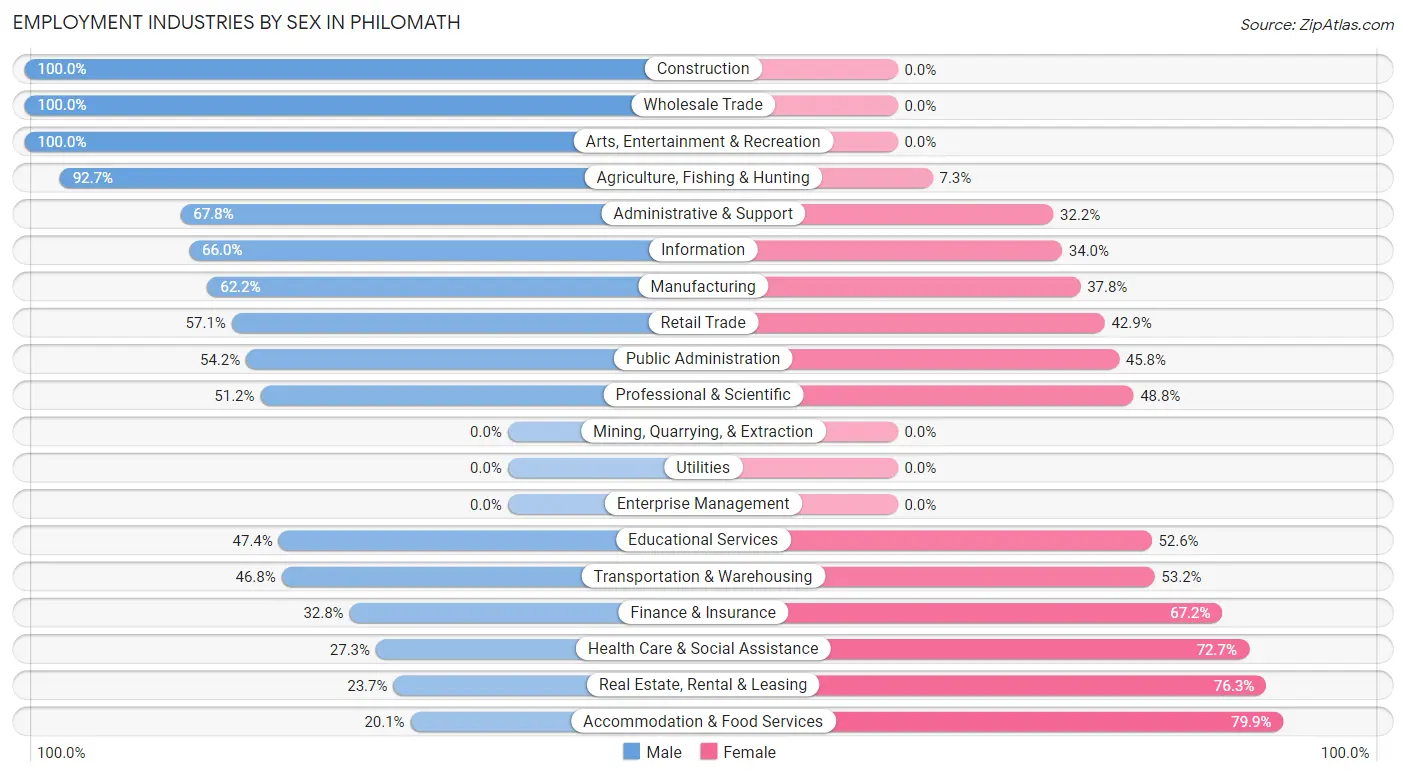
Employment Industries by Sex in Philomath
The Philomath industries that see more men than women are Construction (100.0%), Wholesale Trade (100.0%), and Arts, Entertainment & Recreation (100.0%), whereas the industries that tend to have a higher number of women are Accommodation & Food Services (79.9%), Real Estate, Rental & Leasing (76.3%), and Health Care & Social Assistance (72.7%).
| Industry | Male | Female |
| Agriculture, Fishing & Hunting | 102 (92.7%) | 8 (7.3%) |
| Mining, Quarrying, & Extraction | 0 (0.0%) | 0 (0.0%) |
| Construction | 115 (100.0%) | 0 (0.0%) |
| Manufacturing | 258 (62.2%) | 157 (37.8%) |
| Wholesale Trade | 62 (100.0%) | 0 (0.0%) |
| Retail Trade | 212 (57.1%) | 159 (42.9%) |
| Transportation & Warehousing | 22 (46.8%) | 25 (53.2%) |
| Utilities | 0 (0.0%) | 0 (0.0%) |
| Information | 31 (66.0%) | 16 (34.0%) |
| Finance & Insurance | 19 (32.8%) | 39 (67.2%) |
| Real Estate, Rental & Leasing | 9 (23.7%) | 29 (76.3%) |
| Professional & Scientific | 85 (51.2%) | 81 (48.8%) |
| Enterprise Management | 0 (0.0%) | 0 (0.0%) |
| Administrative & Support | 82 (67.8%) | 39 (32.2%) |
| Educational Services | 276 (47.4%) | 306 (52.6%) |
| Health Care & Social Assistance | 131 (27.3%) | 349 (72.7%) |
| Arts, Entertainment & Recreation | 51 (100.0%) | 0 (0.0%) |
| Accommodation & Food Services | 28 (20.1%) | 111 (79.9%) |
| Public Administration | 52 (54.2%) | 44 (45.8%) |
| Total | 1,708 (52.8%) | 1,527 (47.2%) |
Education in Philomath
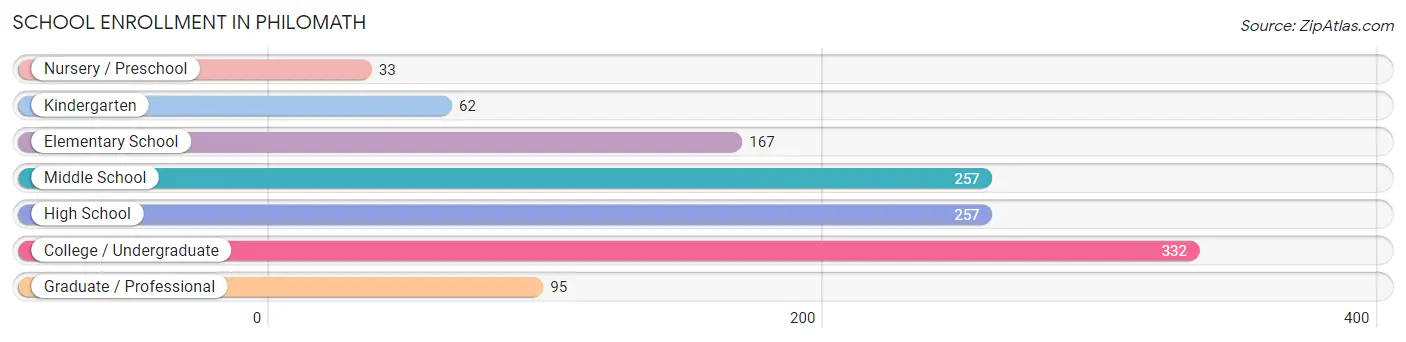
School Enrollment in Philomath
The most common levels of schooling among the 1,203 students in Philomath are college / undergraduate (332 | 27.6%), middle school (257 | 21.4%), and high school (257 | 21.4%).
| School Level | # Students | % Students |
| Nursery / Preschool | 33 | 2.7% |
| Kindergarten | 62 | 5.1% |
| Elementary School | 167 | 13.9% |
| Middle School | 257 | 21.4% |
| High School | 257 | 21.4% |
| College / Undergraduate | 332 | 27.6% |
| Graduate / Professional | 95 | 7.9% |
| Total | 1,203 | 100.0% |
School Enrollment by Age by Funding Source in Philomath
Out of a total of 1,203 students who are enrolled in schools in Philomath, 99 (8.2%) attend a private institution, while the remaining 1,104 (91.8%) are enrolled in public schools. The age group of 10 to 14 year olds has the highest likelihood of being enrolled in private schools, with 50 (18.5% in the age bracket) enrolled. Conversely, the age group of 3 to 4 year olds has the lowest likelihood of being enrolled in a private school, with 24 (100.0% in the age bracket) attending a public institution.
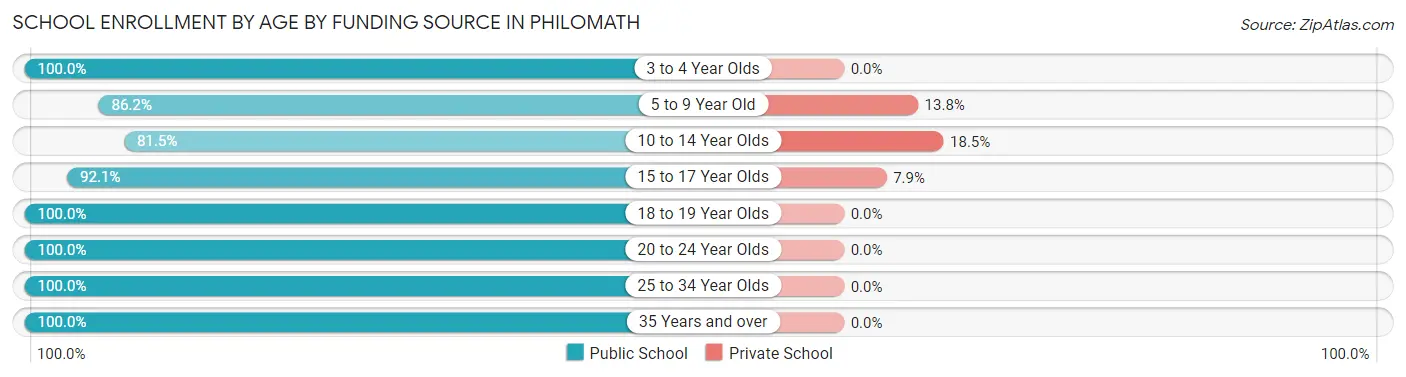
| Age Bracket | Public School | Private School |
| 3 to 4 Year Olds | 24 (100.0%) | 0 (0.0%) |
| 5 to 9 Year Old | 194 (86.2%) | 31 (13.8%) |
| 10 to 14 Year Olds | 220 (81.5%) | 50 (18.5%) |
| 15 to 17 Year Olds | 209 (92.1%) | 18 (7.9%) |
| 18 to 19 Year Olds | 122 (100.0%) | 0 (0.0%) |
| 20 to 24 Year Olds | 207 (100.0%) | 0 (0.0%) |
| 25 to 34 Year Olds | 88 (100.0%) | 0 (0.0%) |
| 35 Years and over | 40 (100.0%) | 0 (0.0%) |
| Total | 1,104 (91.8%) | 99 (8.2%) |
Educational Attainment by Field of Study in Philomath
Bio, nature & agricultural (219 | 11.9%), arts & humanities (201 | 10.9%), liberal arts & history (182 | 9.9%), visual & performing arts (168 | 9.1%), and computers & mathematics (160 | 8.7%) are the most common fields of study among 1,838 individuals in Philomath who have obtained a bachelor's degree or higher.
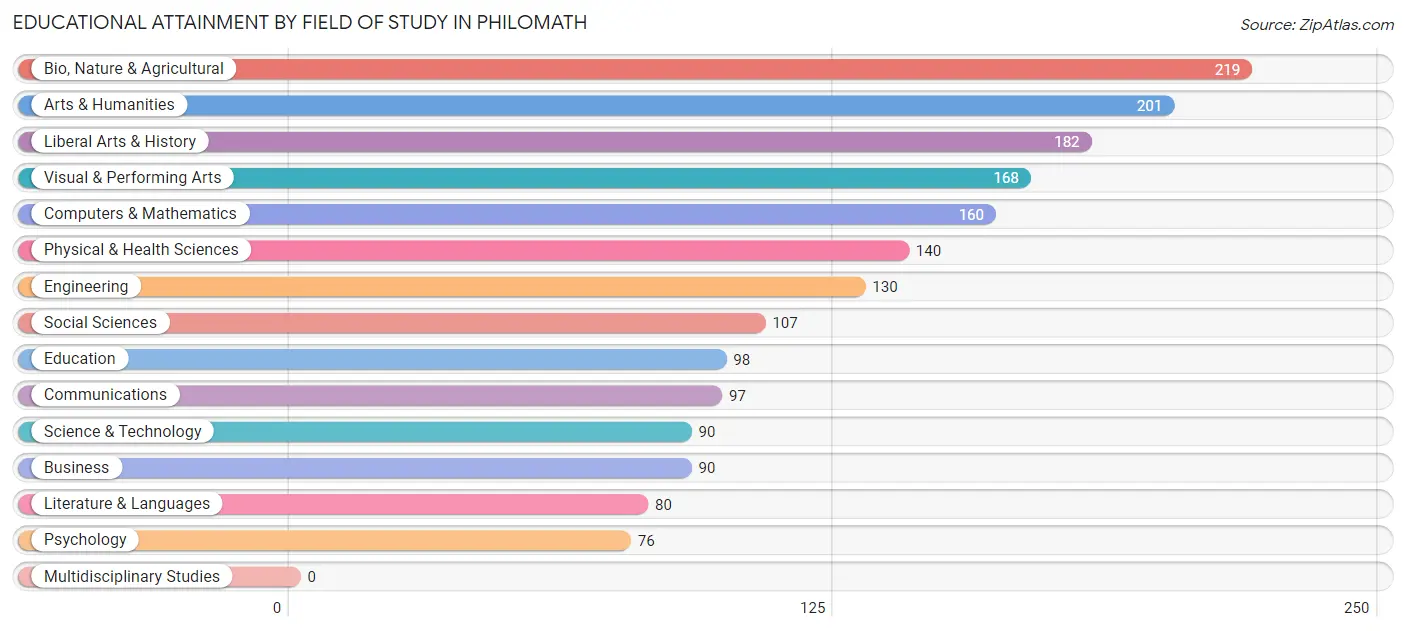
| Field of Study | # Graduates | % Graduates |
| Computers & Mathematics | 160 | 8.7% |
| Bio, Nature & Agricultural | 219 | 11.9% |
| Physical & Health Sciences | 140 | 7.6% |
| Psychology | 76 | 4.1% |
| Social Sciences | 107 | 5.8% |
| Engineering | 130 | 7.1% |
| Multidisciplinary Studies | 0 | 0.0% |
| Science & Technology | 90 | 4.9% |
| Business | 90 | 4.9% |
| Education | 98 | 5.3% |
| Literature & Languages | 80 | 4.3% |
| Liberal Arts & History | 182 | 9.9% |
| Visual & Performing Arts | 168 | 9.1% |
| Communications | 97 | 5.3% |
| Arts & Humanities | 201 | 10.9% |
| Total | 1,838 | 100.0% |
Transportation & Commute in Philomath
Vehicle Availability by Sex in Philomath
The most prevalent vehicle ownership categories in Philomath are males with 2 vehicles (678, accounting for 40.4%) and females with 2 vehicles (517, making up 45.2%).
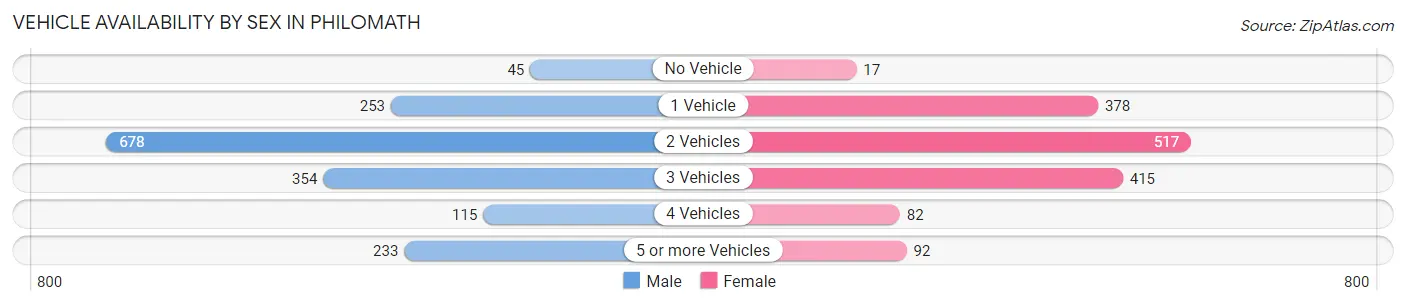
| Vehicles Available | Male | Female |
| No Vehicle | 45 (2.7%) | 17 (1.1%) |
| 1 Vehicle | 253 (15.1%) | 378 (25.2%) |
| 2 Vehicles | 678 (40.4%) | 517 (34.4%) |
| 3 Vehicles | 354 (21.1%) | 415 (27.7%) |
| 4 Vehicles | 115 (6.9%) | 82 (5.5%) |
| 5 or more Vehicles | 233 (13.9%) | 92 (6.1%) |
| Total | 1,678 (100.0%) | 1,501 (100.0%) |
Commute Time in Philomath
The most frequently occuring commute durations in Philomath are 15 to 19 minutes (882 commuters, 32.0%), 10 to 14 minutes (451 commuters, 16.3%), and 5 to 9 minutes (232 commuters, 8.4%).
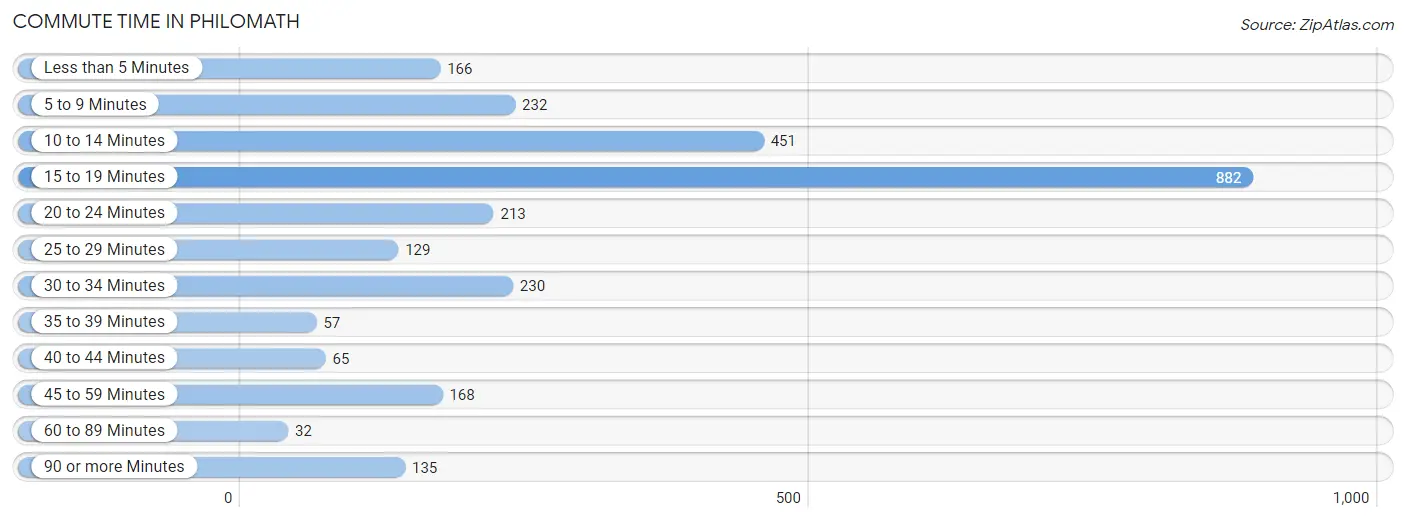
| Commute Time | # Commuters | % Commuters |
| Less than 5 Minutes | 166 | 6.0% |
| 5 to 9 Minutes | 232 | 8.4% |
| 10 to 14 Minutes | 451 | 16.3% |
| 15 to 19 Minutes | 882 | 32.0% |
| 20 to 24 Minutes | 213 | 7.7% |
| 25 to 29 Minutes | 129 | 4.7% |
| 30 to 34 Minutes | 230 | 8.3% |
| 35 to 39 Minutes | 57 | 2.1% |
| 40 to 44 Minutes | 65 | 2.4% |
| 45 to 59 Minutes | 168 | 6.1% |
| 60 to 89 Minutes | 32 | 1.2% |
| 90 or more Minutes | 135 | 4.9% |
Commute Time by Sex in Philomath
The most common commute times in Philomath are 15 to 19 minutes (451 commuters, 30.6%) for males and 15 to 19 minutes (431 commuters, 33.5%) for females.
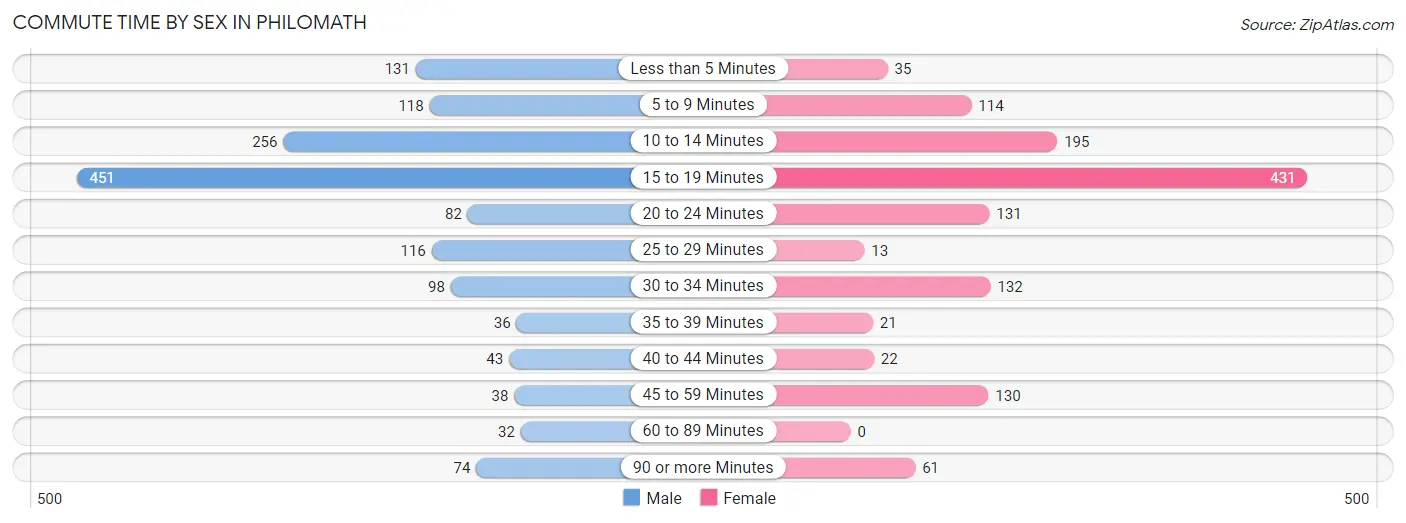
| Commute Time | Male | Female |
| Less than 5 Minutes | 131 (8.9%) | 35 (2.7%) |
| 5 to 9 Minutes | 118 (8.0%) | 114 (8.9%) |
| 10 to 14 Minutes | 256 (17.4%) | 195 (15.2%) |
| 15 to 19 Minutes | 451 (30.6%) | 431 (33.5%) |
| 20 to 24 Minutes | 82 (5.6%) | 131 (10.2%) |
| 25 to 29 Minutes | 116 (7.9%) | 13 (1.0%) |
| 30 to 34 Minutes | 98 (6.6%) | 132 (10.3%) |
| 35 to 39 Minutes | 36 (2.4%) | 21 (1.6%) |
| 40 to 44 Minutes | 43 (2.9%) | 22 (1.7%) |
| 45 to 59 Minutes | 38 (2.6%) | 130 (10.1%) |
| 60 to 89 Minutes | 32 (2.2%) | 0 (0.0%) |
| 90 or more Minutes | 74 (5.0%) | 61 (4.8%) |
Time of Departure to Work by Sex in Philomath
The most frequent times of departure to work in Philomath are 6:30 AM to 6:59 AM (257, 17.4%) for males and 7:00 AM to 7:29 AM (403, 31.4%) for females.
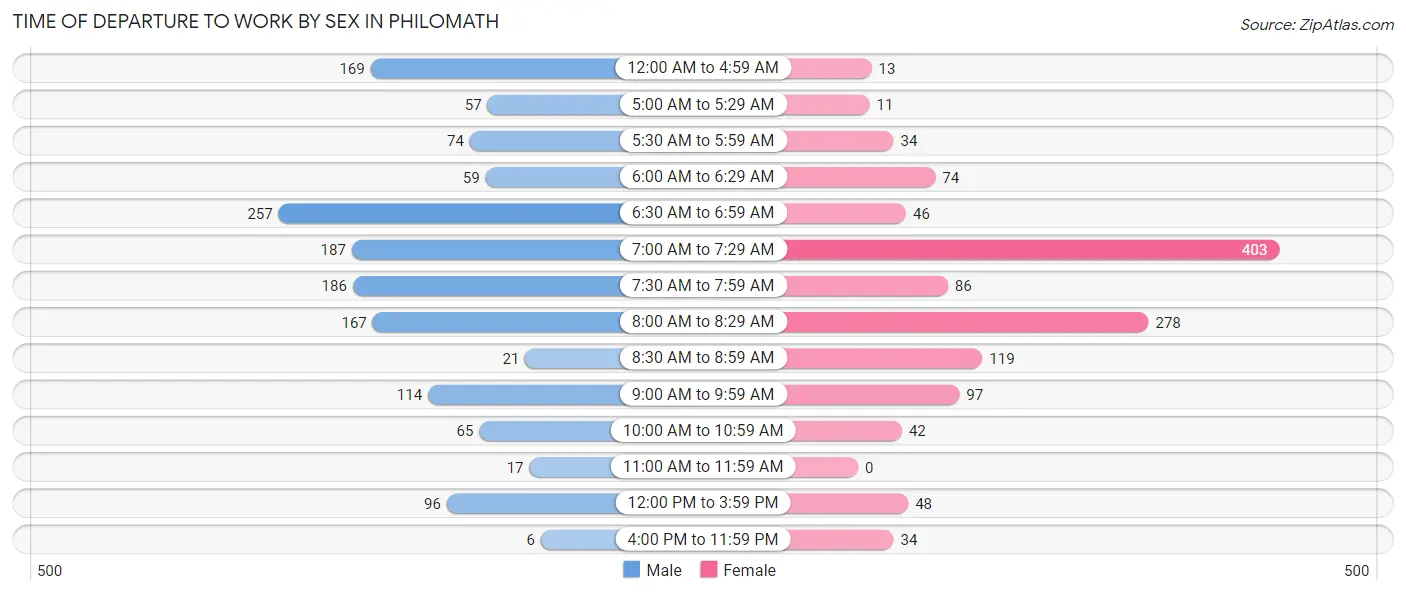
| Time of Departure | Male | Female |
| 12:00 AM to 4:59 AM | 169 (11.5%) | 13 (1.0%) |
| 5:00 AM to 5:29 AM | 57 (3.9%) | 11 (0.9%) |
| 5:30 AM to 5:59 AM | 74 (5.0%) | 34 (2.6%) |
| 6:00 AM to 6:29 AM | 59 (4.0%) | 74 (5.8%) |
| 6:30 AM to 6:59 AM | 257 (17.4%) | 46 (3.6%) |
| 7:00 AM to 7:29 AM | 187 (12.7%) | 403 (31.4%) |
| 7:30 AM to 7:59 AM | 186 (12.6%) | 86 (6.7%) |
| 8:00 AM to 8:29 AM | 167 (11.3%) | 278 (21.6%) |
| 8:30 AM to 8:59 AM | 21 (1.4%) | 119 (9.3%) |
| 9:00 AM to 9:59 AM | 114 (7.7%) | 97 (7.5%) |
| 10:00 AM to 10:59 AM | 65 (4.4%) | 42 (3.3%) |
| 11:00 AM to 11:59 AM | 17 (1.1%) | 0 (0.0%) |
| 12:00 PM to 3:59 PM | 96 (6.5%) | 48 (3.7%) |
| 4:00 PM to 11:59 PM | 6 (0.4%) | 34 (2.6%) |
| Total | 1,475 (100.0%) | 1,285 (100.0%) |
Housing Occupancy in Philomath
Occupancy by Ownership in Philomath
Of the total 2,265 dwellings in Philomath, owner-occupied units account for 1,528 (67.5%), while renter-occupied units make up 737 (32.5%).
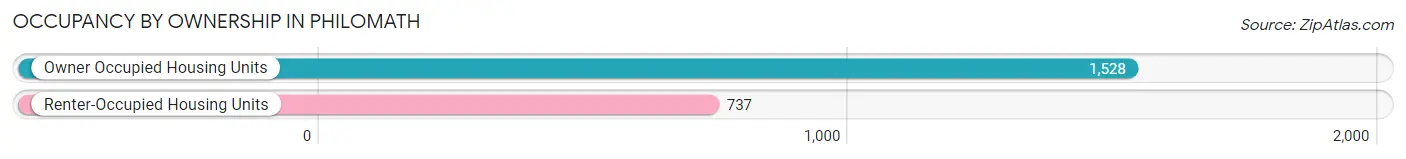
| Occupancy | # Housing Units | % Housing Units |
| Owner Occupied Housing Units | 1,528 | 67.5% |
| Renter-Occupied Housing Units | 737 | 32.5% |
| Total Occupied Housing Units | 2,265 | 100.0% |
Occupancy by Household Size in Philomath
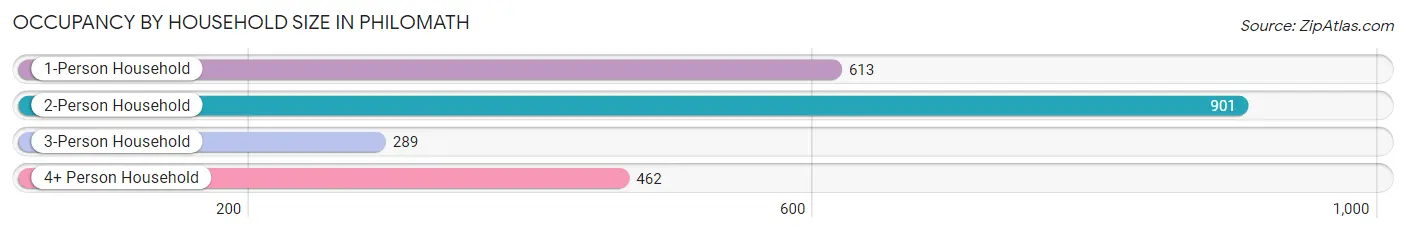
| Household Size | # Housing Units | % Housing Units |
| 1-Person Household | 613 | 27.1% |
| 2-Person Household | 901 | 39.8% |
| 3-Person Household | 289 | 12.8% |
| 4+ Person Household | 462 | 20.4% |
| Total Housing Units | 2,265 | 100.0% |
Occupancy by Ownership by Household Size in Philomath
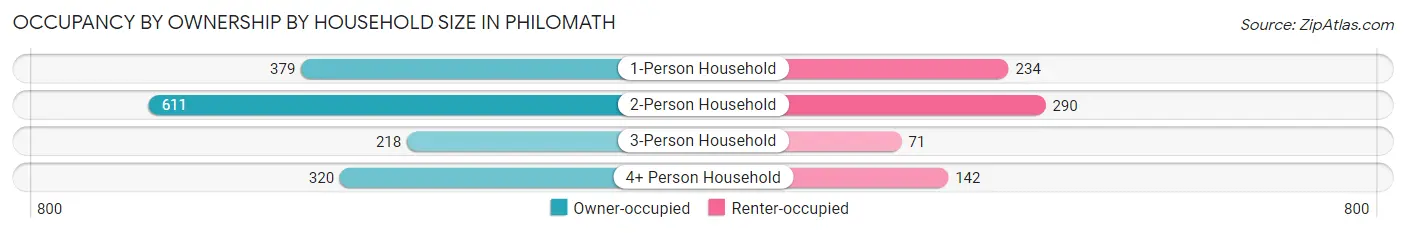
| Household Size | Owner-occupied | Renter-occupied |
| 1-Person Household | 379 (61.8%) | 234 (38.2%) |
| 2-Person Household | 611 (67.8%) | 290 (32.2%) |
| 3-Person Household | 218 (75.4%) | 71 (24.6%) |
| 4+ Person Household | 320 (69.3%) | 142 (30.7%) |
| Total Housing Units | 1,528 (67.5%) | 737 (32.5%) |
Occupancy by Educational Attainment in Philomath
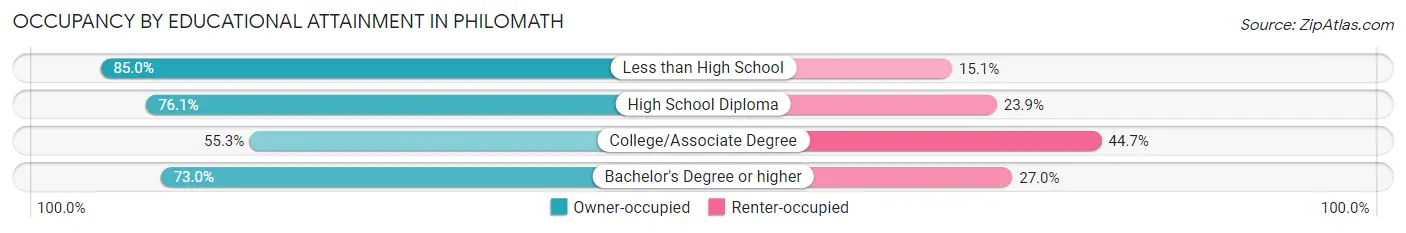
| Household Size | Owner-occupied | Renter-occupied |
| Less than High School | 79 (85.0%) | 14 (15.0%) |
| High School Diploma | 264 (76.1%) | 83 (23.9%) |
| College/Associate Degree | 460 (55.3%) | 372 (44.7%) |
| Bachelor's Degree or higher | 725 (73.0%) | 268 (27.0%) |
Occupancy by Age of Householder in Philomath
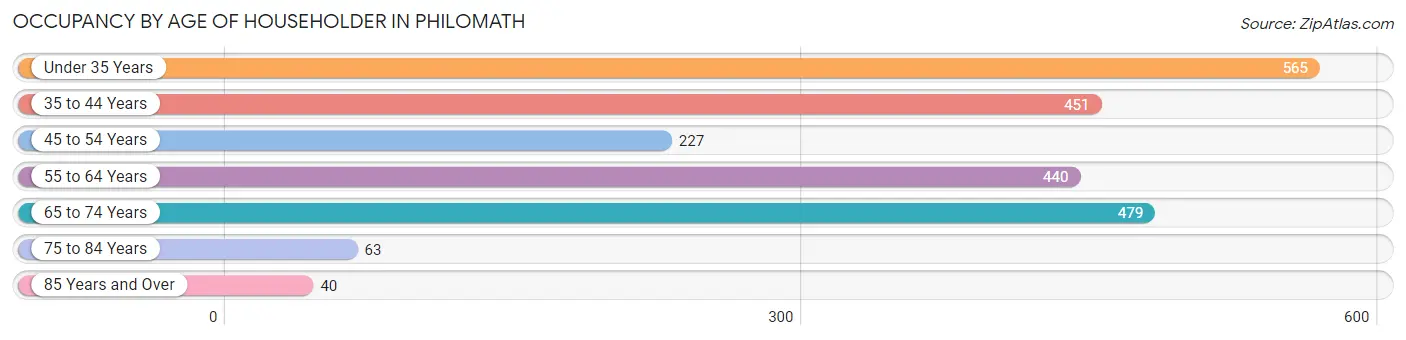
| Age Bracket | # Households | % Households |
| Under 35 Years | 565 | 24.9% |
| 35 to 44 Years | 451 | 19.9% |
| 45 to 54 Years | 227 | 10.0% |
| 55 to 64 Years | 440 | 19.4% |
| 65 to 74 Years | 479 | 21.1% |
| 75 to 84 Years | 63 | 2.8% |
| 85 Years and Over | 40 | 1.8% |
| Total | 2,265 | 100.0% |
Housing Finances in Philomath
Median Income by Occupancy in Philomath
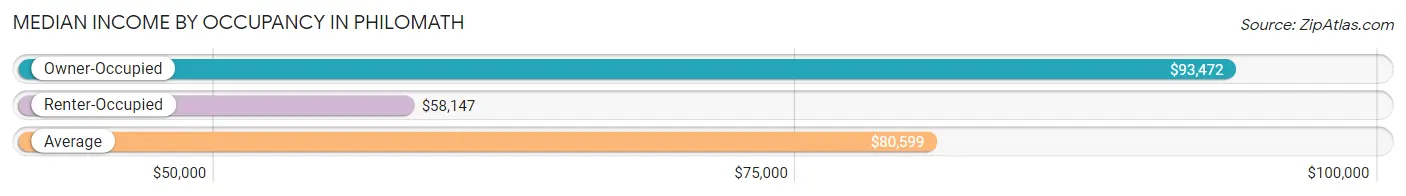
| Occupancy Type | # Households | Median Income |
| Owner-Occupied | 1,528 (67.5%) | $93,472 |
| Renter-Occupied | 737 (32.5%) | $58,147 |
| Average | 2,265 (100.0%) | $80,599 |
Occupancy by Householder Income Bracket in Philomath
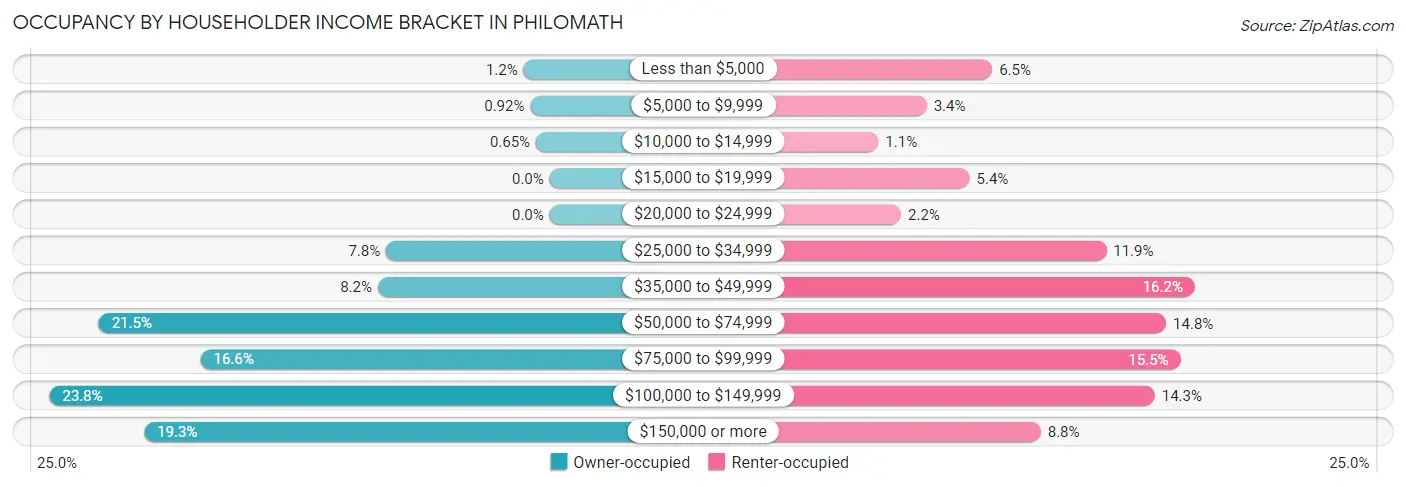
| Income Bracket | Owner-occupied | Renter-occupied |
| Less than $5,000 | 19 (1.2%) | 48 (6.5%) |
| $5,000 to $9,999 | 14 (0.9%) | 25 (3.4%) |
| $10,000 to $14,999 | 10 (0.6%) | 8 (1.1%) |
| $15,000 to $19,999 | 0 (0.0%) | 40 (5.4%) |
| $20,000 to $24,999 | 0 (0.0%) | 16 (2.2%) |
| $25,000 to $34,999 | 119 (7.8%) | 88 (11.9%) |
| $35,000 to $49,999 | 125 (8.2%) | 119 (16.2%) |
| $50,000 to $74,999 | 328 (21.5%) | 109 (14.8%) |
| $75,000 to $99,999 | 254 (16.6%) | 114 (15.5%) |
| $100,000 to $149,999 | 364 (23.8%) | 105 (14.2%) |
| $150,000 or more | 295 (19.3%) | 65 (8.8%) |
| Total | 1,528 (100.0%) | 737 (100.0%) |
Monthly Housing Cost Tiers in Philomath
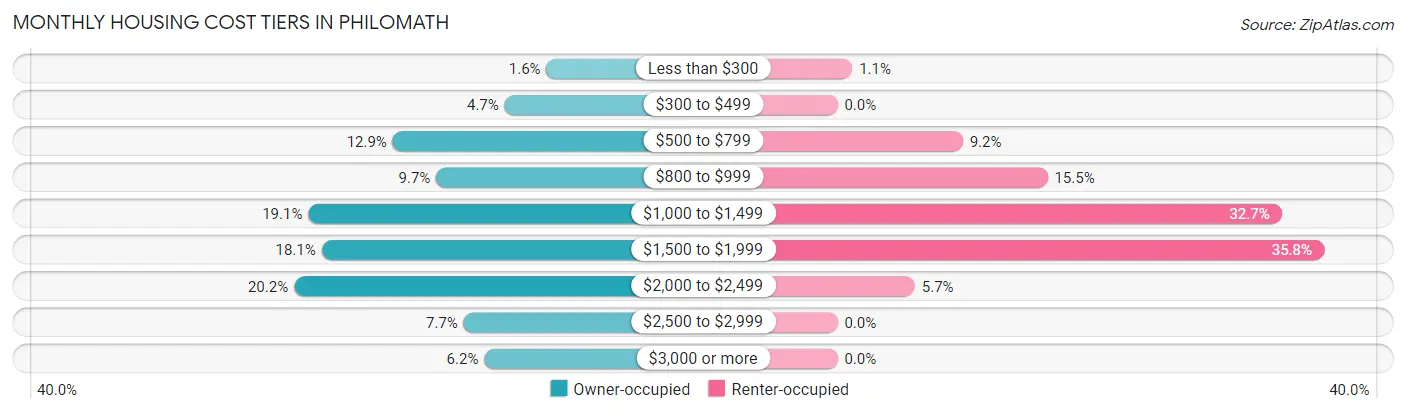
| Monthly Cost | Owner-occupied | Renter-occupied |
| Less than $300 | 24 (1.6%) | 8 (1.1%) |
| $300 to $499 | 71 (4.6%) | 0 (0.0%) |
| $500 to $799 | 197 (12.9%) | 68 (9.2%) |
| $800 to $999 | 148 (9.7%) | 114 (15.5%) |
| $1,000 to $1,499 | 292 (19.1%) | 241 (32.7%) |
| $1,500 to $1,999 | 277 (18.1%) | 264 (35.8%) |
| $2,000 to $2,499 | 308 (20.2%) | 42 (5.7%) |
| $2,500 to $2,999 | 117 (7.7%) | 0 (0.0%) |
| $3,000 or more | 94 (6.1%) | 0 (0.0%) |
| Total | 1,528 (100.0%) | 737 (100.0%) |
Physical Housing Characteristics in Philomath
Housing Structures in Philomath
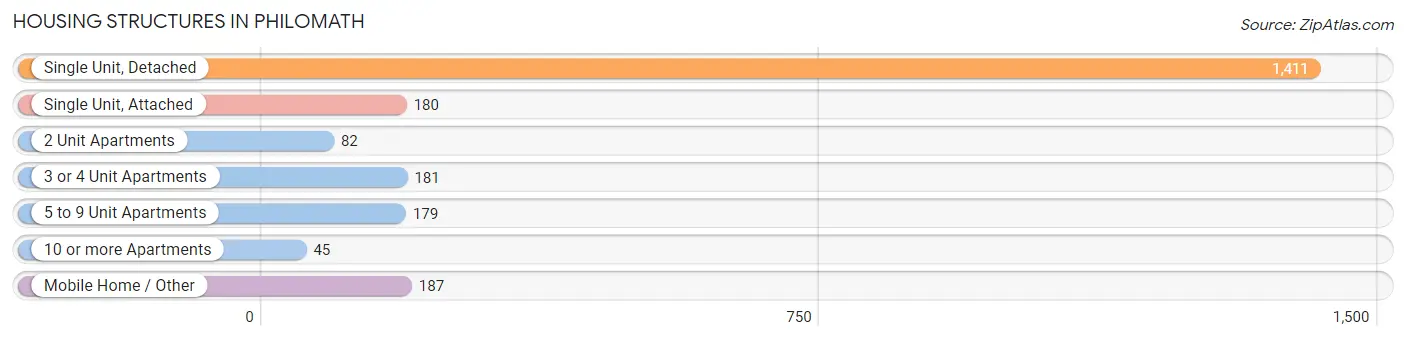
| Structure Type | # Housing Units | % Housing Units |
| Single Unit, Detached | 1,411 | 62.3% |
| Single Unit, Attached | 180 | 8.0% |
| 2 Unit Apartments | 82 | 3.6% |
| 3 or 4 Unit Apartments | 181 | 8.0% |
| 5 to 9 Unit Apartments | 179 | 7.9% |
| 10 or more Apartments | 45 | 2.0% |
| Mobile Home / Other | 187 | 8.3% |
| Total | 2,265 | 100.0% |
Housing Structures by Occupancy in Philomath
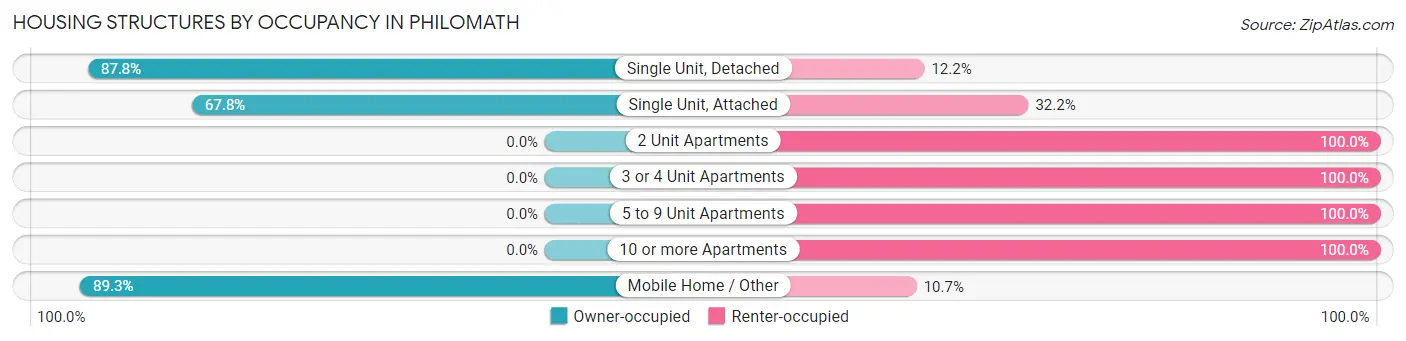
| Structure Type | Owner-occupied | Renter-occupied |
| Single Unit, Detached | 1,239 (87.8%) | 172 (12.2%) |
| Single Unit, Attached | 122 (67.8%) | 58 (32.2%) |
| 2 Unit Apartments | 0 (0.0%) | 82 (100.0%) |
| 3 or 4 Unit Apartments | 0 (0.0%) | 181 (100.0%) |
| 5 to 9 Unit Apartments | 0 (0.0%) | 179 (100.0%) |
| 10 or more Apartments | 0 (0.0%) | 45 (100.0%) |
| Mobile Home / Other | 167 (89.3%) | 20 (10.7%) |
| Total | 1,528 (67.5%) | 737 (32.5%) |
Housing Structures by Number of Rooms in Philomath
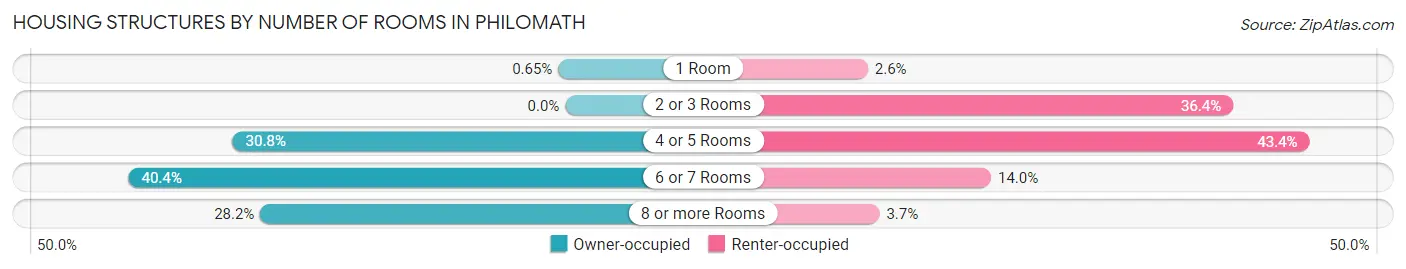
| Number of Rooms | Owner-occupied | Renter-occupied |
| 1 Room | 10 (0.6%) | 19 (2.6%) |
| 2 or 3 Rooms | 0 (0.0%) | 268 (36.4%) |
| 4 or 5 Rooms | 470 (30.8%) | 320 (43.4%) |
| 6 or 7 Rooms | 617 (40.4%) | 103 (14.0%) |
| 8 or more Rooms | 431 (28.2%) | 27 (3.7%) |
| Total | 1,528 (100.0%) | 737 (100.0%) |
Housing Structure by Heating Type in Philomath
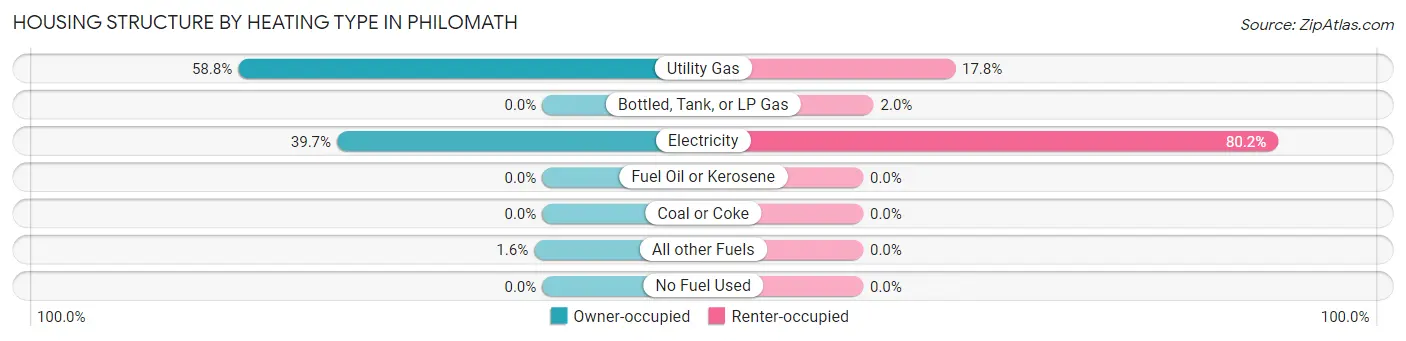
| Heating Type | Owner-occupied | Renter-occupied |
| Utility Gas | 898 (58.8%) | 131 (17.8%) |
| Bottled, Tank, or LP Gas | 0 (0.0%) | 15 (2.0%) |
| Electricity | 606 (39.7%) | 591 (80.2%) |
| Fuel Oil or Kerosene | 0 (0.0%) | 0 (0.0%) |
| Coal or Coke | 0 (0.0%) | 0 (0.0%) |
| All other Fuels | 24 (1.6%) | 0 (0.0%) |
| No Fuel Used | 0 (0.0%) | 0 (0.0%) |
| Total | 1,528 (100.0%) | 737 (100.0%) |
Household Vehicle Usage in Philomath
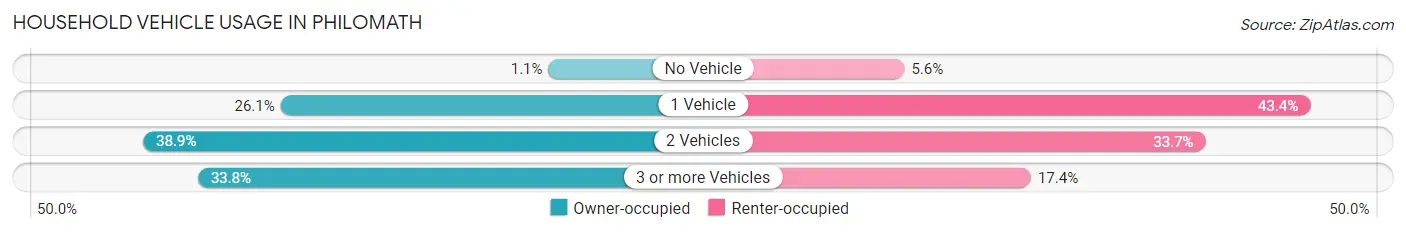
| Vehicles per Household | Owner-occupied | Renter-occupied |
| No Vehicle | 17 (1.1%) | 41 (5.6%) |
| 1 Vehicle | 399 (26.1%) | 320 (43.4%) |
| 2 Vehicles | 595 (38.9%) | 248 (33.7%) |
| 3 or more Vehicles | 517 (33.8%) | 128 (17.4%) |
| Total | 1,528 (100.0%) | 737 (100.0%) |
Real Estate & Mortgages in Philomath
Real Estate and Mortgage Overview in Philomath
| Characteristic | Without Mortgage | With Mortgage |
| Housing Units | 466 | 1,062 |
| Median Property Value | $225,900 | $380,000 |
| Median Household Income | $59,659 | $262 |
| Monthly Housing Costs | $652 | $94 |
| Real Estate Taxes | $3,189 | $32 |
Property Value by Mortgage Status in Philomath
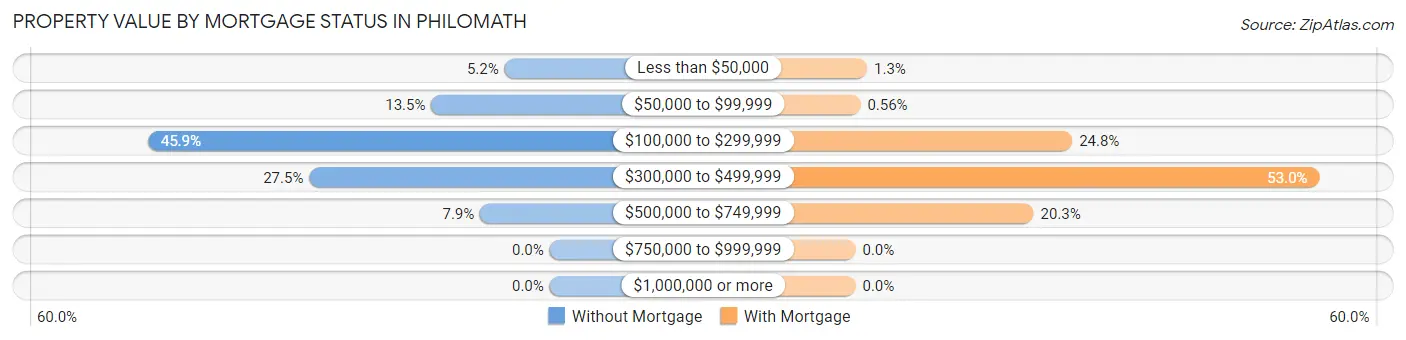
| Property Value | Without Mortgage | With Mortgage |
| Less than $50,000 | 24 (5.1%) | 14 (1.3%) |
| $50,000 to $99,999 | 63 (13.5%) | 6 (0.6%) |
| $100,000 to $299,999 | 214 (45.9%) | 263 (24.8%) |
| $300,000 to $499,999 | 128 (27.5%) | 563 (53.0%) |
| $500,000 to $749,999 | 37 (7.9%) | 216 (20.3%) |
| $750,000 to $999,999 | 0 (0.0%) | 0 (0.0%) |
| $1,000,000 or more | 0 (0.0%) | 0 (0.0%) |
| Total | 466 (100.0%) | 1,062 (100.0%) |
Household Income by Mortgage Status in Philomath
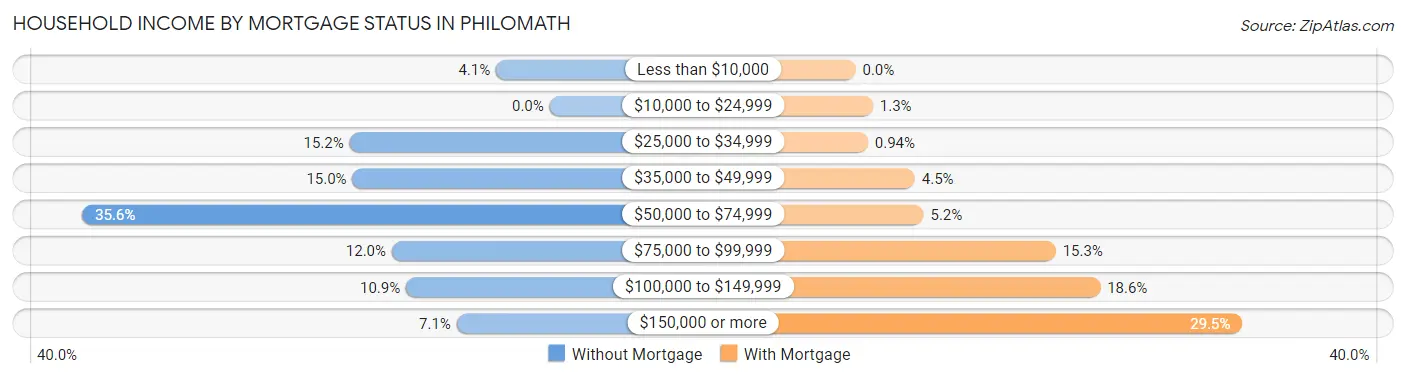
| Household Income | Without Mortgage | With Mortgage |
| Less than $10,000 | 19 (4.1%) | 0 (0.0%) |
| $10,000 to $24,999 | 0 (0.0%) | 14 (1.3%) |
| $25,000 to $34,999 | 71 (15.2%) | 10 (0.9%) |
| $35,000 to $49,999 | 70 (15.0%) | 48 (4.5%) |
| $50,000 to $74,999 | 166 (35.6%) | 55 (5.2%) |
| $75,000 to $99,999 | 56 (12.0%) | 162 (15.2%) |
| $100,000 to $149,999 | 51 (10.9%) | 198 (18.6%) |
| $150,000 or more | 33 (7.1%) | 313 (29.5%) |
| Total | 466 (100.0%) | 1,062 (100.0%) |
Property Value to Household Income Ratio in Philomath
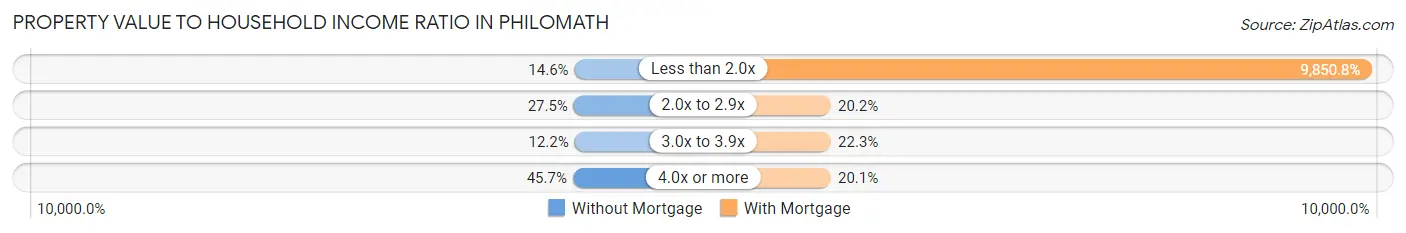
| Value-to-Income Ratio | Without Mortgage | With Mortgage |
| Less than 2.0x | 68 (14.6%) | 104,615 (9,850.7%) |
| 2.0x to 2.9x | 128 (27.5%) | 215 (20.2%) |
| 3.0x to 3.9x | 57 (12.2%) | 237 (22.3%) |
| 4.0x or more | 213 (45.7%) | 213 (20.1%) |
| Total | 466 (100.0%) | 1,062 (100.0%) |
Real Estate Taxes by Mortgage Status in Philomath
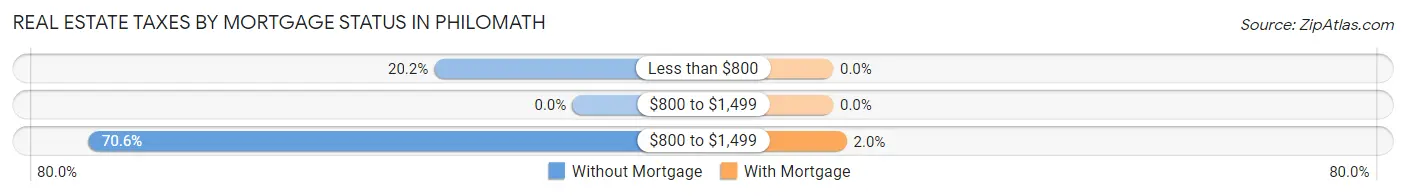
| Property Taxes | Without Mortgage | With Mortgage |
| Less than $800 | 94 (20.2%) | 0 (0.0%) |
| $800 to $1,499 | 0 (0.0%) | 0 (0.0%) |
| $800 to $1,499 | 329 (70.6%) | 21 (2.0%) |
| Total | 466 (100.0%) | 1,062 (100.0%) |
Health & Disability in Philomath
Health Insurance Coverage by Age in Philomath
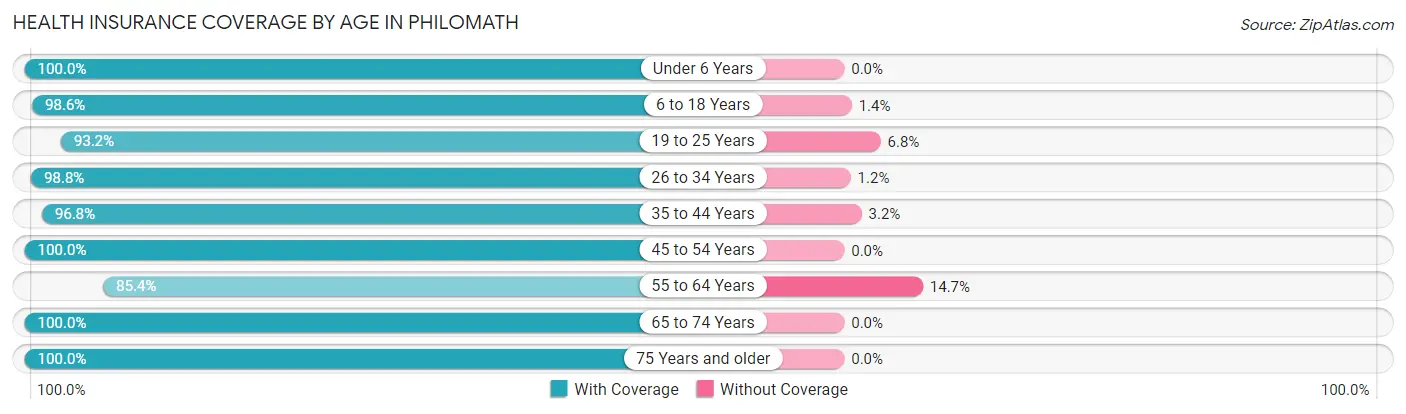
| Age Bracket | With Coverage | Without Coverage |
| Under 6 Years | 243 (100.0%) | 0 (0.0%) |
| 6 to 18 Years | 787 (98.6%) | 11 (1.4%) |
| 19 to 25 Years | 647 (93.2%) | 47 (6.8%) |
| 26 to 34 Years | 833 (98.8%) | 10 (1.2%) |
| 35 to 44 Years | 720 (96.8%) | 24 (3.2%) |
| 45 to 54 Years | 637 (100.0%) | 0 (0.0%) |
| 55 to 64 Years | 501 (85.4%) | 86 (14.6%) |
| 65 to 74 Years | 707 (100.0%) | 0 (0.0%) |
| 75 Years and older | 167 (100.0%) | 0 (0.0%) |
| Total | 5,242 (96.7%) | 178 (3.3%) |
Health Insurance Coverage by Citizenship Status in Philomath
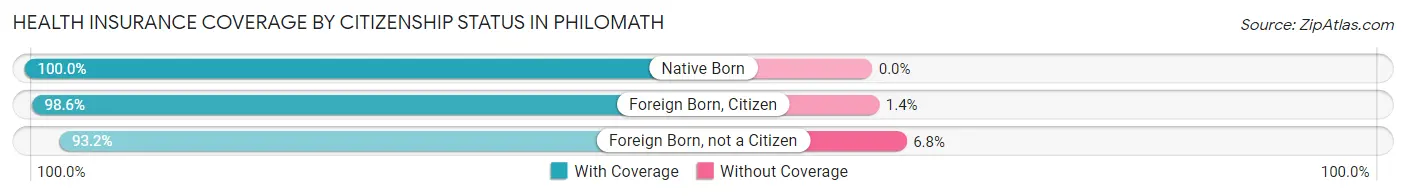
| Citizenship Status | With Coverage | Without Coverage |
| Native Born | 243 (100.0%) | 0 (0.0%) |
| Foreign Born, Citizen | 787 (98.6%) | 11 (1.4%) |
| Foreign Born, not a Citizen | 647 (93.2%) | 47 (6.8%) |
Health Insurance Coverage by Household Income in Philomath
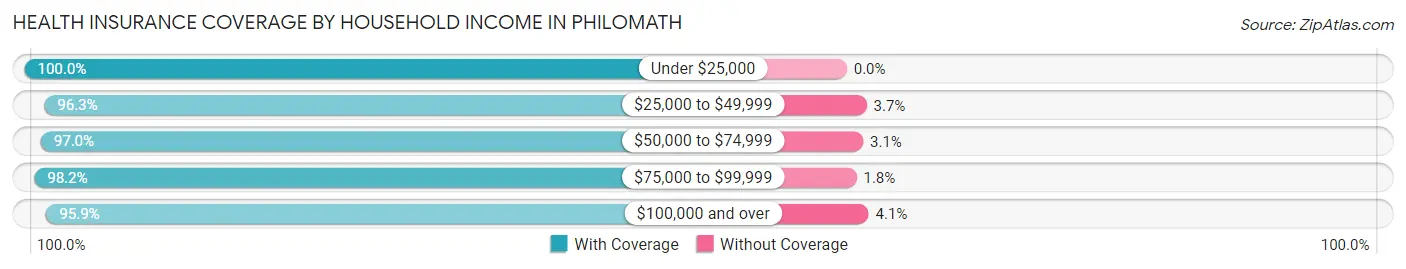
| Household Income | With Coverage | Without Coverage |
| Under $25,000 | 242 (100.0%) | 0 (0.0%) |
| $25,000 to $49,999 | 804 (96.3%) | 31 (3.7%) |
| $50,000 to $74,999 | 827 (97.0%) | 26 (3.0%) |
| $75,000 to $99,999 | 969 (98.2%) | 18 (1.8%) |
| $100,000 and over | 2,390 (95.9%) | 102 (4.1%) |
Public vs Private Health Insurance Coverage by Age in Philomath
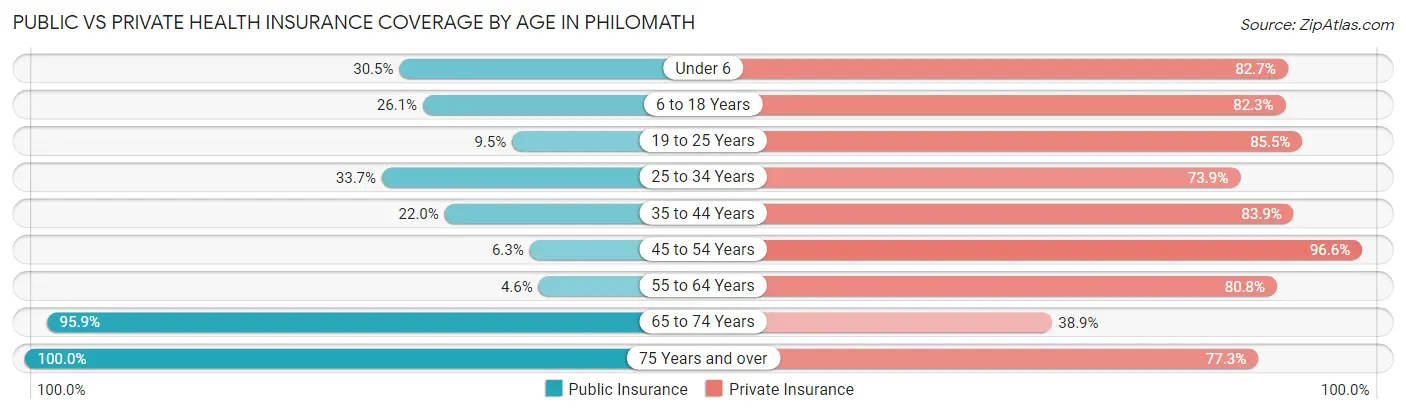
| Age Bracket | Public Insurance | Private Insurance |
| Under 6 | 74 (30.4%) | 201 (82.7%) |
| 6 to 18 Years | 208 (26.1%) | 657 (82.3%) |
| 19 to 25 Years | 66 (9.5%) | 593 (85.5%) |
| 25 to 34 Years | 284 (33.7%) | 623 (73.9%) |
| 35 to 44 Years | 164 (22.0%) | 624 (83.9%) |
| 45 to 54 Years | 40 (6.3%) | 615 (96.6%) |
| 55 to 64 Years | 27 (4.6%) | 474 (80.7%) |
| 65 to 74 Years | 678 (95.9%) | 275 (38.9%) |
| 75 Years and over | 167 (100.0%) | 129 (77.2%) |
| Total | 1,708 (31.5%) | 4,191 (77.3%) |
Disability Status by Sex by Age in Philomath
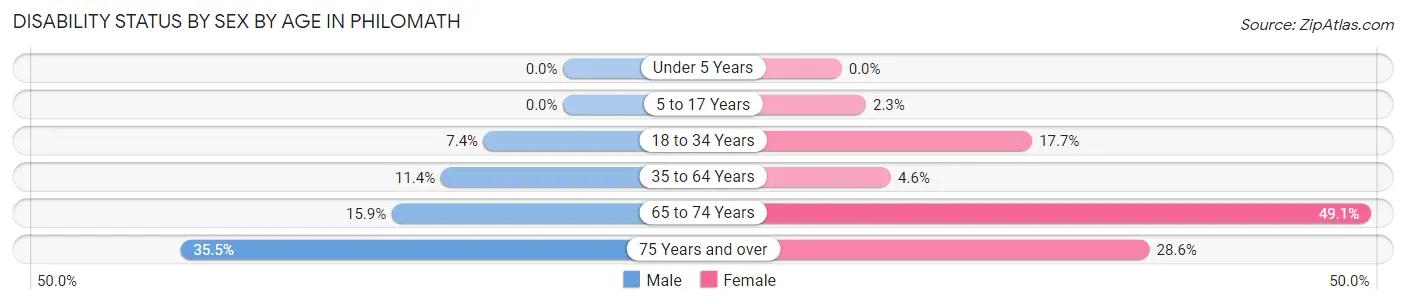
| Age Bracket | Male | Female |
| Under 5 Years | 0 (0.0%) | 0 (0.0%) |
| 5 to 17 Years | 0 (0.0%) | 10 (2.2%) |
| 18 to 34 Years | 64 (7.4%) | 129 (17.7%) |
| 35 to 64 Years | 102 (11.4%) | 49 (4.6%) |
| 65 to 74 Years | 59 (15.9%) | 165 (49.1%) |
| 75 Years and over | 27 (35.5%) | 26 (28.6%) |
Disability Class by Sex by Age in Philomath
Disability Class: Hearing Difficulty
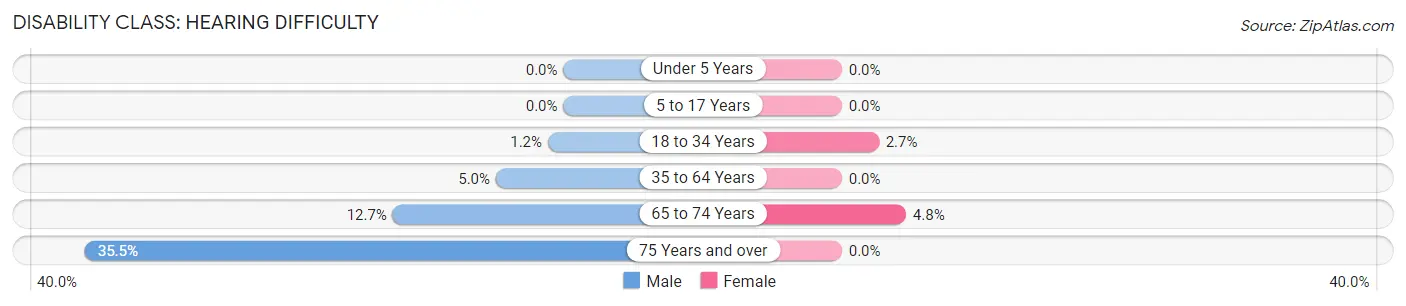
| Age Bracket | Male | Female |
| Under 5 Years | 0 (0.0%) | 0 (0.0%) |
| 5 to 17 Years | 0 (0.0%) | 0 (0.0%) |
| 18 to 34 Years | 10 (1.1%) | 20 (2.7%) |
| 35 to 64 Years | 45 (5.0%) | 0 (0.0%) |
| 65 to 74 Years | 47 (12.7%) | 16 (4.8%) |
| 75 Years and over | 27 (35.5%) | 0 (0.0%) |
Disability Class: Vision Difficulty
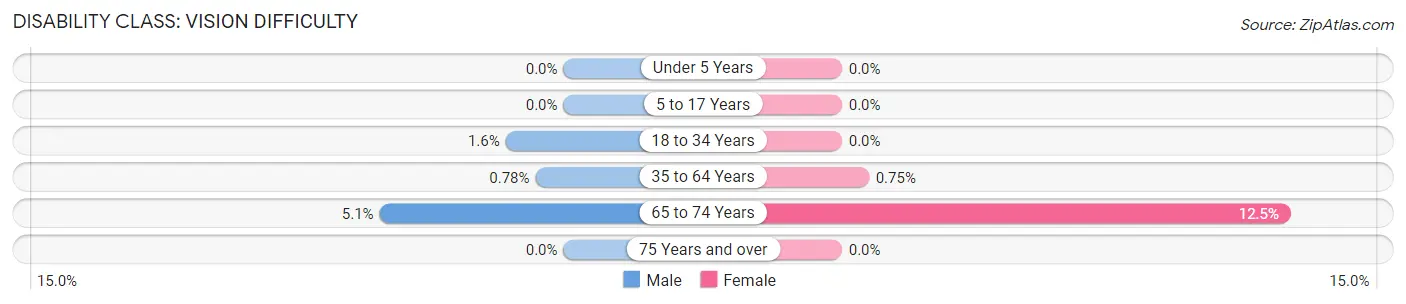
| Age Bracket | Male | Female |
| Under 5 Years | 0 (0.0%) | 0 (0.0%) |
| 5 to 17 Years | 0 (0.0%) | 0 (0.0%) |
| 18 to 34 Years | 14 (1.6%) | 0 (0.0%) |
| 35 to 64 Years | 7 (0.8%) | 8 (0.7%) |
| 65 to 74 Years | 19 (5.1%) | 42 (12.5%) |
| 75 Years and over | 0 (0.0%) | 0 (0.0%) |
Disability Class: Cognitive Difficulty
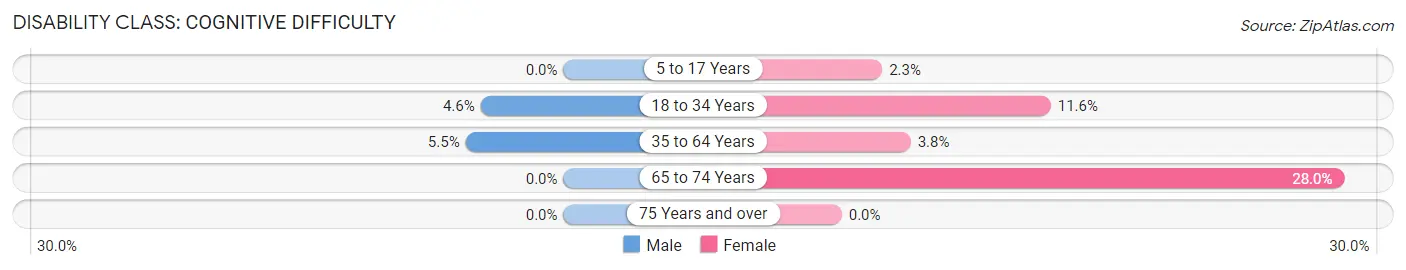
| Age Bracket | Male | Female |
| 5 to 17 Years | 0 (0.0%) | 10 (2.2%) |
| 18 to 34 Years | 40 (4.6%) | 85 (11.6%) |
| 35 to 64 Years | 49 (5.4%) | 41 (3.8%) |
| 65 to 74 Years | 0 (0.0%) | 94 (28.0%) |
| 75 Years and over | 0 (0.0%) | 0 (0.0%) |
Disability Class: Ambulatory Difficulty
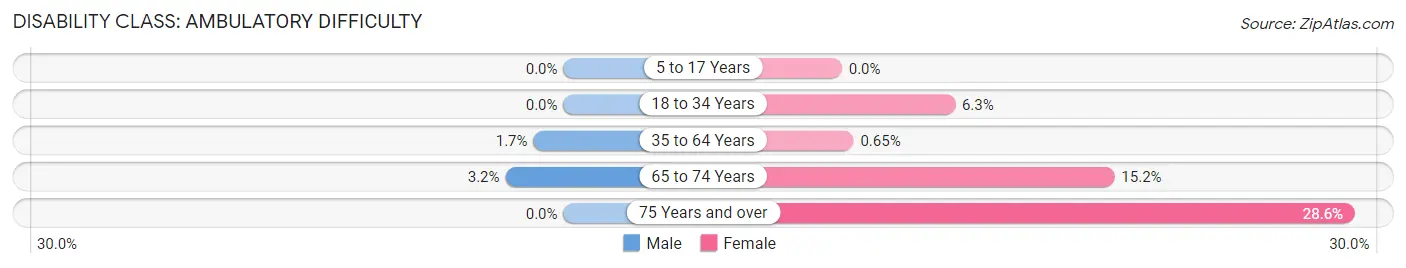
| Age Bracket | Male | Female |
| 5 to 17 Years | 0 (0.0%) | 0 (0.0%) |
| 18 to 34 Years | 0 (0.0%) | 46 (6.3%) |
| 35 to 64 Years | 15 (1.7%) | 7 (0.6%) |
| 65 to 74 Years | 12 (3.2%) | 51 (15.2%) |
| 75 Years and over | 0 (0.0%) | 26 (28.6%) |
Disability Class: Self-Care Difficulty
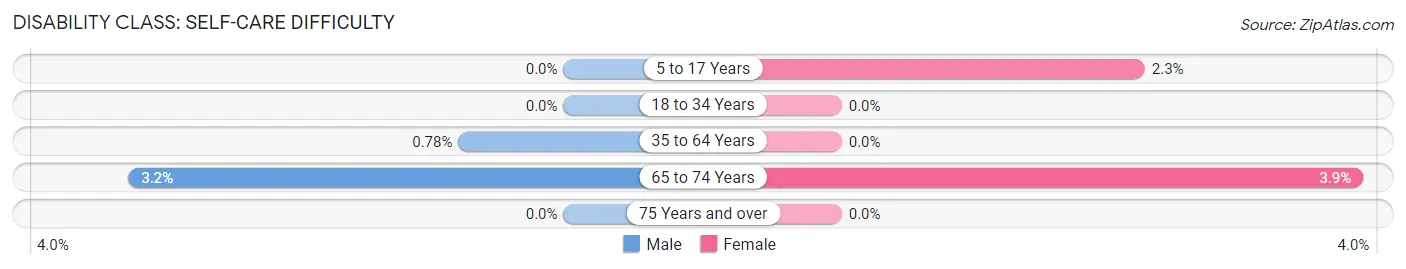
| Age Bracket | Male | Female |
| 5 to 17 Years | 0 (0.0%) | 10 (2.2%) |
| 18 to 34 Years | 0 (0.0%) | 0 (0.0%) |
| 35 to 64 Years | 7 (0.8%) | 0 (0.0%) |
| 65 to 74 Years | 12 (3.2%) | 13 (3.9%) |
| 75 Years and over | 0 (0.0%) | 0 (0.0%) |
Technology Access in Philomath
Computing Device Access in Philomath
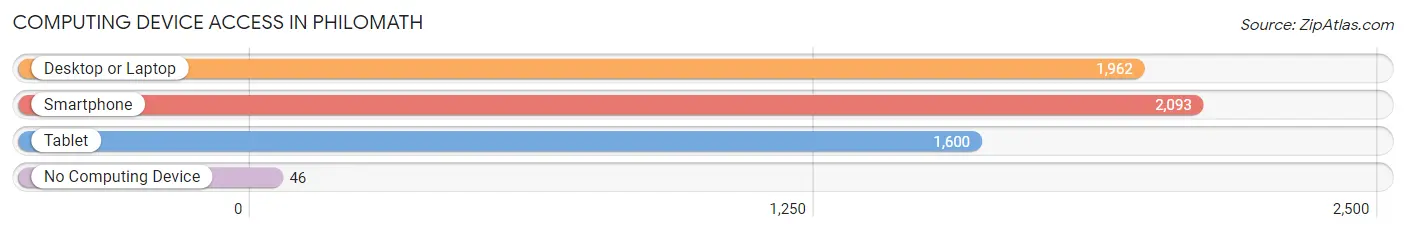
| Device Type | # Households | % Households |
| Desktop or Laptop | 1,962 | 86.6% |
| Smartphone | 2,093 | 92.4% |
| Tablet | 1,600 | 70.6% |
| No Computing Device | 46 | 2.0% |
| Total | 2,265 | 100.0% |
Internet Access in Philomath
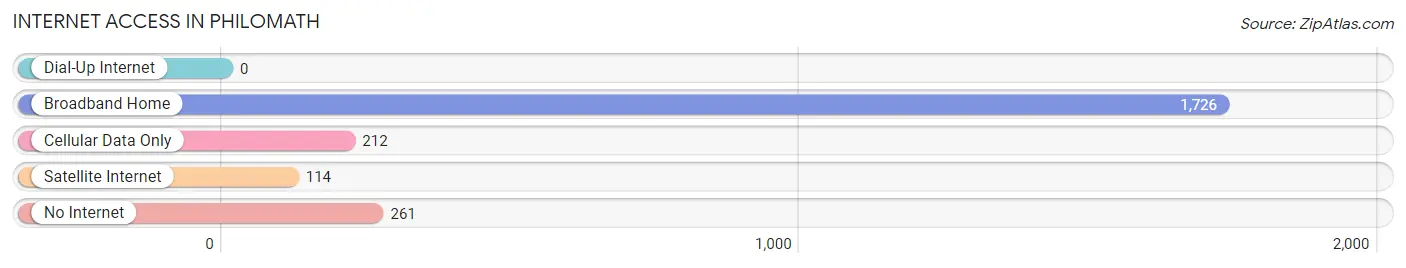
| Internet Type | # Households | % Households |
| Dial-Up Internet | 0 | 0.0% |
| Broadband Home | 1,726 | 76.2% |
| Cellular Data Only | 212 | 9.4% |
| Satellite Internet | 114 | 5.0% |
| No Internet | 261 | 11.5% |
| Total | 2,265 | 100.0% |
Philomath Summary
Philomath, Oregon is a small city located in Benton County, Oregon, United States. It is situated in the Willamette Valley, approximately 15 miles west of Corvallis and 45 miles south of Portland. The city is home to a population of 4,584 people, according to the 2010 census.
History
The area that is now Philomath was originally inhabited by the Kalapuya Native American tribe. The first European settlers arrived in the area in the early 1840s, and the town was officially founded in 1866. The name Philomath is derived from the Greek words “philos” and “mathos”, which mean “love of learning”.
The town was originally a farming community, and the first post office was established in 1867. The town was incorporated in 1882, and the first school was built in 1883. The town grew slowly over the years, and by the 1950s, it had a population of around 1,000 people.
Geography
Philomath is located in the Willamette Valley, approximately 15 miles west of Corvallis and 45 miles south of Portland. The city is situated on the banks of the Marys River, which flows through the city. The city is surrounded by rolling hills and is located in a temperate climate zone.
The city covers an area of 2.3 square miles, and the elevation is approximately 200 feet above sea level. The city is located in the Pacific Time Zone and observes Daylight Saving Time.
Economy
The economy of Philomath is largely based on agriculture and manufacturing. The city is home to several large agricultural businesses, including a dairy farm, a winery, and a fruit orchard. The city is also home to several manufacturing companies, including a wood products company and a metal fabrication company.
The city is also home to several retail businesses, including a grocery store, a hardware store, and several restaurants. The city is also home to several professional services businesses, including a law firm, an accounting firm, and a real estate agency.
Demographics
According to the 2010 census, the population of Philomath was 4,584 people. The racial makeup of the city was 94.3% White, 0.7% African American, 0.7% Native American, 0.7% Asian, 0.2% Pacific Islander, 1.2% from other races, and 2.1% from two or more races. Hispanic or Latino of any race were 3.2% of the population.
The median household income in Philomath was $45,938, and the median family income was $51,938. The per capita income was $20,938. About 11.2% of families and 14.2% of the population were below the poverty line, including 18.2% of those under age 18 and 8.2% of those age 65 or over.
The city is served by the Philomath School District, which includes two elementary schools, one middle school, and one high school. The city is also home to a branch of the Benton County Library System. The city is served by the Corvallis-Benton County Public Library.
Common Questions
What is Per Capita Income in Philomath?
Per Capita income in Philomath is $39,415.
What is the Median Family Income in Philomath?
Median Family Income in Philomath is $89,730.
What is the Median Household income in Philomath?
Median Household Income in Philomath is $80,599.
What is Income or Wage Gap in Philomath?
Income or Wage Gap in Philomath is 19.2%.
Women in Philomath earn 80.8 cents for every dollar earned by a man.
What is Inequality or Gini Index in Philomath?
Inequality or Gini Index in Philomath is 0.38.
What is the Total Population of Philomath?
Total Population of Philomath is 5,429.
What is the Total Male Population of Philomath?
Total Male Population of Philomath is 2,672.
What is the Total Female Population of Philomath?
Total Female Population of Philomath is 2,757.
What is the Ratio of Males per 100 Females in Philomath?
There are 96.92 Males per 100 Females in Philomath.
What is the Ratio of Females per 100 Males in Philomath?
There are 103.18 Females per 100 Males in Philomath.
What is the Median Population Age in Philomath?
Median Population Age in Philomath is 36.8 Years.
What is the Average Family Size in Philomath
Average Family Size in Philomath is 2.9 People.
What is the Average Household Size in Philomath
Average Household Size in Philomath is 2.4 People.
How Large is the Labor Force in Philomath?
There are 3,362 People in the Labor Forcein in Philomath.
What is the Percentage of People in the Labor Force in Philomath?
73.9% of People are in the Labor Force in Philomath.
What is the Unemployment Rate in Philomath?
Unemployment Rate in Philomath is 3.8%.