Cities with the Largest Liberian Community in the United States
RELATED REPORTS & OPTIONS
Liberian
United States
Compare Cities
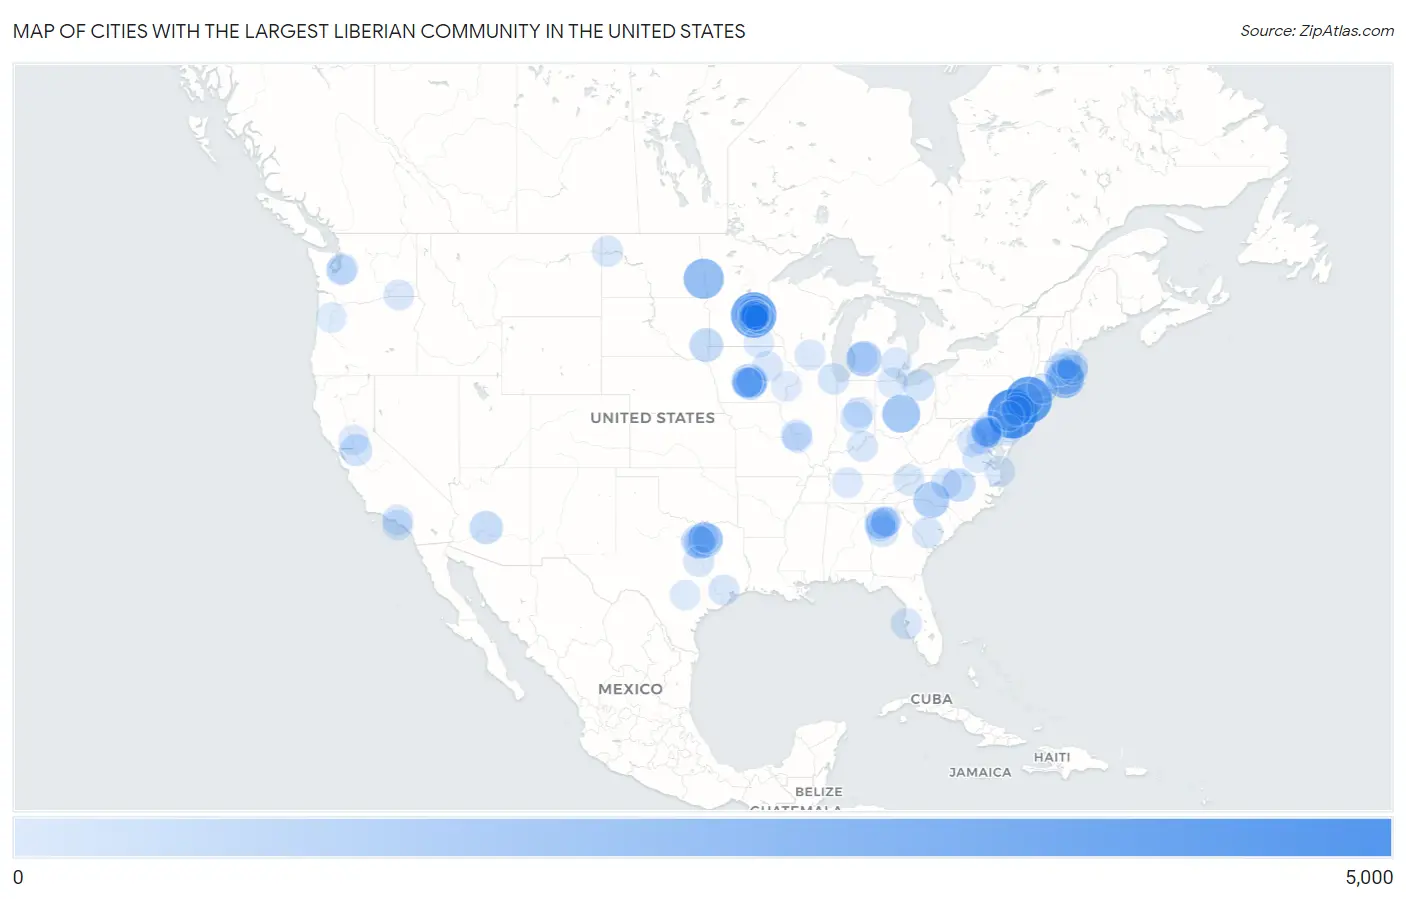
Map of Cities with the Largest Liberian Community in the United States
0
5,000
Cities with the Largest Liberian Community in the United States
| City | Liberian | vs State | vs National | |
| 1. | Philadelphia | 4,896 | 10,832(45.20%)#1 | 92,606(5.29%)#1 |
| 2. | New York | 4,124 | 4,861(84.84%)#1 | 92,606(4.45%)#2 |
| 3. | Brooklyn Park | 3,857 | 14,080(27.39%)#1 | 92,606(4.16%)#3 |
| 4. | Brooklyn Center | 2,580 | 14,080(18.32%)#2 | 92,606(2.79%)#4 |
| 5. | Fargo | 2,569 | 3,156(81.40%)#1 | 92,606(2.77%)#5 |
| 6. | Providence | 2,178 | 3,646(59.74%)#1 | 92,606(2.35%)#6 |
| 7. | Columbus | 2,000 | 3,345(59.79%)#1 | 92,606(2.16%)#7 |
| 8. | Charlotte | 1,495 | 3,769(39.67%)#1 | 92,606(1.61%)#8 |
| 9. | Kentwood | 1,409 | 2,448(57.56%)#1 | 92,606(1.52%)#9 |
| 10. | Dallas | 1,364 | 5,749(23.73%)#1 | 92,606(1.47%)#10 |
| 11. | Johnston | 1,224 | 3,682(33.24%)#1 | 92,606(1.32%)#11 |
| 12. | New Hope | 1,218 | 14,080(8.65%)#3 | 92,606(1.32%)#12 |
| 13. | Maple Grove | 1,198 | 14,080(8.51%)#4 | 92,606(1.29%)#13 |
| 14. | Pawtucket | 1,095 | 3,646(30.03%)#2 | 92,606(1.18%)#14 |
| 15. | Sioux Falls | 978 | 978(100.00%)#1 | 92,606(1.06%)#15 |
| 16. | Newark | 920 | 6,055(15.19%)#1 | 92,606(0.99%)#16 |
| 17. | Darby Borough | 905 | 10,832(8.35%)#2 | 92,606(0.98%)#17 |
| 18. | Durham | 878 | 3,769(23.30%)#2 | 92,606(0.95%)#18 |
| 19. | Phoenix | 843 | 1,376(61.26%)#1 | 92,606(0.91%)#19 |
| 20. | Fort Worth | 739 | 5,749(12.85%)#2 | 92,606(0.80%)#20 |
| 21. | Trenton | 726 | 6,055(11.99%)#2 | 92,606(0.78%)#21 |
| 22. | Arlington | 725 | 5,749(12.61%)#3 | 92,606(0.78%)#22 |
| 23. | Des Moines | 717 | 3,682(19.47%)#2 | 92,606(0.77%)#23 |
| 24. | Worcester | 584 | 2,721(21.46%)#1 | 92,606(0.63%)#24 |
| 25. | Chamblee | 547 | 4,385(12.47%)#1 | 92,606(0.59%)#25 |
| 26. | Stockton | 546 | 2,670(20.45%)#1 | 92,606(0.59%)#26 |
| 27. | Cleveland | 487 | 3,345(14.56%)#2 | 92,606(0.53%)#27 |
| 28. | Indianapolis | 479 | 963(49.74%)#1 | 92,606(0.52%)#28 |
| 29. | Lynn | 479 | 2,721(17.60%)#2 | 92,606(0.52%)#29 |
| 30. | Minneapolis | 440 | 14,080(3.12%)#5 | 92,606(0.48%)#30 |
| 31. | Rising Sun Lebanon | 438 | 1,009(43.41%)#1 | 92,606(0.47%)#31 |
| 32. | Chicago | 436 | 710(61.41%)#1 | 92,606(0.47%)#32 |
| 33. | St Paul | 434 | 14,080(3.08%)#6 | 92,606(0.47%)#33 |
| 34. | Lansdowne Borough | 407 | 10,832(3.76%)#3 | 92,606(0.44%)#34 |
| 35. | Hampton | 380 | 4,385(8.67%)#2 | 92,606(0.41%)#35 |
| 36. | Lowell | 365 | 2,721(13.41%)#3 | 92,606(0.39%)#36 |
| 37. | Bondurant | 360 | 3,682(9.78%)#3 | 92,606(0.39%)#37 |
| 38. | Altoona | 359 | 3,682(9.75%)#4 | 92,606(0.39%)#38 |
| 39. | Lakeland North | 359 | 1,386(25.90%)#1 | 92,606(0.39%)#39 |
| 40. | Champlin | 357 | 14,080(2.54%)#7 | 92,606(0.39%)#40 |
| 41. | Williston | 355 | 3,156(11.25%)#2 | 92,606(0.38%)#41 |
| 42. | Denmark | 352 | 464(75.86%)#1 | 92,606(0.38%)#42 |
| 43. | Johnson City | 337 | 868(38.82%)#1 | 92,606(0.36%)#43 |
| 44. | St Petersburg | 335 | 1,229(27.26%)#1 | 92,606(0.36%)#44 |
| 45. | Woodbridge | 332 | 2,297(14.45%)#1 | 92,606(0.36%)#45 |
| 46. | Louisville | 329 | 547(60.15%)#1 | 92,606(0.36%)#46 |
| 47. | Andover | 315 | 14,080(2.24%)#8 | 92,606(0.34%)#47 |
| 48. | Houston | 307 | 5,749(5.34%)#4 | 92,606(0.33%)#48 |
| 49. | Waco | 303 | 5,749(5.27%)#5 | 92,606(0.33%)#49 |
| 50. | Greensboro | 299 | 3,769(7.93%)#3 | 92,606(0.32%)#50 |
| 51. | Baltimore | 296 | 4,304(6.88%)#1 | 92,606(0.32%)#51 |
| 52. | Hazelwood | 291 | 801(36.33%)#1 | 92,606(0.31%)#52 |
| 53. | Boston | 288 | 2,721(10.58%)#4 | 92,606(0.31%)#53 |
| 54. | Chillum | 282 | 4,304(6.55%)#2 | 92,606(0.30%)#54 |
| 55. | Hopkins | 282 | 14,080(2.00%)#9 | 92,606(0.30%)#55 |
| 56. | Los Angeles | 271 | 2,670(10.15%)#2 | 92,606(0.29%)#56 |
| 57. | Rancho Palos Verdes | 266 | 2,670(9.96%)#3 | 92,606(0.29%)#57 |
| 58. | Walla Walla | 262 | 1,386(18.90%)#2 | 92,606(0.28%)#58 |
| 59. | Culpeper | 259 | 2,297(11.28%)#2 | 92,606(0.28%)#59 |
| 60. | Tuckahoe | 258 | 2,297(11.23%)#3 | 92,606(0.28%)#60 |
| 61. | University Cdp Orange County | 258 | 1,229(20.99%)#2 | 92,606(0.28%)#61 |
| 62. | East Point | 256 | 4,385(5.84%)#3 | 92,606(0.28%)#62 |
| 63. | Prospect Park Borough | 256 | 10,832(2.36%)#4 | 92,606(0.28%)#63 |
| 64. | Waterloo | 254 | 3,682(6.90%)#5 | 92,606(0.27%)#64 |
| 65. | Sharon Hill Borough | 250 | 10,832(2.31%)#5 | 92,606(0.27%)#65 |
| 66. | Atlanta | 241 | 4,385(5.50%)#4 | 92,606(0.26%)#66 |
| 67. | Virginia Beach | 237 | 2,297(10.32%)#4 | 92,606(0.26%)#67 |
| 68. | St Louis | 231 | 801(28.84%)#2 | 92,606(0.25%)#68 |
| 69. | Madison | 231 | 571(40.46%)#1 | 92,606(0.25%)#69 |
| 70. | Nashville | 228 | 868(26.27%)#2 | 92,606(0.25%)#70 |
| 71. | Pontiac | 226 | 2,448(9.23%)#2 | 92,606(0.24%)#71 |
| 72. | Bloomington | 222 | 14,080(1.58%)#10 | 92,606(0.24%)#72 |
| 73. | Urbandale | 222 | 3,682(6.03%)#6 | 92,606(0.24%)#73 |
| 74. | Noblesville | 219 | 963(22.74%)#2 | 92,606(0.24%)#74 |
| 75. | Garland | 216 | 5,749(3.76%)#6 | 92,606(0.23%)#75 |
| 76. | Bowie | 214 | 4,304(4.97%)#3 | 92,606(0.23%)#76 |
| 77. | Landover | 213 | 4,304(4.95%)#4 | 92,606(0.23%)#77 |
| 78. | Carrollton | 212 | 5,749(3.69%)#7 | 92,606(0.23%)#78 |
| 79. | Plymouth | 209 | 14,080(1.48%)#11 | 92,606(0.23%)#79 |
| 80. | Washington | 208 | 208(100.00%)#1 | 92,606(0.22%)#80 |
| 81. | Silver Spring | 201 | 4,304(4.67%)#5 | 92,606(0.22%)#81 |
| 82. | Colwyn Borough | 199 | 10,832(1.84%)#6 | 92,606(0.21%)#82 |
| 83. | Sacramento | 198 | 2,670(7.42%)#4 | 92,606(0.21%)#83 |
| 84. | Crystal | 197 | 14,080(1.40%)#12 | 92,606(0.21%)#84 |
| 85. | Toledo | 195 | 3,345(5.83%)#3 | 92,606(0.21%)#85 |
| 86. | Austin | 192 | 14,080(1.36%)#13 | 92,606(0.21%)#86 |
| 87. | Muscatine | 192 | 3,682(5.21%)#7 | 92,606(0.21%)#87 |
| 88. | Salem | 189 | 458(41.27%)#1 | 92,606(0.20%)#88 |
| 89. | Woodbury | 189 | 14,080(1.34%)#14 | 92,606(0.20%)#89 |
| 90. | Ansonia | 185 | 514(35.99%)#1 | 92,606(0.20%)#90 |
| 91. | Grand Rapids | 183 | 2,448(7.48%)#3 | 92,606(0.20%)#91 |
| 92. | Lawrenceville | 182 | 4,385(4.15%)#5 | 92,606(0.20%)#92 |
| 93. | Cibolo | 179 | 5,749(3.11%)#8 | 92,606(0.19%)#93 |
| 94. | New Brighton | 178 | 14,080(1.26%)#15 | 92,606(0.19%)#94 |
| 95. | Lilburn | 175 | 4,385(3.99%)#6 | 92,606(0.19%)#95 |
| 96. | Clive | 174 | 3,682(4.73%)#8 | 92,606(0.19%)#96 |
| 97. | Fridley | 173 | 14,080(1.23%)#16 | 92,606(0.19%)#97 |
| 98. | Federal Way | 169 | 1,386(12.19%)#3 | 92,606(0.18%)#98 |
| 99. | Burlington | 169 | 6,055(2.79%)#3 | 92,606(0.18%)#99 |
| 100. | Boothwyn | 169 | 10,832(1.56%)#7 | 92,606(0.18%)#100 |
Common Questions
What are the Top 10 Cities with the Largest Liberian Community in the United States?
Top 10 Cities with the Largest Liberian Community in the United States are:
#1
4,896
#2
4,124
#3
3,857
#4
2,580
#5
2,569
#6
2,178
#7
2,000
#8
1,495
#9
1,409
#10
1,364
What city has the Largest Liberian Community in the United States?
Philadelphia has the Largest Liberian Community in the United States with 4,896.
What is the Total Liberian Population in the United States?
Total Liberian Population in the United States is 92,606.