Cities with the Highest Percentage of Vietnamese Population in the United States
RELATED REPORTS & OPTIONS
Vietnamese
United States
Compare Cities
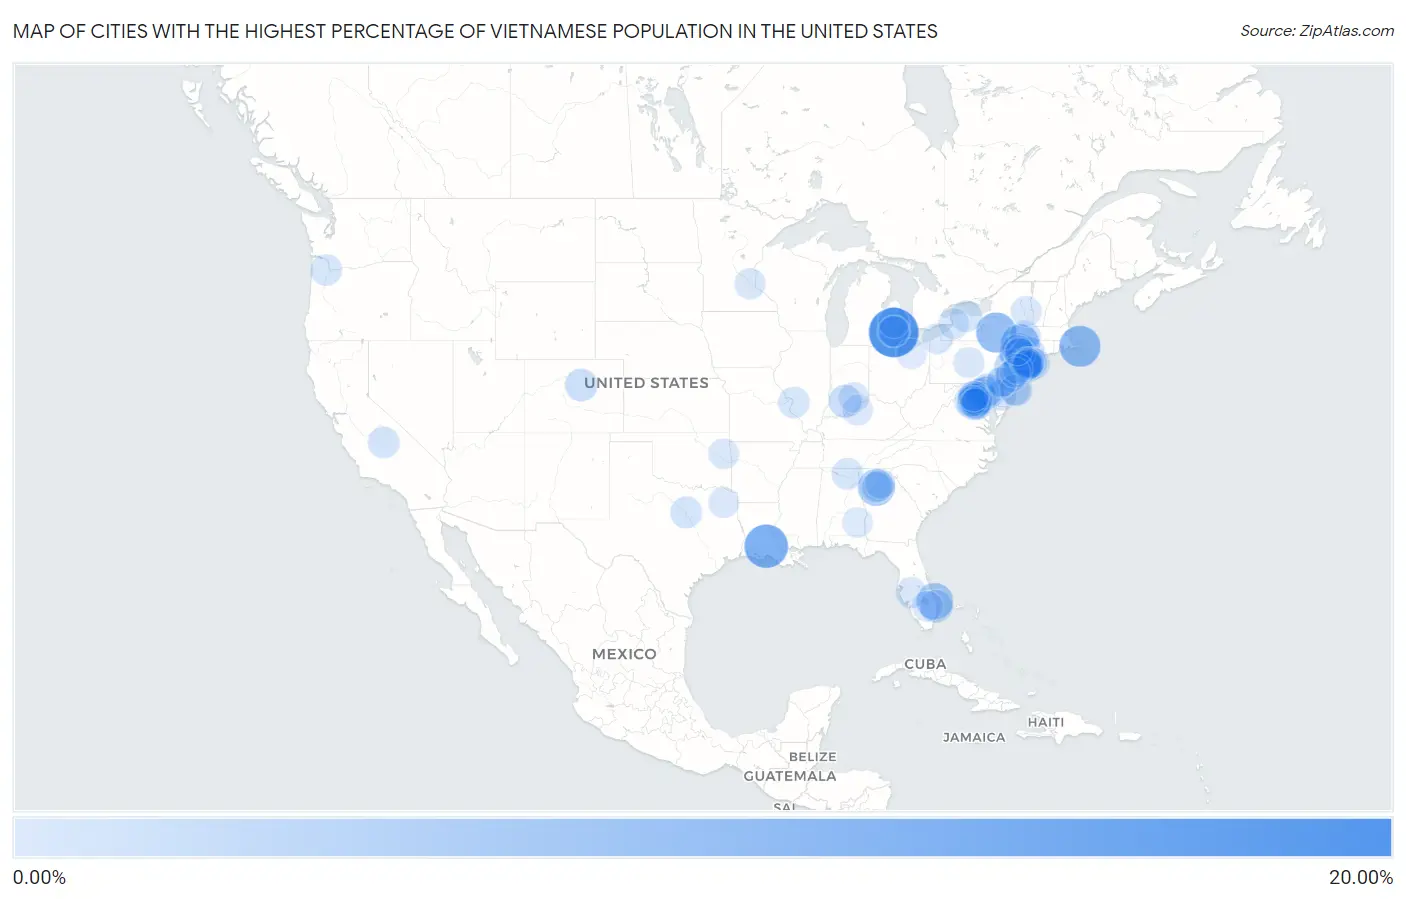
Map of Cities with the Highest Percentage of Vietnamese Population in the United States
0.00%
20.00%
Cities with the Highest Percentage of Vietnamese Population in the United States
| City | Vietnamese | vs State | vs National | |
| 1. | Hamtramck | 17.42% | 0.15%(+17.3)#1 | 0.071%(+17.3)#1 |
| 2. | Kincora | 15.46% | 0.13%(+15.3)#1 | 0.071%(+15.4)#2 |
| 3. | Sunset | 12.18% | 0.019%(+12.2)#1 | 0.071%(+12.1)#3 |
| 4. | West Chatham | 9.92% | 0.062%(+9.86)#1 | 0.071%(+9.85)#4 |
| 5. | Smithville Flats | 9.30% | 0.52%(+8.78)#1 | 0.071%(+9.23)#5 |
| 6. | Stone Ridge | 8.21% | 0.52%(+7.69)#2 | 0.071%(+8.14)#6 |
| 7. | Chester | 8.12% | 0.52%(+7.60)#3 | 0.071%(+8.05)#7 |
| 8. | Greenvale | 6.70% | 0.52%(+6.18)#4 | 0.071%(+6.63)#8 |
| 9. | Doraville | 6.39% | 0.063%(+6.33)#1 | 0.071%(+6.32)#9 |
| 10. | Limestone Creek | 6.23% | 0.038%(+6.19)#1 | 0.071%(+6.16)#10 |
| 11. | Potomac Mills | 5.15% | 0.13%(+5.01)#2 | 0.071%(+5.07)#11 |
| 12. | Millbourne Borough | 4.49% | 0.055%(+4.44)#1 | 0.071%(+4.42)#12 |
| 13. | Lansdale Borough | 4.04% | 0.055%(+3.99)#2 | 0.071%(+3.97)#13 |
| 14. | Rutledge Borough | 4.01% | 0.055%(+3.95)#3 | 0.071%(+3.94)#14 |
| 15. | Searingtown | 3.85% | 0.52%(+3.33)#5 | 0.071%(+3.78)#15 |
| 16. | White House Station | 3.72% | 0.12%(+3.60)#1 | 0.071%(+3.65)#16 |
| 17. | Manhasset Hills | 3.66% | 0.52%(+3.14)#6 | 0.071%(+3.59)#17 |
| 18. | Garden City Park | 3.61% | 0.52%(+3.09)#7 | 0.071%(+3.54)#18 |
| 19. | Edgemere | 3.38% | 0.098%(+3.28)#1 | 0.071%(+3.31)#19 |
| 20. | Rossville | 3.24% | 0.098%(+3.14)#2 | 0.071%(+3.17)#20 |
| 21. | Westgate | 3.21% | 0.038%(+3.18)#2 | 0.071%(+3.14)#21 |
| 22. | Merrifield | 3.17% | 0.13%(+3.03)#3 | 0.071%(+3.10)#22 |
| 23. | Mitchell | 3.14% | 0.025%(+3.12)#1 | 0.071%(+3.07)#23 |
| 24. | Albertson | 3.02% | 0.52%(+2.50)#8 | 0.071%(+2.95)#24 |
| 25. | Sheridan | 2.87% | 0.0084%(+2.86)#1 | 0.071%(+2.80)#25 |
| 26. | Atlantic City | 2.86% | 0.12%(+2.73)#2 | 0.071%(+2.78)#26 |
| 27. | Oak Grove | 2.72% | 0.13%(+2.59)#4 | 0.071%(+2.65)#27 |
| 28. | Warren | 2.64% | 0.15%(+2.49)#2 | 0.071%(+2.57)#28 |
| 29. | Hi Nella Borough | 2.60% | 0.12%(+2.48)#3 | 0.071%(+2.53)#29 |
| 30. | Forsgate | 2.57% | 0.12%(+2.44)#4 | 0.071%(+2.49)#30 |
| 31. | Peach Lake | 2.52% | 0.52%(+2.00)#9 | 0.071%(+2.45)#31 |
| 32. | Woodburn | 2.50% | 0.13%(+2.37)#5 | 0.071%(+2.43)#32 |
| 33. | Paterson | 2.28% | 0.12%(+2.16)#5 | 0.071%(+2.21)#33 |
| 34. | Bogota Borough | 2.26% | 0.12%(+2.14)#6 | 0.071%(+2.19)#34 |
| 35. | New Baltimore | 2.21% | 0.13%(+2.08)#6 | 0.071%(+2.14)#35 |
| 36. | Pecan Plantation | 2.19% | 0.046%(+2.14)#1 | 0.071%(+2.12)#36 |
| 37. | The University Of Virginia's College At Wise | 2.15% | 0.13%(+2.02)#7 | 0.071%(+2.08)#37 |
| 38. | Woodbridge | 2.14% | 0.13%(+2.01)#8 | 0.071%(+2.07)#38 |
| 39. | Roebling | 2.07% | 0.12%(+1.95)#7 | 0.071%(+2.00)#39 |
| 40. | Goose Creek | 2.06% | 0.13%(+1.92)#9 | 0.071%(+1.99)#40 |
| 41. | Three Rivers | 2.04% | 0.041%(+2.00)#1 | 0.071%(+1.97)#41 |
| 42. | Linthicum | 2.04% | 0.098%(+1.94)#3 | 0.071%(+1.97)#42 |
| 43. | Florence | 1.95% | 0.12%(+1.83)#8 | 0.071%(+1.88)#43 |
| 44. | Berwyn Heights | 1.93% | 0.098%(+1.83)#4 | 0.071%(+1.86)#44 |
| 45. | Clarkson | 1.93% | 0.52%(+1.41)#10 | 0.071%(+1.86)#45 |
| 46. | Paint Rock | 1.92% | 0.013%(+1.91)#1 | 0.071%(+1.85)#46 |
| 47. | North Plains | 1.90% | 0.016%(+1.89)#1 | 0.071%(+1.83)#47 |
| 48. | Valley Cottage | 1.90% | 0.52%(+1.37)#11 | 0.071%(+1.83)#48 |
| 49. | Fairmont City | 1.88% | 0.022%(+1.86)#1 | 0.071%(+1.81)#49 |
| 50. | Nazareth College | 1.87% | 0.52%(+1.35)#12 | 0.071%(+1.80)#50 |
| 51. | Vails Gate | 1.84% | 0.52%(+1.31)#13 | 0.071%(+1.77)#51 |
| 52. | Ashton Sandy Spring | 1.83% | 0.098%(+1.73)#5 | 0.071%(+1.76)#52 |
| 53. | Hutchison | 1.78% | 0.13%(+1.65)#10 | 0.071%(+1.71)#53 |
| 54. | Hudson | 1.77% | 0.52%(+1.25)#14 | 0.071%(+1.70)#54 |
| 55. | Highland Acres | 1.72% | 0.11%(+1.61)#1 | 0.071%(+1.65)#55 |
| 56. | Prospect Park Borough | 1.70% | 0.12%(+1.57)#9 | 0.071%(+1.63)#56 |
| 57. | South Huntington | 1.70% | 0.52%(+1.17)#15 | 0.071%(+1.63)#57 |
| 58. | East Hills | 1.67% | 0.52%(+1.15)#16 | 0.071%(+1.60)#58 |
| 59. | Almont | 1.66% | 0.15%(+1.51)#3 | 0.071%(+1.59)#59 |
| 60. | Hatfield Borough | 1.63% | 0.055%(+1.58)#4 | 0.071%(+1.56)#60 |
| 61. | Chamblee | 1.61% | 0.063%(+1.54)#2 | 0.071%(+1.54)#61 |
| 62. | Lilydale | 1.58% | 0.024%(+1.55)#1 | 0.071%(+1.51)#62 |
| 63. | Zolfo Springs | 1.53% | 0.038%(+1.50)#3 | 0.071%(+1.46)#63 |
| 64. | Houserville | 1.53% | 0.055%(+1.47)#5 | 0.071%(+1.46)#64 |
| 65. | Norcross | 1.51% | 0.063%(+1.44)#3 | 0.071%(+1.43)#65 |
| 66. | Glenview Manor | 1.46% | 0.0040%(+1.45)#1 | 0.071%(+1.39)#66 |
| 67. | Mountain Lodge Park | 1.44% | 0.52%(+0.915)#17 | 0.071%(+1.37)#67 |
| 68. | Pittsburg | 1.44% | 0.046%(+1.39)#2 | 0.071%(+1.37)#68 |
| 69. | Harriman | 1.42% | 0.52%(+0.897)#18 | 0.071%(+1.35)#69 |
| 70. | Warrensburg | 1.42% | 0.52%(+0.896)#19 | 0.071%(+1.35)#70 |
| 71. | Hewlett Neck | 1.40% | 0.52%(+0.879)#20 | 0.071%(+1.33)#71 |
| 72. | Chantilly | 1.40% | 0.13%(+1.27)#11 | 0.071%(+1.33)#72 |
| 73. | Ronkonkoma | 1.38% | 0.52%(+0.855)#21 | 0.071%(+1.31)#73 |
| 74. | Northfield | 1.38% | 0.12%(+1.25)#10 | 0.071%(+1.30)#74 |
| 75. | Belle Glade | 1.37% | 0.038%(+1.34)#4 | 0.071%(+1.30)#75 |
| 76. | Village Green Green Ridge | 1.36% | 0.055%(+1.31)#6 | 0.071%(+1.29)#76 |
| 77. | Penn State Erie Behrend | 1.36% | 0.055%(+1.31)#7 | 0.071%(+1.29)#77 |
| 78. | Valley View Cdp York County | 1.36% | 0.055%(+1.30)#8 | 0.071%(+1.29)#78 |
| 79. | Plandome Manor | 1.35% | 0.52%(+0.829)#22 | 0.071%(+1.28)#79 |
| 80. | Upper Brookville | 1.33% | 0.52%(+0.805)#23 | 0.071%(+1.26)#80 |
| 81. | Hicksville | 1.32% | 0.52%(+0.798)#24 | 0.071%(+1.25)#81 |
| 82. | Buffalo | 1.32% | 0.52%(+0.798)#25 | 0.071%(+1.25)#82 |
| 83. | Lorton | 1.32% | 0.13%(+1.18)#12 | 0.071%(+1.24)#83 |
| 84. | Honey Brook Borough | 1.30% | 0.055%(+1.24)#9 | 0.071%(+1.23)#84 |
| 85. | Park Hill | 1.25% | 0.033%(+1.22)#1 | 0.071%(+1.18)#85 |
| 86. | Newington | 1.25% | 0.13%(+1.11)#13 | 0.071%(+1.18)#86 |
| 87. | Seymour | 1.24% | 0.025%(+1.22)#2 | 0.071%(+1.17)#87 |
| 88. | Sudley | 1.22% | 0.13%(+1.08)#14 | 0.071%(+1.15)#88 |
| 89. | Montclair | 1.17% | 0.13%(+1.04)#15 | 0.071%(+1.10)#89 |
| 90. | Claymont | 1.15% | 0.11%(+1.04)#2 | 0.071%(+1.08)#90 |
| 91. | Louisville | 1.14% | 0.013%(+1.13)#2 | 0.071%(+1.07)#91 |
| 92. | New Hyde Park | 1.14% | 0.52%(+0.618)#26 | 0.071%(+1.07)#92 |
| 93. | Strongsville | 1.14% | 0.019%(+1.12)#1 | 0.071%(+1.07)#93 |
| 94. | Dulles Town Center | 1.12% | 0.13%(+0.987)#16 | 0.071%(+1.05)#94 |
| 95. | Suwanee | 1.10% | 0.063%(+1.04)#4 | 0.071%(+1.03)#95 |
| 96. | Fords | 1.08% | 0.12%(+0.958)#11 | 0.071%(+1.01)#96 |
| 97. | Center Line | 1.07% | 0.15%(+0.919)#4 | 0.071%(+1.00)#97 |
| 98. | Folcroft Borough | 1.07% | 0.055%(+1.01)#10 | 0.071%(+0.994)#98 |
| 99. | Princeton Meadows | 1.07% | 0.12%(+0.941)#12 | 0.071%(+0.994)#99 |
| 100. | Scotchtown | 1.06% | 0.52%(+0.538)#27 | 0.071%(+0.991)#100 |
Common Questions
What are the Top 10 Cities with the Highest Percentage of Vietnamese Population in the United States?
Top 10 Cities with the Highest Percentage of Vietnamese Population in the United States are:
#1
17.42%
#2
12.18%
#3
9.92%
#4
9.30%
#5
8.21%
#6
8.12%
#7
6.70%
#8
6.39%
#9
6.23%
#10
5.15%
What city has the Highest Percentage of Vietnamese Population in the United States?
Hamtramck has the Highest Percentage of Vietnamese Population in the United States with 17.42%.
What is the Percentage of Vietnamese Population in the United States?
Percentage of Vietnamese Population in the United States is 0.071%.