Cheverly, MD Map & Demographics
Cheverly Map
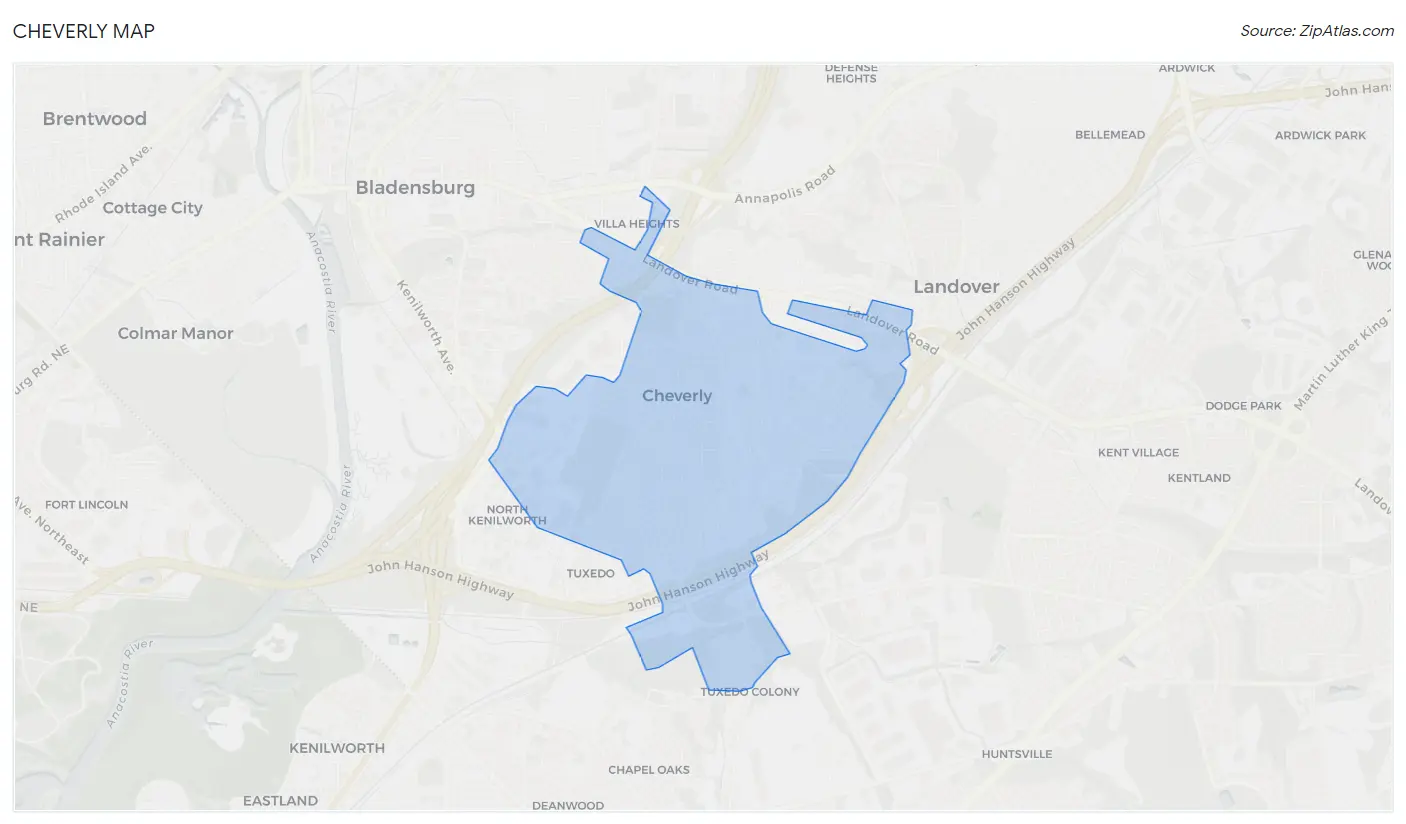
Cheverly Overview
$58,109
PER CAPITA INCOME
$149,814
AVG FAMILY INCOME
$119,625
AVG HOUSEHOLD INCOME
32.5%
WAGE / INCOME GAP [ % ]
67.5¢/ $1
WAGE / INCOME GAP [ $ ]
0.35
INEQUALITY / GINI INDEX
6,132
TOTAL POPULATION
2,911
MALE POPULATION
3,221
FEMALE POPULATION
90.38
MALES / 100 FEMALES
110.65
FEMALES / 100 MALES
42.0
MEDIAN AGE
3.4
AVG FAMILY SIZE
2.4
AVG HOUSEHOLD SIZE
3,572
LABOR FORCE [ PEOPLE ]
72.8%
PERCENT IN LABOR FORCE
6.4%
UNEMPLOYMENT RATE
Income in Cheverly
Income Overview in Cheverly
Per Capita Income in Cheverly is $58,109, while median incomes of families and households are $149,814 and $119,625 respectively.
| Characteristic | Number | Measure |
| Per Capita Income | 6,132 | $58,109 |
| Median Family Income | 1,387 | $149,814 |
| Mean Family Income | 1,387 | $159,970 |
| Median Household Income | 2,557 | $119,625 |
| Mean Household Income | 2,557 | $136,620 |
| Income Deficit | 1,387 | $0 |
| Wage / Income Gap (%) | 6,132 | 32.48% |
| Wage / Income Gap ($) | 6,132 | 67.52¢ per $1 |
| Gini / Inequality Index | 6,132 | 0.35 |
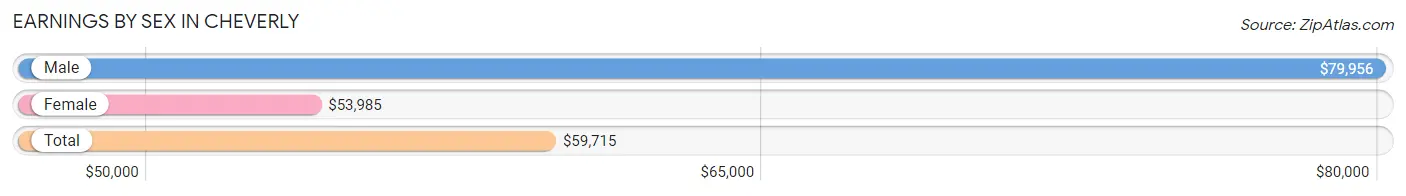
Earnings by Sex in Cheverly
Average Earnings in Cheverly are $59,715, $79,956 for men and $53,985 for women, a difference of 32.5%.
| Sex | Number | Average Earnings |
| Male | 1,791 (50.3%) | $79,956 |
| Female | 1,772 (49.7%) | $53,985 |
| Total | 3,563 (100.0%) | $59,715 |
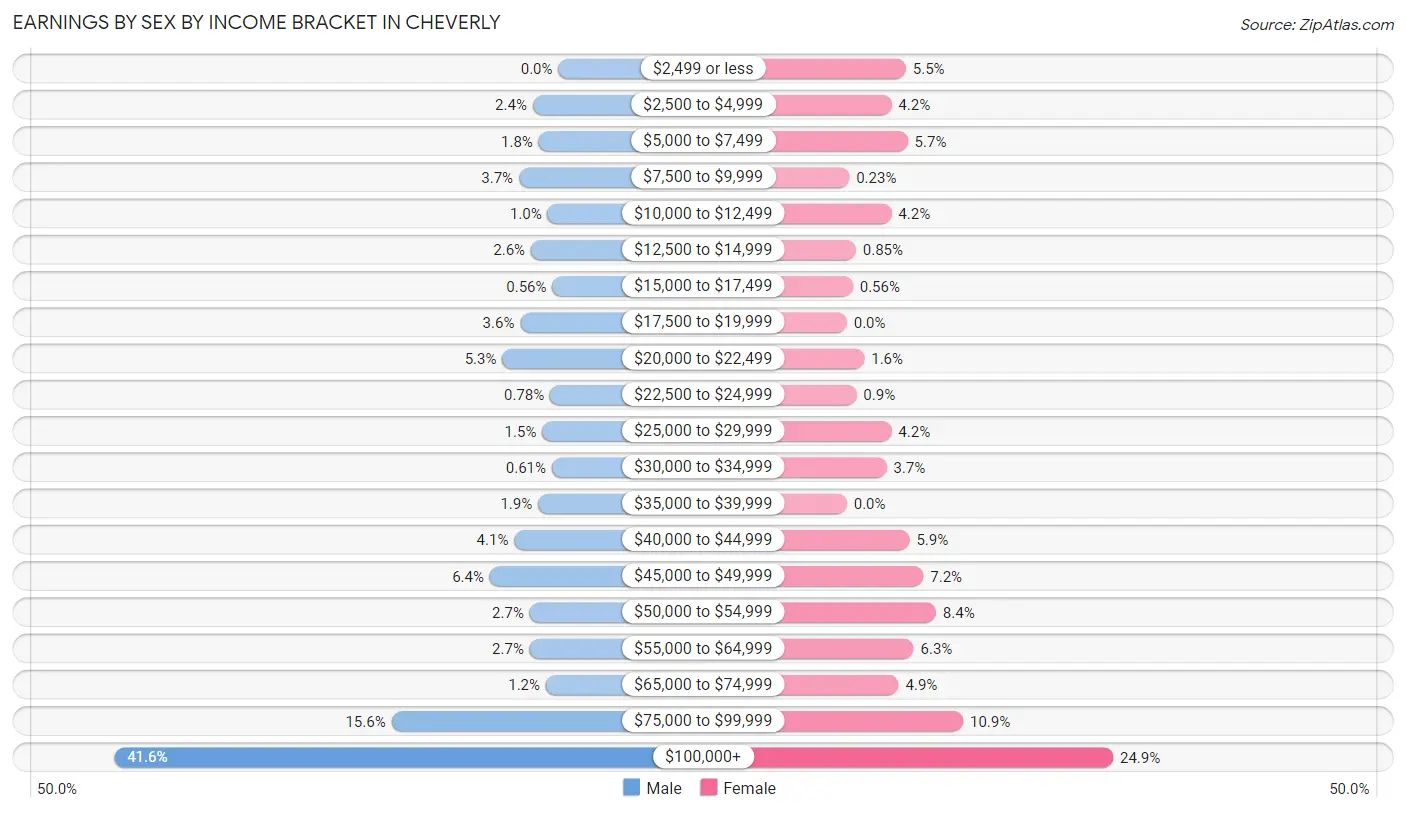
Earnings by Sex by Income Bracket in Cheverly
The most common earnings brackets in Cheverly are $100,000+ for men (745 | 41.6%) and $100,000+ for women (442 | 24.9%).
| Income | Male | Female |
| $2,499 or less | 0 (0.0%) | 98 (5.5%) |
| $2,500 to $4,999 | 43 (2.4%) | 74 (4.2%) |
| $5,000 to $7,499 | 33 (1.8%) | 101 (5.7%) |
| $7,500 to $9,999 | 66 (3.7%) | 4 (0.2%) |
| $10,000 to $12,499 | 18 (1.0%) | 74 (4.2%) |
| $12,500 to $14,999 | 46 (2.6%) | 15 (0.9%) |
| $15,000 to $17,499 | 10 (0.6%) | 10 (0.6%) |
| $17,500 to $19,999 | 64 (3.6%) | 0 (0.0%) |
| $20,000 to $22,499 | 94 (5.2%) | 29 (1.6%) |
| $22,500 to $24,999 | 14 (0.8%) | 16 (0.9%) |
| $25,000 to $29,999 | 27 (1.5%) | 74 (4.2%) |
| $30,000 to $34,999 | 11 (0.6%) | 66 (3.7%) |
| $35,000 to $39,999 | 34 (1.9%) | 0 (0.0%) |
| $40,000 to $44,999 | 74 (4.1%) | 104 (5.9%) |
| $45,000 to $49,999 | 115 (6.4%) | 127 (7.2%) |
| $50,000 to $54,999 | 48 (2.7%) | 148 (8.4%) |
| $55,000 to $64,999 | 48 (2.7%) | 111 (6.3%) |
| $65,000 to $74,999 | 21 (1.2%) | 86 (4.9%) |
| $75,000 to $99,999 | 280 (15.6%) | 193 (10.9%) |
| $100,000+ | 745 (41.6%) | 442 (24.9%) |
| Total | 1,791 (100.0%) | 1,772 (100.0%) |
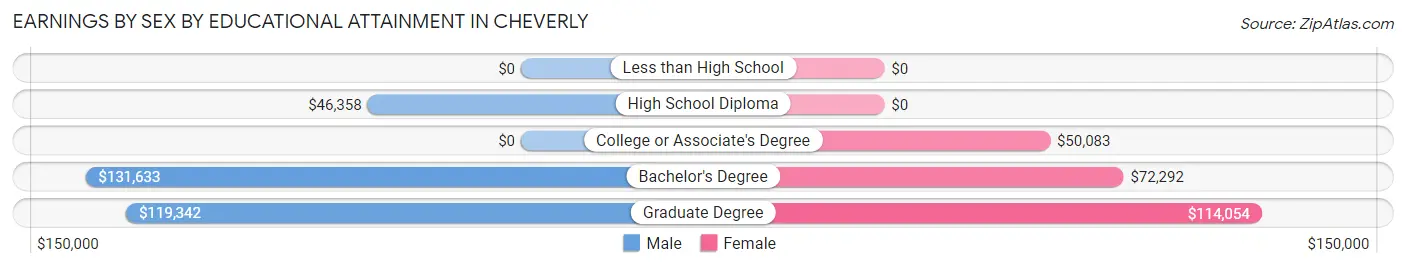
Earnings by Sex by Educational Attainment in Cheverly
Average earnings in Cheverly are $84,650 for men and $58,306 for women, a difference of 31.1%. Men with an educational attainment of bachelor's degree enjoy the highest average annual earnings of $131,633, while those with high school diploma education earn the least with $46,358. Women with an educational attainment of graduate degree earn the most with the average annual earnings of $114,054, while those with college or associate's degree education have the smallest earnings of $50,083.
| Educational Attainment | Male Income | Female Income |
| Less than High School | - | - |
| High School Diploma | $46,358 | $0 |
| College or Associate's Degree | - | - |
| Bachelor's Degree | $131,633 | $72,292 |
| Graduate Degree | $119,342 | $114,054 |
| Total | $84,650 | $58,306 |
Family Income in Cheverly
Family Income Brackets in Cheverly
According to the Cheverly family income data, there are 379 families falling into the $200,000+ income range, which is the most common income bracket and makes up 27.3% of all families.
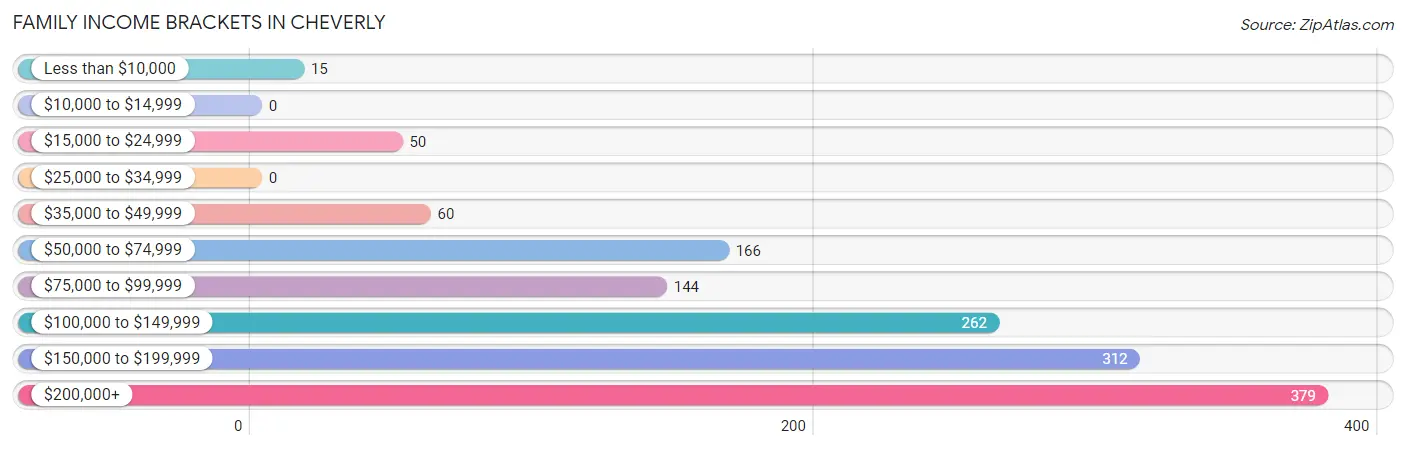
| Income Bracket | # Families | % Families |
| Less than $10,000 | 15 | 1.1% |
| $10,000 to $14,999 | 0 | 0.0% |
| $15,000 to $24,999 | 50 | 3.6% |
| $25,000 to $34,999 | 0 | 0.0% |
| $35,000 to $49,999 | 60 | 4.3% |
| $50,000 to $74,999 | 166 | 12.0% |
| $75,000 to $99,999 | 144 | 10.4% |
| $100,000 to $149,999 | 262 | 18.9% |
| $150,000 to $199,999 | 312 | 22.5% |
| $200,000+ | 379 | 27.3% |
Family Income by Famaliy Size in Cheverly
2-person families (617 | 44.5%) account for the highest median family income in Cheverly with $175,317 per family, while 2-person families (617 | 44.5%) have the highest median income of $87,658 per family member.
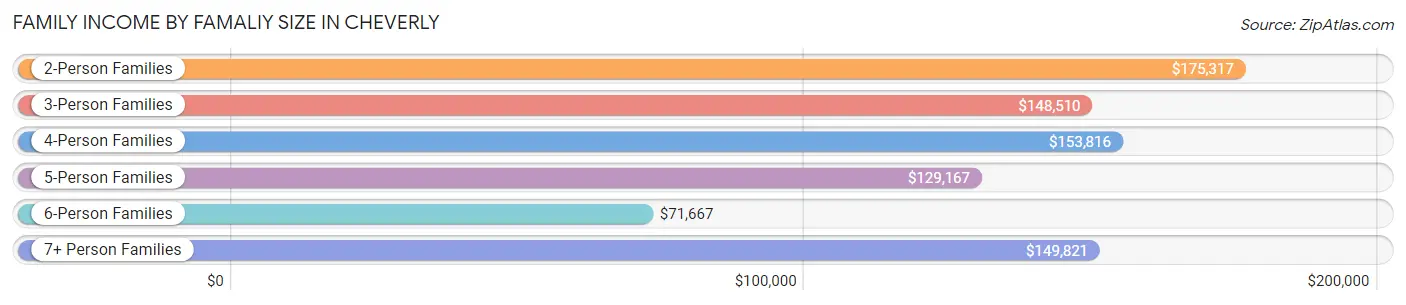
| Income Bracket | # Families | Median Income |
| 2-Person Families | 617 (44.5%) | $175,317 |
| 3-Person Families | 291 (21.0%) | $148,510 |
| 4-Person Families | 268 (19.3%) | $153,816 |
| 5-Person Families | 102 (7.3%) | $129,167 |
| 6-Person Families | 64 (4.6%) | $71,667 |
| 7+ Person Families | 45 (3.2%) | $149,821 |
| Total | 1,387 (100.0%) | $149,814 |
Family Income by Number of Earners in Cheverly
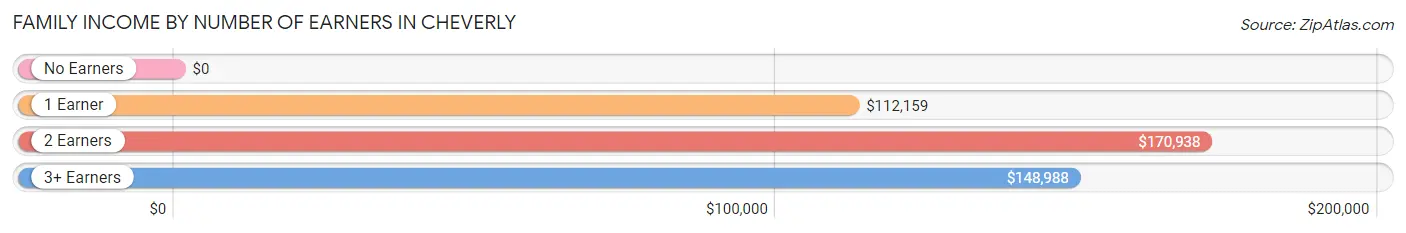
| Number of Earners | # Families | Median Income |
| No Earners | 171 (12.3%) | $0 |
| 1 Earner | 404 (29.1%) | $112,159 |
| 2 Earners | 605 (43.6%) | $170,938 |
| 3+ Earners | 207 (14.9%) | $148,988 |
| Total | 1,387 (100.0%) | $149,814 |
Household Income in Cheverly
Household Income Brackets in Cheverly
With 550 households falling in the category, the $100,000 to $149,999 income range is the most frequent in Cheverly, accounting for 21.5% of all households.
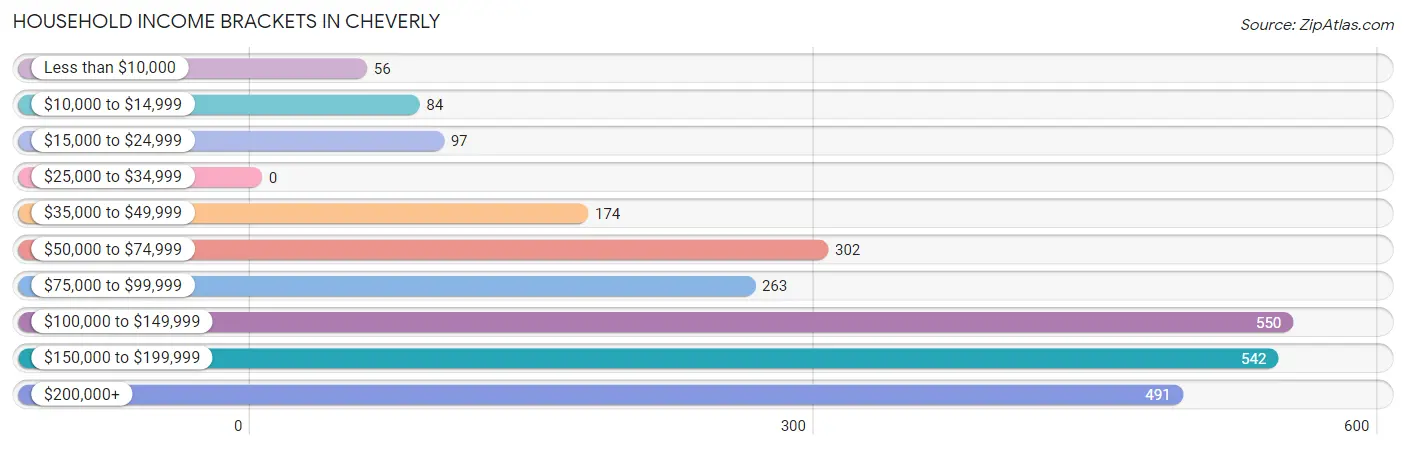
| Income Bracket | # Households | % Households |
| Less than $10,000 | 56 | 2.2% |
| $10,000 to $14,999 | 84 | 3.3% |
| $15,000 to $24,999 | 97 | 3.8% |
| $25,000 to $34,999 | 0 | 0.0% |
| $35,000 to $49,999 | 174 | 6.8% |
| $50,000 to $74,999 | 302 | 11.8% |
| $75,000 to $99,999 | 263 | 10.3% |
| $100,000 to $149,999 | 550 | 21.5% |
| $150,000 to $199,999 | 542 | 21.2% |
| $200,000+ | 491 | 19.2% |
Household Income by Householder Age in Cheverly
The median household income in Cheverly is $119,625, with the highest median household income of $155,288 found in the 25 to 44 years age bracket for the primary householder. A total of 807 households (31.6%) fall into this category. Meanwhile, the 15 to 24 years age bracket for the primary householder has the lowest median household income of $0, with 20 households (0.8%) in this group.
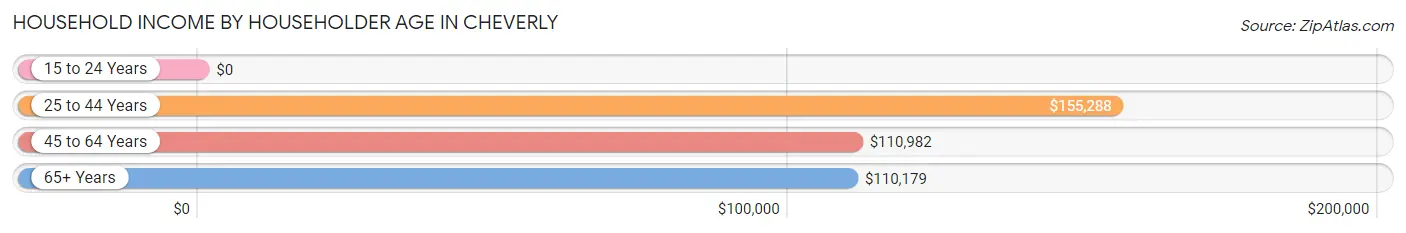
| Income Bracket | # Households | Median Income |
| 15 to 24 Years | 20 (0.8%) | $0 |
| 25 to 44 Years | 807 (31.6%) | $155,288 |
| 45 to 64 Years | 838 (32.8%) | $110,982 |
| 65+ Years | 892 (34.9%) | $110,179 |
| Total | 2,557 (100.0%) | $119,625 |
Poverty in Cheverly
Income Below Poverty by Sex and Age in Cheverly
With 6.4% poverty level for males and 4.6% for females among the residents of Cheverly, 18 to 24 year old males and 5 year old females are the most vulnerable to poverty, with 33 males (31.4%) and 15 females (24.2%) in their respective age groups living below the poverty level.
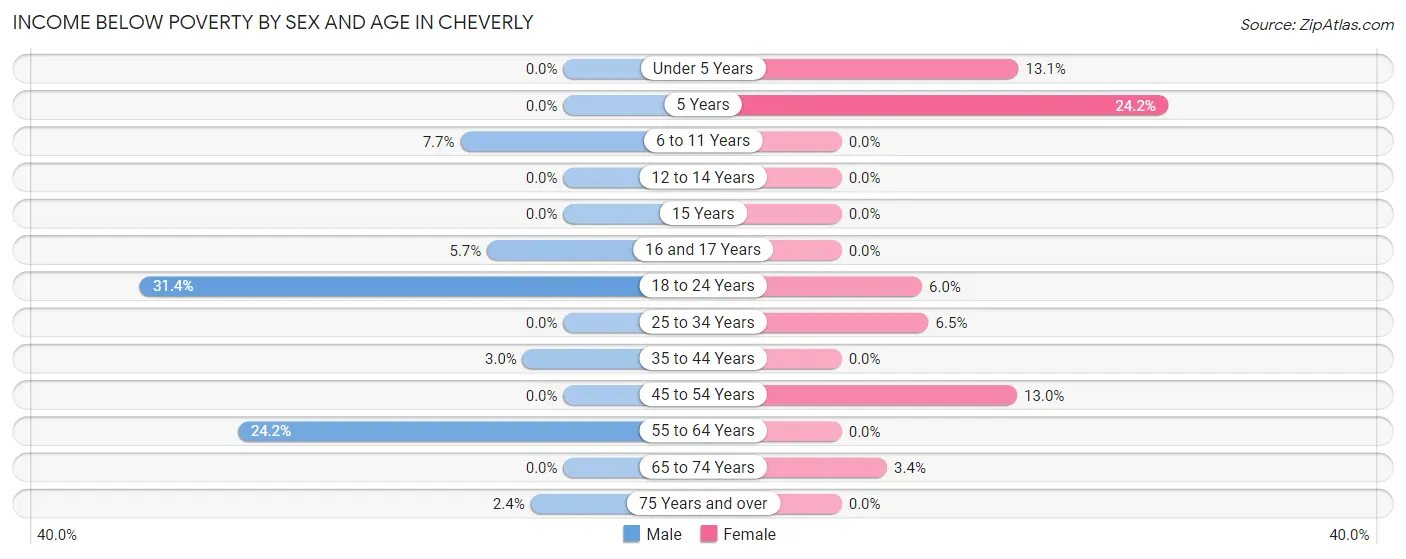
| Age Bracket | Male | Female |
| Under 5 Years | 0 (0.0%) | 34 (13.1%) |
| 5 Years | 0 (0.0%) | 15 (24.2%) |
| 6 to 11 Years | 14 (7.6%) | 0 (0.0%) |
| 12 to 14 Years | 0 (0.0%) | 0 (0.0%) |
| 15 Years | 0 (0.0%) | 0 (0.0%) |
| 16 and 17 Years | 3 (5.7%) | 0 (0.0%) |
| 18 to 24 Years | 33 (31.4%) | 13 (6.0%) |
| 25 to 34 Years | 0 (0.0%) | 24 (6.5%) |
| 35 to 44 Years | 16 (3.0%) | 0 (0.0%) |
| 45 to 54 Years | 0 (0.0%) | 50 (13.0%) |
| 55 to 64 Years | 116 (24.2%) | 0 (0.0%) |
| 65 to 74 Years | 0 (0.0%) | 11 (3.4%) |
| 75 Years and over | 3 (2.4%) | 0 (0.0%) |
| Total | 185 (6.4%) | 147 (4.6%) |
Income Above Poverty by Sex and Age in Cheverly
According to the poverty statistics in Cheverly, males aged under 5 years and females aged 6 to 11 years are the age groups that are most secure financially, with 100.0% of males and 100.0% of females in these age groups living above the poverty line.
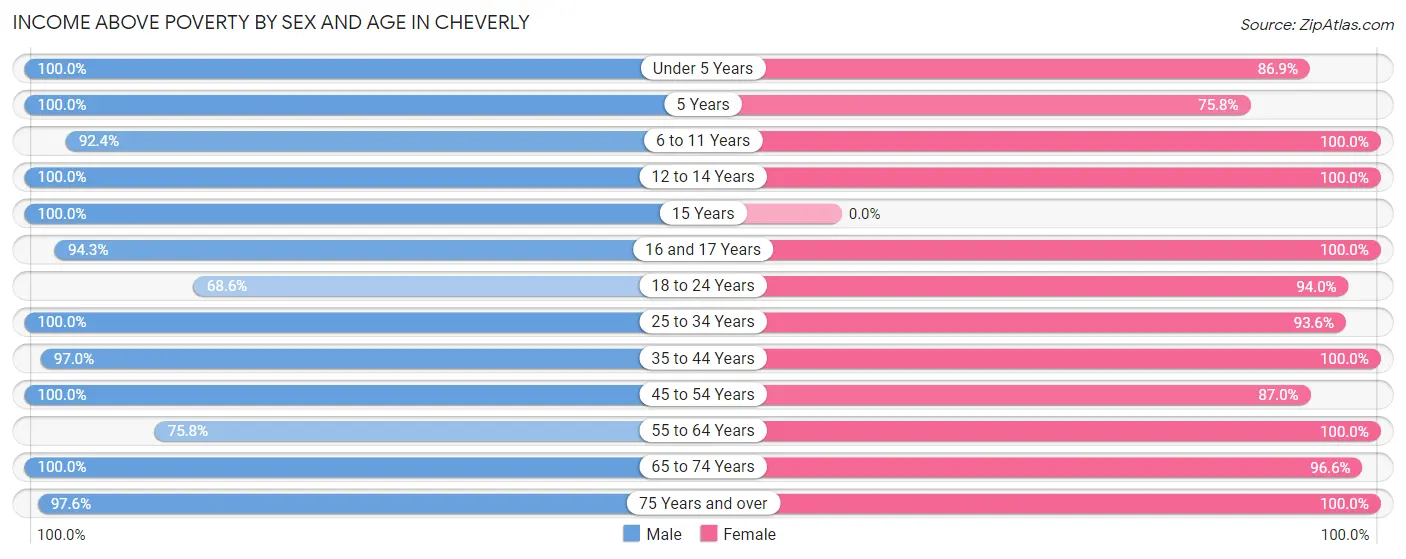
| Age Bracket | Male | Female |
| Under 5 Years | 226 (100.0%) | 225 (86.9%) |
| 5 Years | 62 (100.0%) | 47 (75.8%) |
| 6 to 11 Years | 169 (92.3%) | 270 (100.0%) |
| 12 to 14 Years | 29 (100.0%) | 106 (100.0%) |
| 15 Years | 21 (100.0%) | 0 (0.0%) |
| 16 and 17 Years | 50 (94.3%) | 56 (100.0%) |
| 18 to 24 Years | 72 (68.6%) | 205 (94.0%) |
| 25 to 34 Years | 336 (100.0%) | 348 (93.5%) |
| 35 to 44 Years | 514 (97.0%) | 438 (100.0%) |
| 45 to 54 Years | 364 (100.0%) | 334 (87.0%) |
| 55 to 64 Years | 364 (75.8%) | 349 (100.0%) |
| 65 to 74 Years | 392 (100.0%) | 315 (96.6%) |
| 75 Years and over | 120 (97.6%) | 379 (100.0%) |
| Total | 2,719 (93.6%) | 3,072 (95.4%) |
Income Below Poverty Among Married-Couple Families in Cheverly
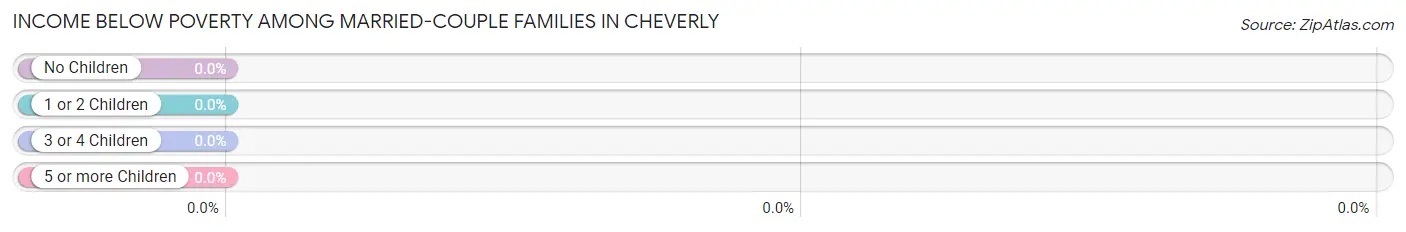
| Children | Above Poverty | Below Poverty |
| No Children | 552 (100.0%) | 0 (0.0%) |
| 1 or 2 Children | 345 (100.0%) | 0 (0.0%) |
| 3 or 4 Children | 91 (100.0%) | 0 (0.0%) |
| 5 or more Children | 19 (100.0%) | 0 (0.0%) |
| Total | 1,007 (100.0%) | 0 (0.0%) |
Income Below Poverty Among Single-Parent Households in Cheverly
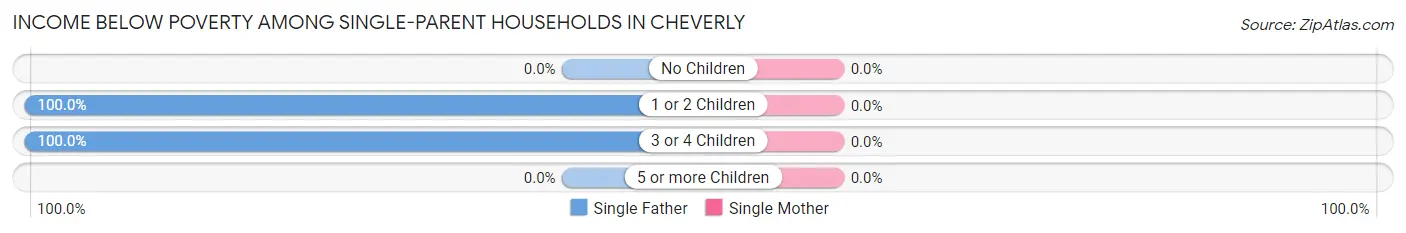
| Children | Single Father | Single Mother |
| No Children | 0 (0.0%) | 0 (0.0%) |
| 1 or 2 Children | 36 (100.0%) | 0 (0.0%) |
| 3 or 4 Children | 15 (100.0%) | 0 (0.0%) |
| 5 or more Children | 0 (0.0%) | 0 (0.0%) |
| Total | 51 (100.0%) | 0 (0.0%) |
Income Below Poverty Among Married-Couple vs Single-Parent Households in Cheverly
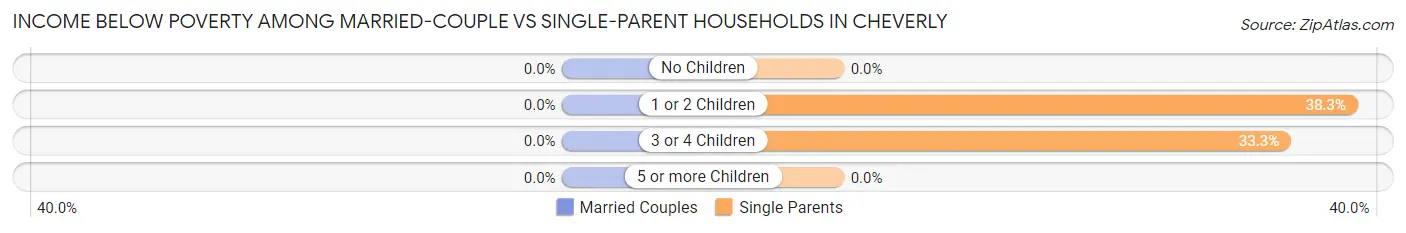
| Children | Married-Couple Families | Single-Parent Households |
| No Children | 0 (0.0%) | 0 (0.0%) |
| 1 or 2 Children | 0 (0.0%) | 36 (38.3%) |
| 3 or 4 Children | 0 (0.0%) | 15 (33.3%) |
| 5 or more Children | 0 (0.0%) | 0 (0.0%) |
| Total | 0 (0.0%) | 51 (13.4%) |
Race in Cheverly
The most populous races in Cheverly are Black / African American (2,594 | 42.3%), White / Caucasian (2,174 | 35.4%), and Two or more Races (645 | 10.5%).
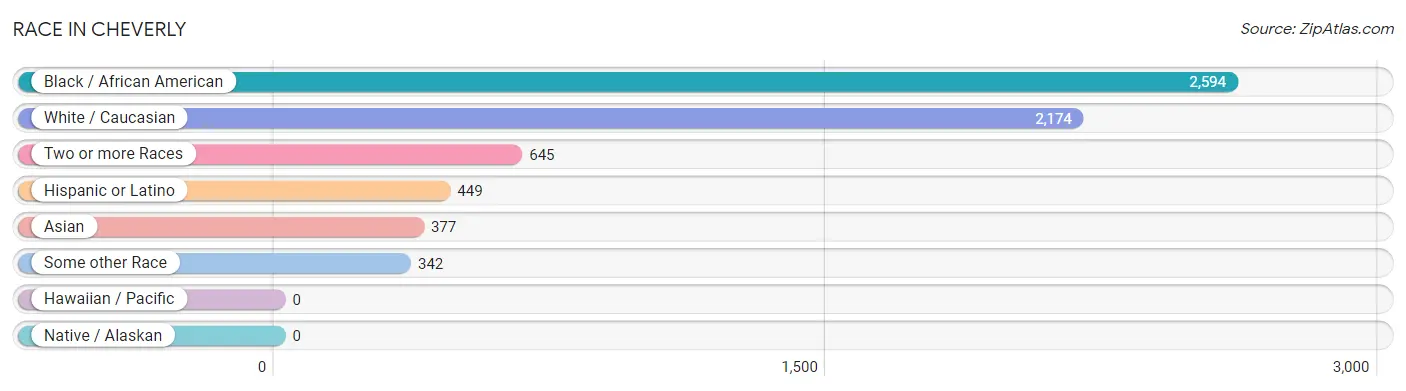
| Race | # Population | % Population |
| Asian | 377 | 6.1% |
| Black / African American | 2,594 | 42.3% |
| Hawaiian / Pacific | 0 | 0.0% |
| Hispanic or Latino | 449 | 7.3% |
| Native / Alaskan | 0 | 0.0% |
| White / Caucasian | 2,174 | 35.4% |
| Two or more Races | 645 | 10.5% |
| Some other Race | 342 | 5.6% |
| Total | 6,132 | 100.0% |
Ancestry in Cheverly
The most populous ancestries reported in Cheverly are German (723 | 11.8%), Irish (682 | 11.1%), English (481 | 7.8%), Subsaharan African (465 | 7.6%), and Mexican (240 | 3.9%), together accounting for 42.2% of all Cheverly residents.
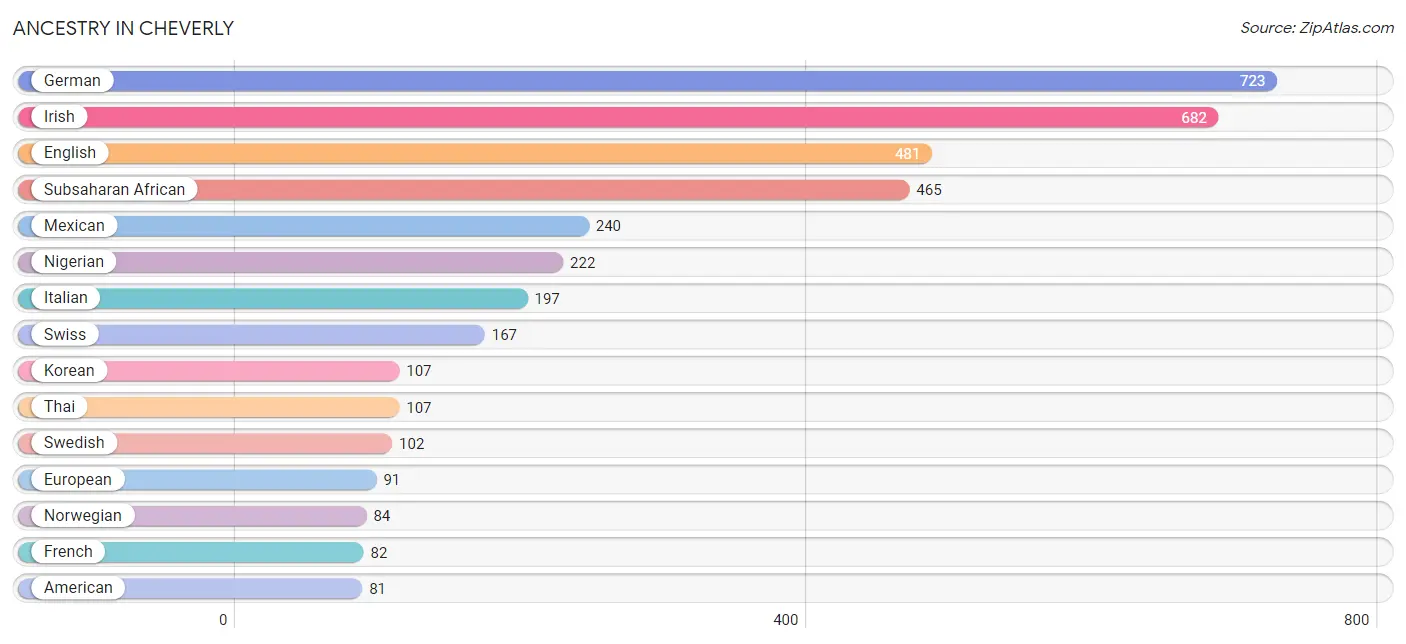
| Ancestry | # Population | % Population |
| African | 66 | 1.1% |
| American | 81 | 1.3% |
| Arab | 10 | 0.2% |
| Argentinean | 21 | 0.3% |
| Barbadian | 51 | 0.8% |
| Basque | 21 | 0.3% |
| Bhutanese | 17 | 0.3% |
| British | 56 | 0.9% |
| Canadian | 29 | 0.5% |
| Cape Verdean | 58 | 0.9% |
| Celtic | 11 | 0.2% |
| Central American | 67 | 1.1% |
| Cherokee | 34 | 0.5% |
| Czech | 41 | 0.7% |
| Dominican | 1 | 0.0% |
| Dutch | 19 | 0.3% |
| Eastern European | 17 | 0.3% |
| English | 481 | 7.8% |
| Estonian | 32 | 0.5% |
| European | 91 | 1.5% |
| French | 82 | 1.3% |
| French Canadian | 10 | 0.2% |
| German | 723 | 11.8% |
| Ghanaian | 23 | 0.4% |
| Guatemalan | 2 | 0.0% |
| Honduran | 13 | 0.2% |
| Hungarian | 40 | 0.6% |
| Indian (Asian) | 59 | 1.0% |
| Irish | 682 | 11.1% |
| Italian | 197 | 3.2% |
| Jamaican | 58 | 0.9% |
| Korean | 107 | 1.7% |
| Lebanese | 10 | 0.2% |
| Mexican | 240 | 3.9% |
| Nigerian | 222 | 3.6% |
| Norwegian | 84 | 1.4% |
| Pakistani | 9 | 0.2% |
| Polish | 76 | 1.2% |
| Puerto Rican | 57 | 0.9% |
| Russian | 63 | 1.0% |
| Salvadoran | 52 | 0.9% |
| Samoan | 3 | 0.1% |
| Scandinavian | 6 | 0.1% |
| Scotch-Irish | 33 | 0.5% |
| Scottish | 68 | 1.1% |
| Sierra Leonean | 60 | 1.0% |
| Slovene | 15 | 0.2% |
| South American | 21 | 0.3% |
| Spaniard | 32 | 0.5% |
| Sri Lankan | 22 | 0.4% |
| Subsaharan African | 465 | 7.6% |
| Swedish | 102 | 1.7% |
| Swiss | 167 | 2.7% |
| Thai | 107 | 1.7% |
| Trinidadian and Tobagonian | 72 | 1.2% |
| Turkish | 35 | 0.6% |
| Welsh | 26 | 0.4% | View All 57 Rows |
Immigrants in Cheverly
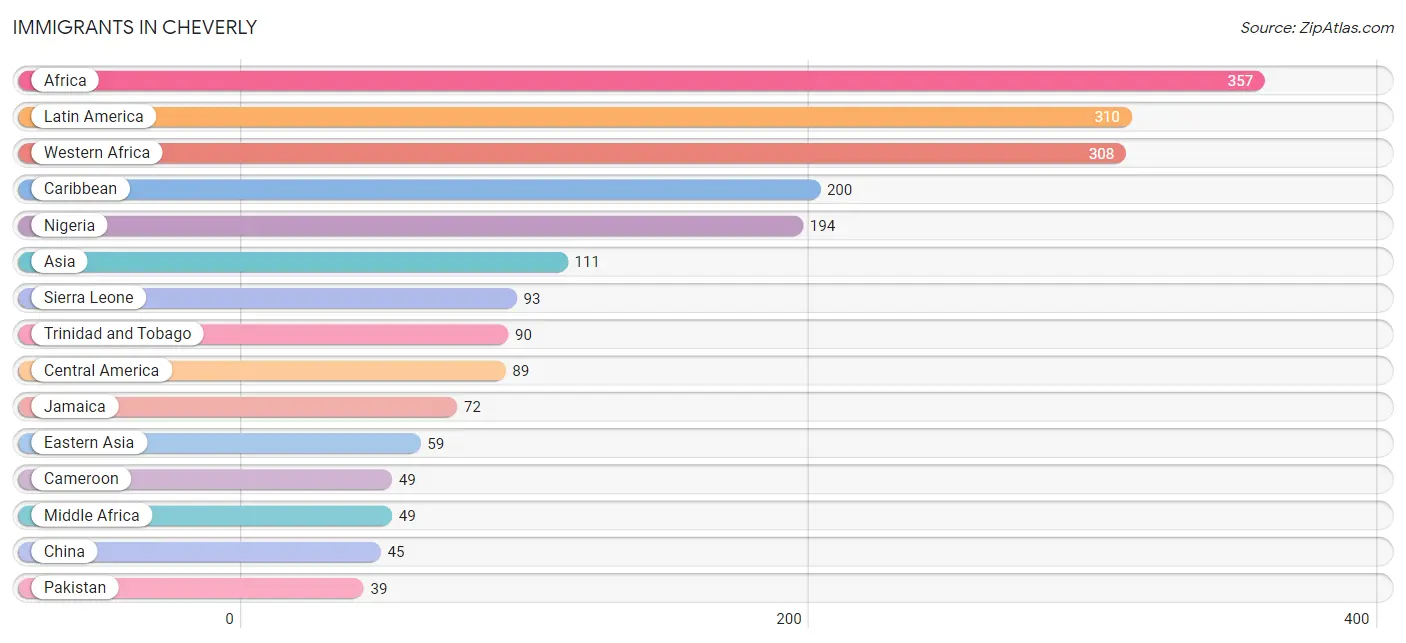
The most numerous immigrant groups reported in Cheverly came from Africa (357 | 5.8%), Latin America (310 | 5.1%), Western Africa (308 | 5.0%), Caribbean (200 | 3.3%), and Nigeria (194 | 3.2%), together accounting for 22.3% of all Cheverly residents.
| Immigration Origin | # Population | % Population |
| Africa | 357 | 5.8% |
| Argentina | 21 | 0.3% |
| Asia | 111 | 1.8% |
| Barbados | 30 | 0.5% |
| Cameroon | 49 | 0.8% |
| Canada | 14 | 0.2% |
| Caribbean | 200 | 3.3% |
| Central America | 89 | 1.5% |
| China | 45 | 0.7% |
| Dominica | 8 | 0.1% |
| Eastern Asia | 59 | 1.0% |
| El Salvador | 34 | 0.5% |
| Europe | 13 | 0.2% |
| France | 13 | 0.2% |
| Ghana | 8 | 0.1% |
| Honduras | 15 | 0.2% |
| Jamaica | 72 | 1.2% |
| Japan | 14 | 0.2% |
| Latin America | 310 | 5.1% |
| Liberia | 13 | 0.2% |
| Mexico | 16 | 0.3% |
| Middle Africa | 49 | 0.8% |
| Nicaragua | 24 | 0.4% |
| Nigeria | 194 | 3.2% |
| Pakistan | 39 | 0.6% |
| Sierra Leone | 93 | 1.5% |
| South America | 21 | 0.3% |
| South Central Asia | 39 | 0.6% |
| South Eastern Asia | 6 | 0.1% |
| Taiwan | 4 | 0.1% |
| Trinidad and Tobago | 90 | 1.5% |
| Turkey | 7 | 0.1% |
| Vietnam | 6 | 0.1% |
| Western Africa | 308 | 5.0% |
| Western Asia | 7 | 0.1% |
| Western Europe | 13 | 0.2% | View All 36 Rows |
Sex and Age in Cheverly
Sex and Age in Cheverly
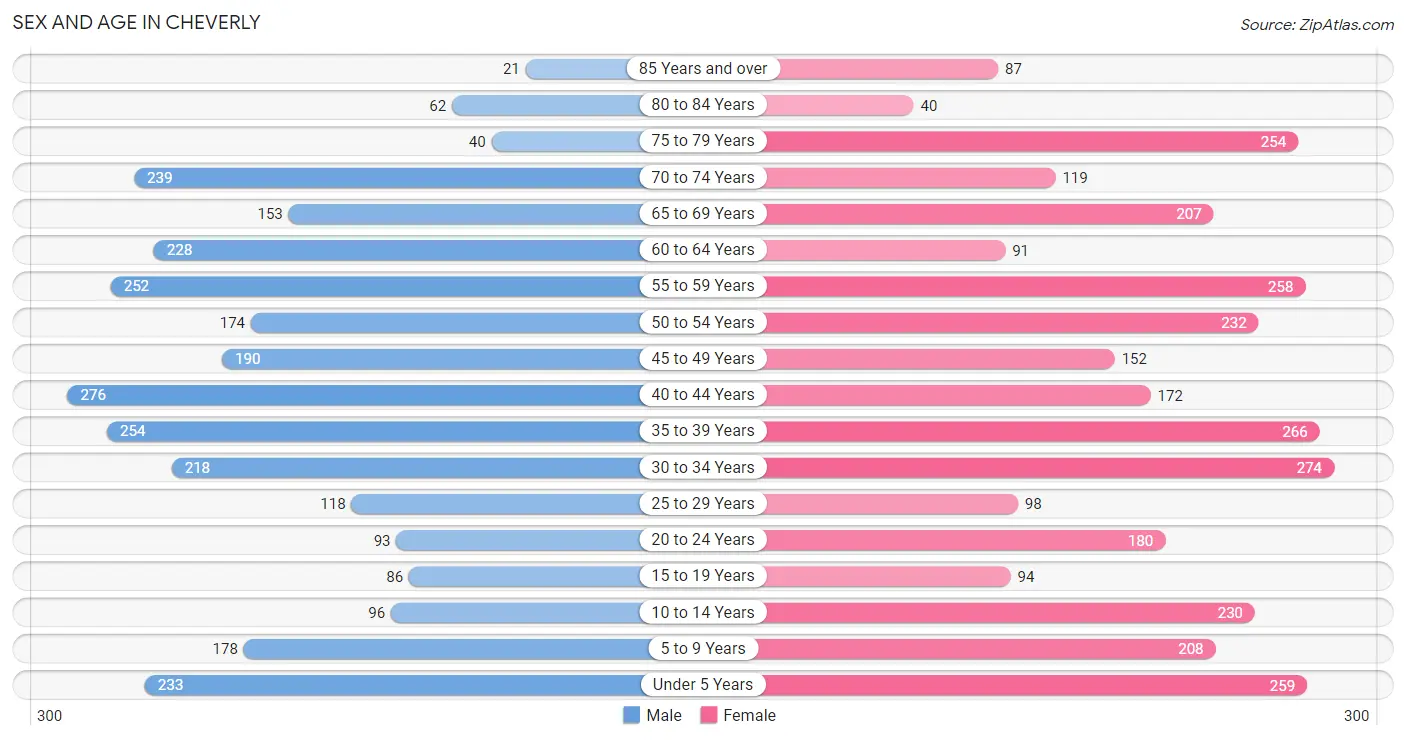
The most populous age groups in Cheverly are 40 to 44 Years (276 | 9.5%) for men and 30 to 34 Years (274 | 8.5%) for women.
| Age Bracket | Male | Female |
| Under 5 Years | 233 (8.0%) | 259 (8.0%) |
| 5 to 9 Years | 178 (6.1%) | 208 (6.5%) |
| 10 to 14 Years | 96 (3.3%) | 230 (7.1%) |
| 15 to 19 Years | 86 (2.9%) | 94 (2.9%) |
| 20 to 24 Years | 93 (3.2%) | 180 (5.6%) |
| 25 to 29 Years | 118 (4.1%) | 98 (3.0%) |
| 30 to 34 Years | 218 (7.5%) | 274 (8.5%) |
| 35 to 39 Years | 254 (8.7%) | 266 (8.3%) |
| 40 to 44 Years | 276 (9.5%) | 172 (5.3%) |
| 45 to 49 Years | 190 (6.5%) | 152 (4.7%) |
| 50 to 54 Years | 174 (6.0%) | 232 (7.2%) |
| 55 to 59 Years | 252 (8.7%) | 258 (8.0%) |
| 60 to 64 Years | 228 (7.8%) | 91 (2.8%) |
| 65 to 69 Years | 153 (5.3%) | 207 (6.4%) |
| 70 to 74 Years | 239 (8.2%) | 119 (3.7%) |
| 75 to 79 Years | 40 (1.4%) | 254 (7.9%) |
| 80 to 84 Years | 62 (2.1%) | 40 (1.2%) |
| 85 Years and over | 21 (0.7%) | 87 (2.7%) |
| Total | 2,911 (100.0%) | 3,221 (100.0%) |
Families and Households in Cheverly
Median Family Size in Cheverly
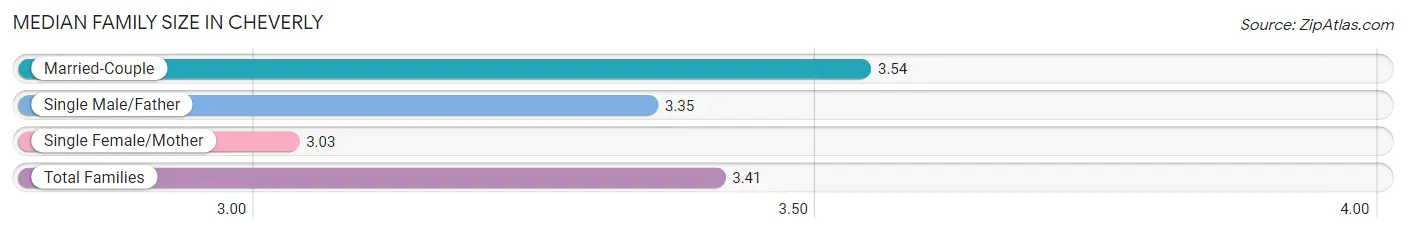
The median family size in Cheverly is 3.41 persons per family, with married-couple families (1,007 | 72.6%) accounting for the largest median family size of 3.54 persons per family. On the other hand, single female/mother families (329 | 23.7%) represent the smallest median family size with 3.03 persons per family.
| Family Type | # Families | Family Size |
| Married-Couple | 1,007 (72.6%) | 3.54 |
| Single Male/Father | 51 (3.7%) | 3.35 |
| Single Female/Mother | 329 (23.7%) | 3.03 |
| Total Families | 1,387 (100.0%) | 3.41 |
Median Household Size in Cheverly
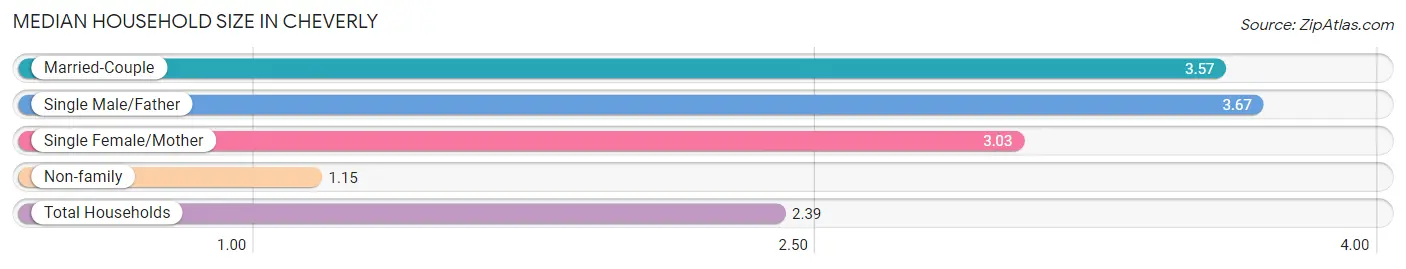
The median household size in Cheverly is 2.39 persons per household, with single male/father households (51 | 2.0%) accounting for the largest median household size of 3.67 persons per household. non-family households (1,170 | 45.8%) represent the smallest median household size with 1.15 persons per household.
| Household Type | # Households | Household Size |
| Married-Couple | 1,007 (39.4%) | 3.57 |
| Single Male/Father | 51 (2.0%) | 3.67 |
| Single Female/Mother | 329 (12.9%) | 3.03 |
| Non-family | 1,170 (45.8%) | 1.15 |
| Total Households | 2,557 (100.0%) | 2.39 |
Household Size by Marriage Status in Cheverly
Out of a total of 2,557 households in Cheverly, 1,387 (54.2%) are family households, while 1,170 (45.8%) are nonfamily households. The most numerous type of family households are 2-person households, comprising 609, and the most common type of nonfamily households are 1-person households, comprising 1,006.
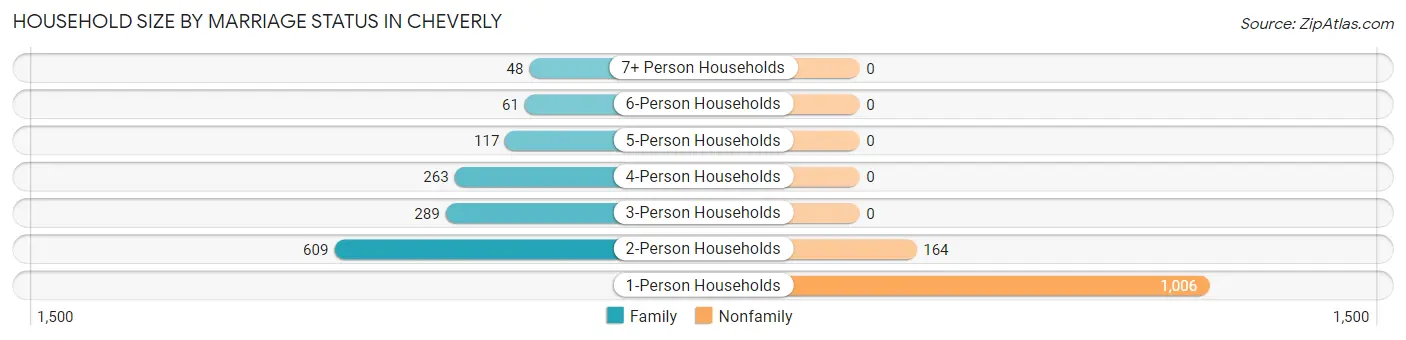
| Household Size | Family Households | Nonfamily Households |
| 1-Person Households | - | 1,006 (39.3%) |
| 2-Person Households | 609 (23.8%) | 164 (6.4%) |
| 3-Person Households | 289 (11.3%) | 0 (0.0%) |
| 4-Person Households | 263 (10.3%) | 0 (0.0%) |
| 5-Person Households | 117 (4.6%) | 0 (0.0%) |
| 6-Person Households | 61 (2.4%) | 0 (0.0%) |
| 7+ Person Households | 48 (1.9%) | 0 (0.0%) |
| Total | 1,387 (54.2%) | 1,170 (45.8%) |
Female Fertility in Cheverly
Fertility by Age in Cheverly
Average fertility rate in Cheverly is 80.0 births per 1,000 women. Women in the age bracket of 20 to 34 years have the highest fertility rate with 158.0 births per 1,000 women. Women in the age bracket of 20 to 34 years acount for 81.3% of all women with births.
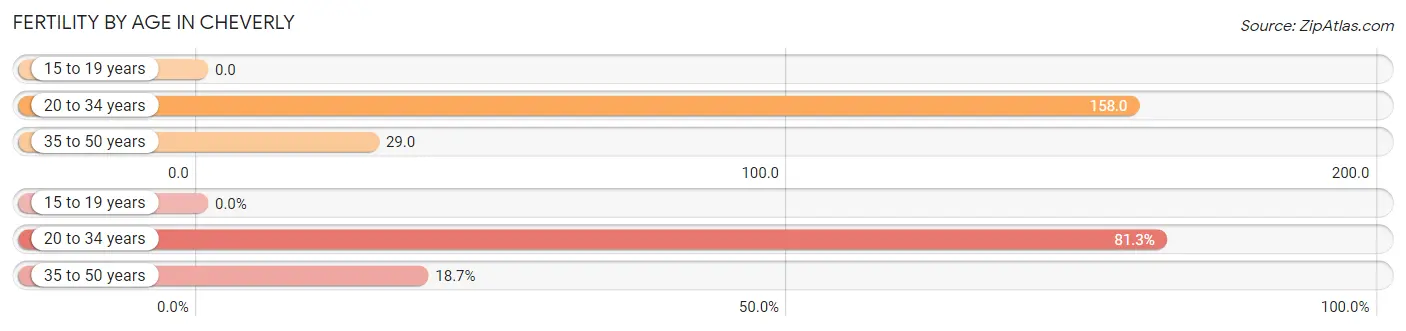
| Age Bracket | Women with Births | Births / 1,000 Women |
| 15 to 19 years | 0 (0.0%) | 0.0 |
| 20 to 34 years | 87 (81.3%) | 158.0 |
| 35 to 50 years | 20 (18.7%) | 29.0 |
| Total | 107 (100.0%) | 80.0 |
Fertility by Age by Marriage Status in Cheverly
72.0% of women with births (107) in Cheverly are married. The highest percentage of unmarried women with births falls into 20 to 34 years age bracket with 34.5% of them unmarried at the time of birth, while the lowest percentage of unmarried women with births belong to 35 to 50 years age bracket with 0.0% of them unmarried.
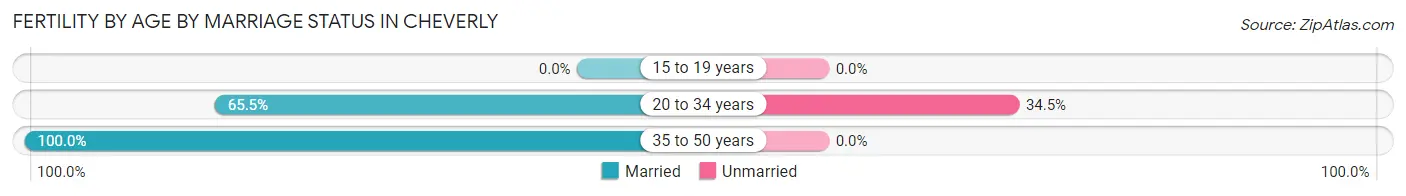
| Age Bracket | Married | Unmarried |
| 15 to 19 years | 0 (0.0%) | 0 (0.0%) |
| 20 to 34 years | 57 (65.5%) | 30 (34.5%) |
| 35 to 50 years | 20 (100.0%) | 0 (0.0%) |
| Total | 77 (72.0%) | 30 (28.0%) |
Fertility by Education in Cheverly
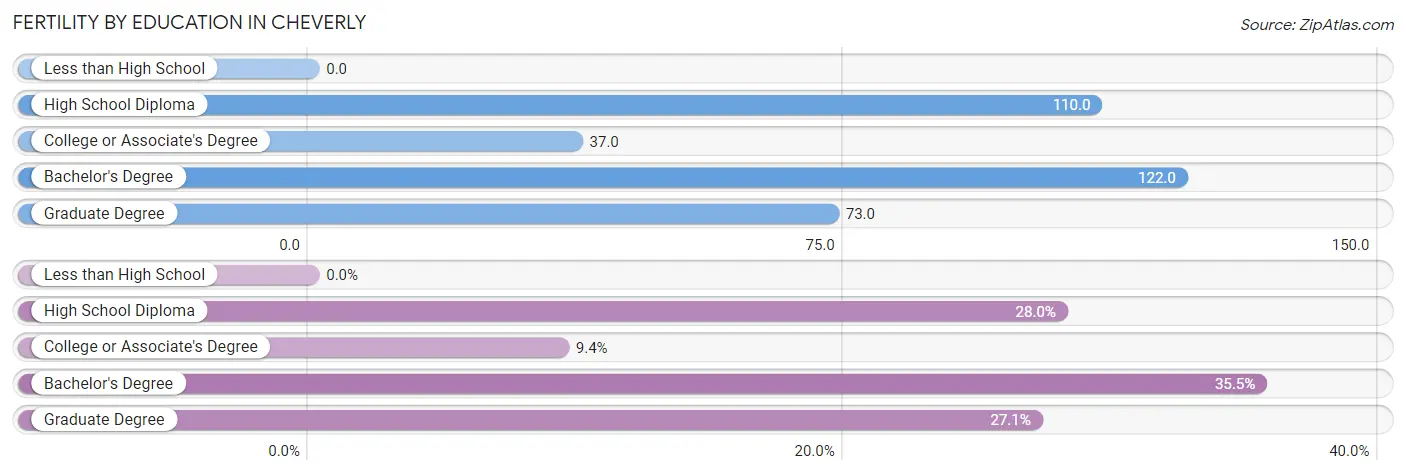
| Educational Attainment | Women with Births | Births / 1,000 Women |
| Less than High School | 0 (0.0%) | 0.0 |
| High School Diploma | 30 (28.0%) | 110.0 |
| College or Associate's Degree | 10 (9.3%) | 37.0 |
| Bachelor's Degree | 38 (35.5%) | 122.0 |
| Graduate Degree | 29 (27.1%) | 73.0 |
| Total | 107 (100.0%) | 80.0 |
Fertility by Education by Marriage Status in Cheverly
28.0% of women with births in Cheverly are unmarried. Women with the educational attainment of college or associate's degree are most likely to be married with 100.0% of them married at childbirth, while women with the educational attainment of high school diploma are least likely to be married with 100.0% of them unmarried at childbirth.
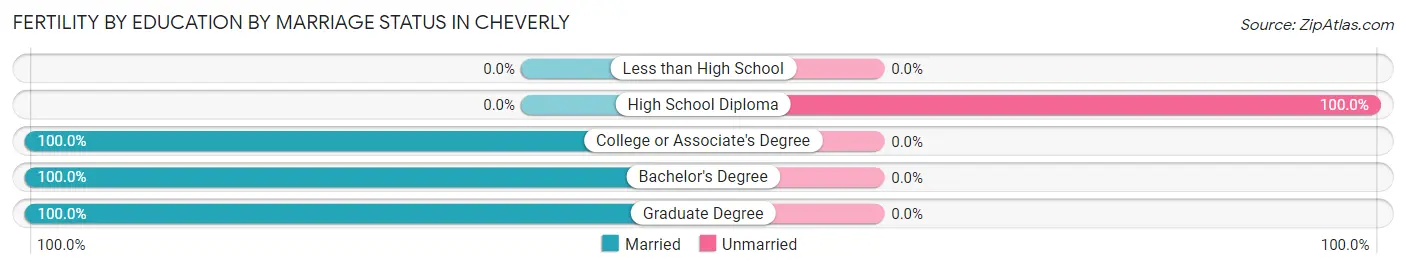
| Educational Attainment | Married | Unmarried |
| Less than High School | 0 (0.0%) | 0 (0.0%) |
| High School Diploma | 0 (0.0%) | 30 (100.0%) |
| College or Associate's Degree | 10 (100.0%) | 0 (0.0%) |
| Bachelor's Degree | 38 (100.0%) | 0 (0.0%) |
| Graduate Degree | 29 (100.0%) | 0 (0.0%) |
| Total | 77 (72.0%) | 30 (28.0%) |
Employment Characteristics in Cheverly
Employment by Class of Employer in Cheverly
Among the 3,323 employed individuals in Cheverly, private company employees (1,465 | 44.1%), federal government employees (754 | 22.7%), and not-for-profit organizations (514 | 15.5%) make up the most common classes of employment.
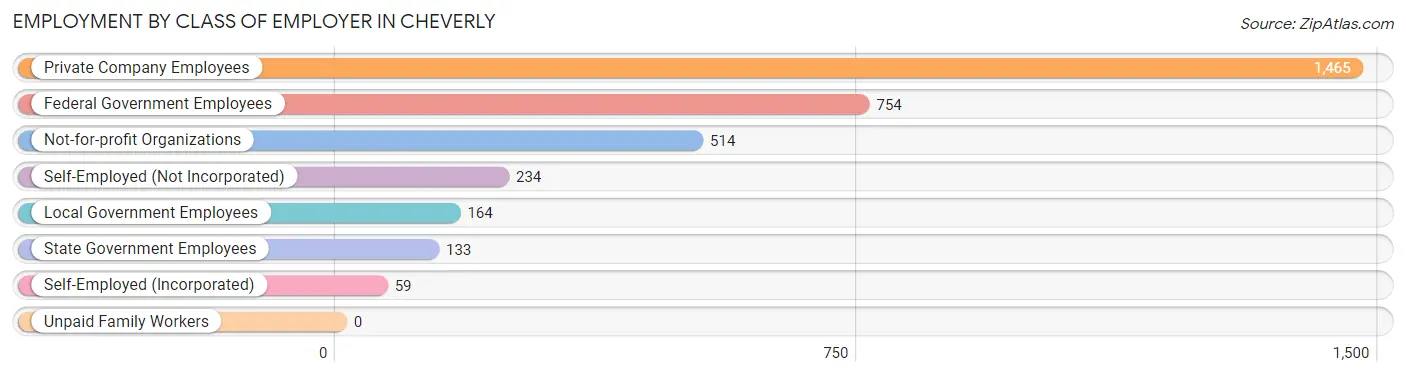
| Employer Class | # Employees | % Employees |
| Private Company Employees | 1,465 | 44.1% |
| Self-Employed (Incorporated) | 59 | 1.8% |
| Self-Employed (Not Incorporated) | 234 | 7.0% |
| Not-for-profit Organizations | 514 | 15.5% |
| Local Government Employees | 164 | 4.9% |
| State Government Employees | 133 | 4.0% |
| Federal Government Employees | 754 | 22.7% |
| Unpaid Family Workers | 0 | 0.0% |
| Total | 3,323 | 100.0% |
Employment Status by Age in Cheverly
According to the labor force statistics for Cheverly, out of the total population over 16 years of age (4,907), 72.8% or 3,572 individuals are in the labor force, with 6.4% or 229 of them unemployed. The age group with the highest labor force participation rate is 30 to 34 years, with 93.1% or 458 individuals in the labor force. Within the labor force, the 16 to 19 years age range has the highest percentage of unemployed individuals, with 34.0% or 17 of them being unemployed.
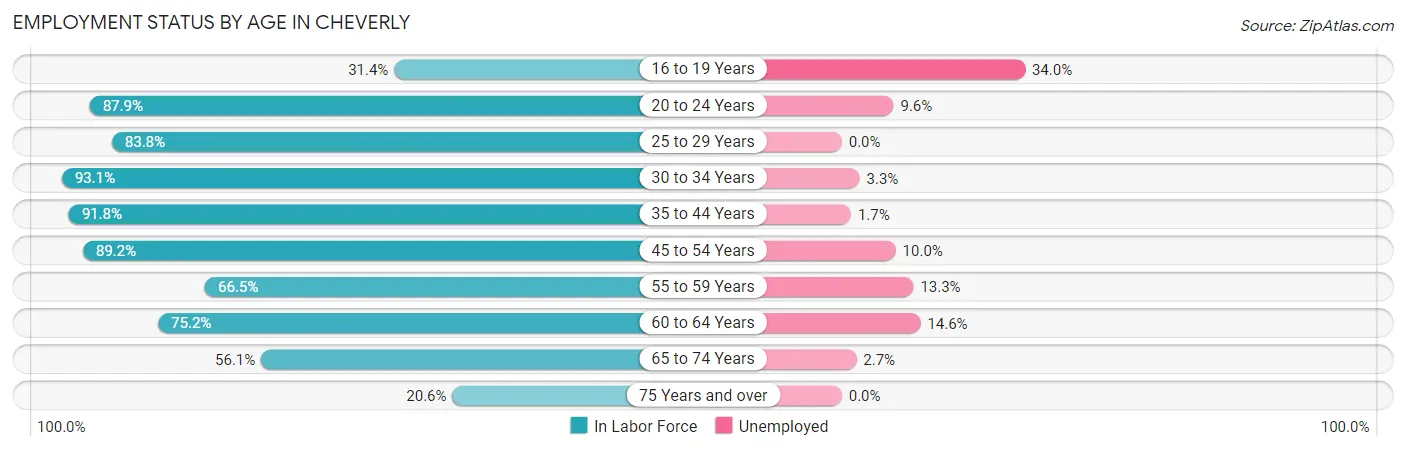
| Age Bracket | In Labor Force | Unemployed |
| 16 to 19 Years | 50 (31.4%) | 17 (34.0%) |
| 20 to 24 Years | 240 (87.9%) | 23 (9.6%) |
| 25 to 29 Years | 181 (83.8%) | 0 (0.0%) |
| 30 to 34 Years | 458 (93.1%) | 15 (3.3%) |
| 35 to 44 Years | 889 (91.8%) | 15 (1.7%) |
| 45 to 54 Years | 667 (89.2%) | 67 (10.0%) |
| 55 to 59 Years | 339 (66.5%) | 45 (13.3%) |
| 60 to 64 Years | 240 (75.2%) | 35 (14.6%) |
| 65 to 74 Years | 403 (56.1%) | 11 (2.7%) |
| 75 Years and over | 104 (20.6%) | 0 (0.0%) |
| Total | 3,572 (72.8%) | 229 (6.4%) |
Employment Status by Educational Attainment in Cheverly
According to labor force statistics for Cheverly, 85.3% of individuals (2,775) out of the total population between 25 and 64 years of age (3,253) are in the labor force, with 6.4% or 178 of them being unemployed. The group with the highest labor force participation rate are those with the educational attainment of bachelor's degree or higher, with 89.8% or 1,712 individuals in the labor force. Within the labor force, individuals with less than high school education have the highest percentage of unemployment, with 17.9% or 15 of them being unemployed.
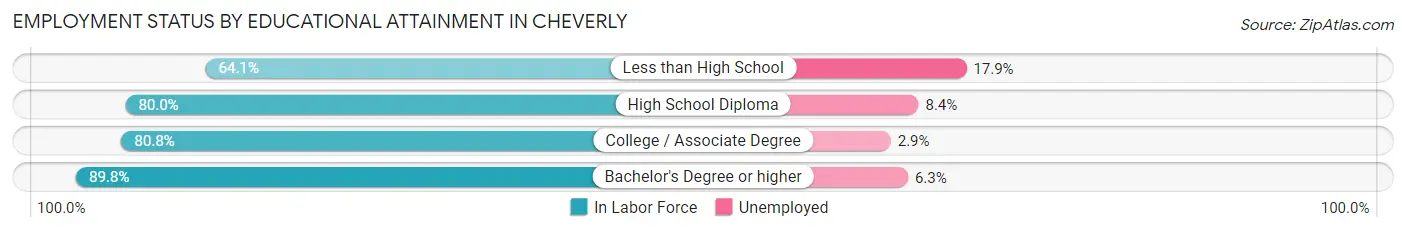
| Educational Attainment | In Labor Force | Unemployed |
| Less than High School | 84 (64.1%) | 23 (17.9%) |
| High School Diploma | 465 (80.0%) | 49 (8.4%) |
| College / Associate Degree | 512 (80.8%) | 18 (2.9%) |
| Bachelor's Degree or higher | 1,712 (89.8%) | 120 (6.3%) |
| Total | 2,775 (85.3%) | 208 (6.4%) |
Employment Occupations by Sex in Cheverly
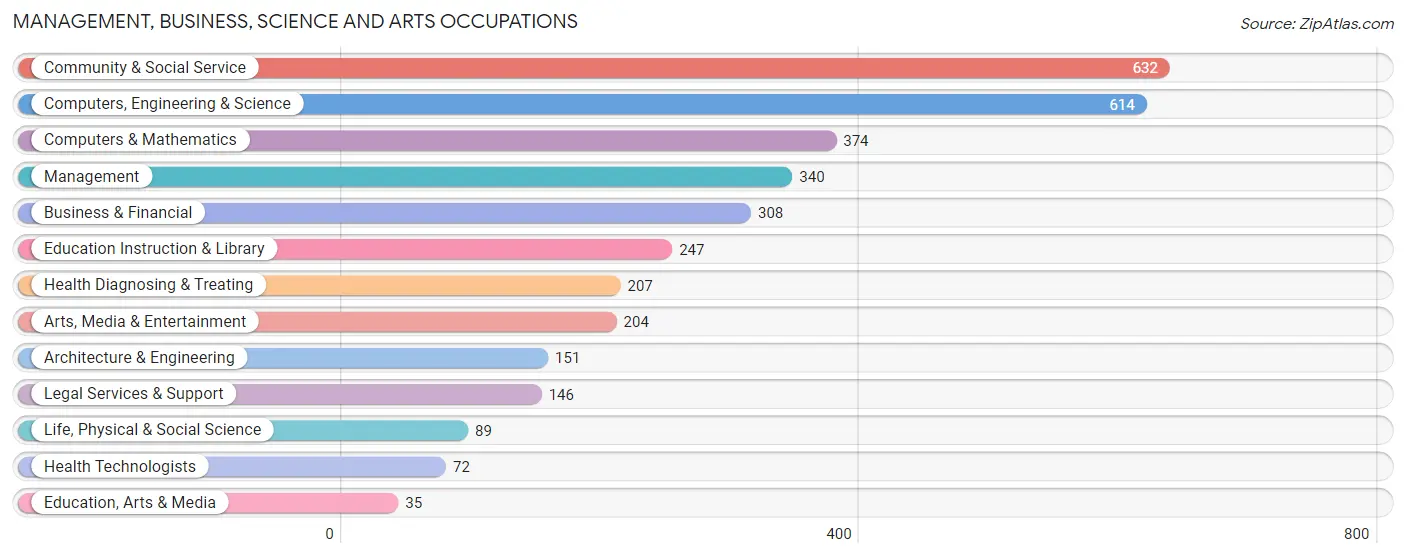
Management, Business, Science and Arts Occupations
The most common Management, Business, Science and Arts occupations in Cheverly are Community & Social Service (632 | 18.9%), Computers, Engineering & Science (614 | 18.4%), Computers & Mathematics (374 | 11.2%), Management (340 | 10.2%), and Business & Financial (308 | 9.2%).
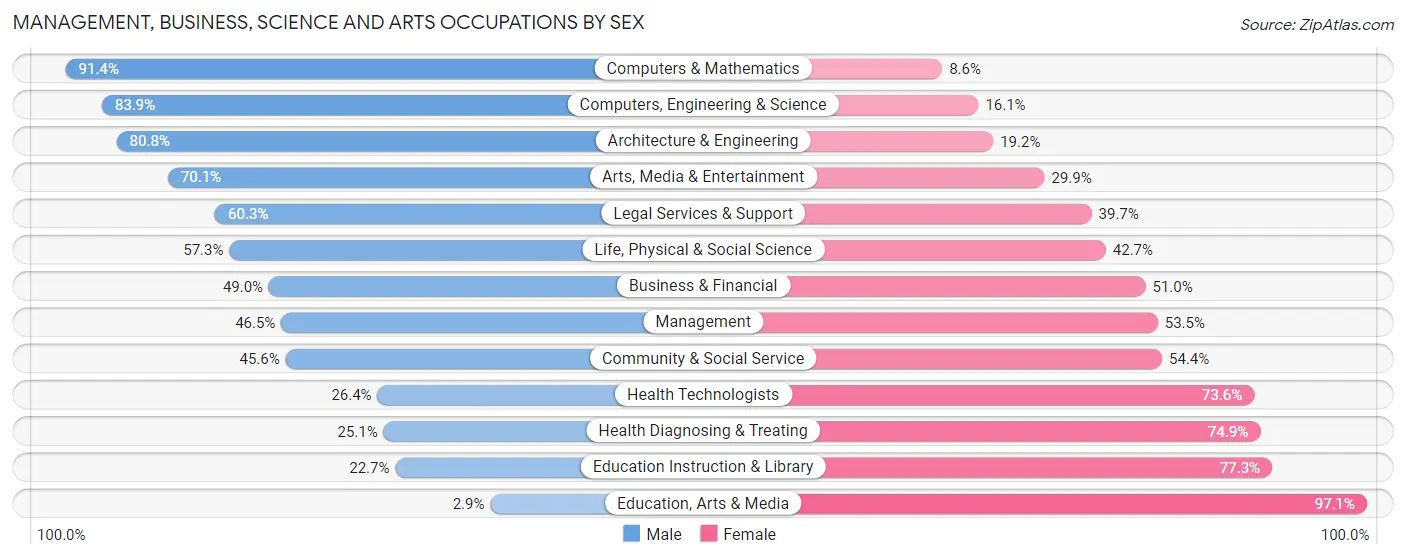
Management, Business, Science and Arts Occupations by Sex
Within the Management, Business, Science and Arts occupations in Cheverly, the most male-oriented occupations are Computers & Mathematics (91.4%), Computers, Engineering & Science (83.9%), and Architecture & Engineering (80.8%), while the most female-oriented occupations are Education, Arts & Media (97.1%), Education Instruction & Library (77.3%), and Health Diagnosing & Treating (74.9%).
| Occupation | Male | Female |
| Management | 158 (46.5%) | 182 (53.5%) |
| Business & Financial | 151 (49.0%) | 157 (51.0%) |
| Computers, Engineering & Science | 515 (83.9%) | 99 (16.1%) |
| Computers & Mathematics | 342 (91.4%) | 32 (8.6%) |
| Architecture & Engineering | 122 (80.8%) | 29 (19.2%) |
| Life, Physical & Social Science | 51 (57.3%) | 38 (42.7%) |
| Community & Social Service | 288 (45.6%) | 344 (54.4%) |
| Education, Arts & Media | 1 (2.9%) | 34 (97.1%) |
| Legal Services & Support | 88 (60.3%) | 58 (39.7%) |
| Education Instruction & Library | 56 (22.7%) | 191 (77.3%) |
| Arts, Media & Entertainment | 143 (70.1%) | 61 (29.9%) |
| Health Diagnosing & Treating | 52 (25.1%) | 155 (74.9%) |
| Health Technologists | 19 (26.4%) | 53 (73.6%) |
| Total (Category) | 1,164 (55.4%) | 937 (44.6%) |
| Total (Overall) | 1,707 (51.1%) | 1,636 (48.9%) |
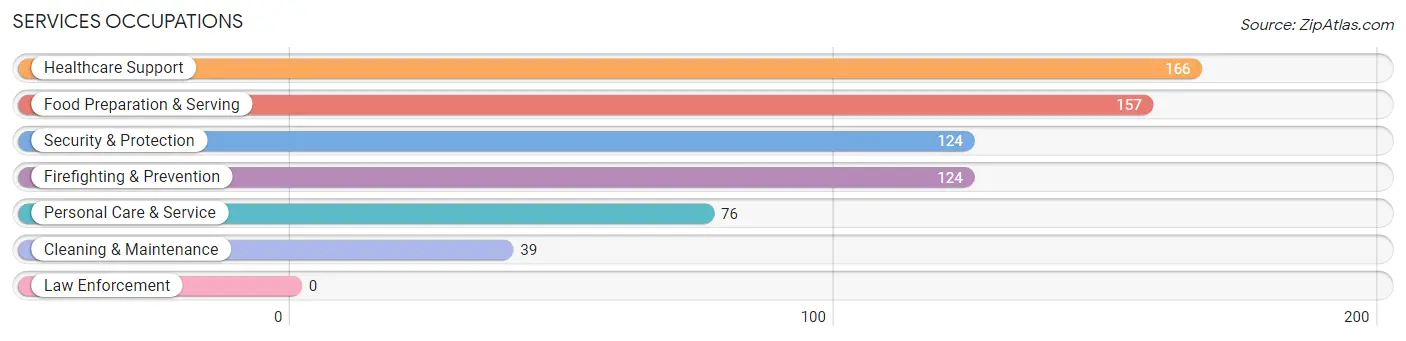
Services Occupations
The most common Services occupations in Cheverly are Healthcare Support (166 | 5.0%), Food Preparation & Serving (157 | 4.7%), Security & Protection (124 | 3.7%), Firefighting & Prevention (124 | 3.7%), and Personal Care & Service (76 | 2.3%).
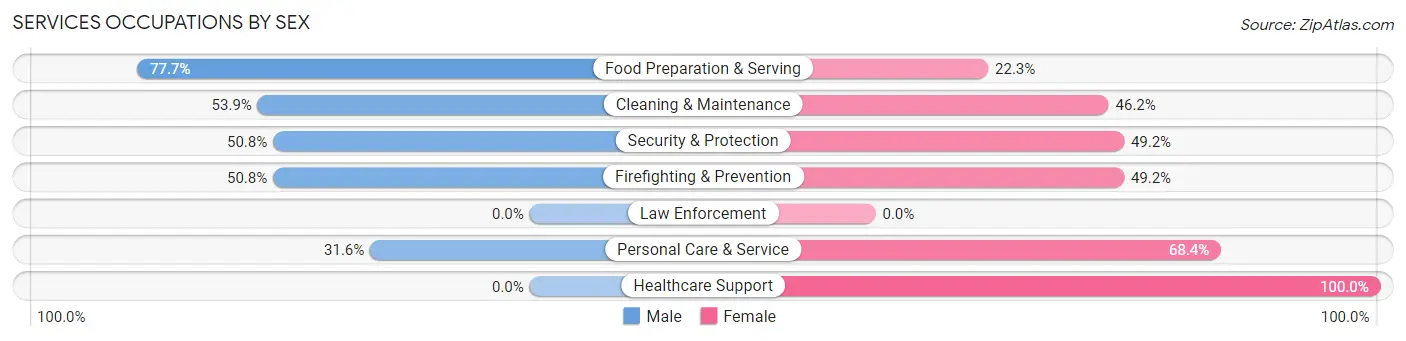
Services Occupations by Sex
Within the Services occupations in Cheverly, the most male-oriented occupations are Food Preparation & Serving (77.7%), Cleaning & Maintenance (53.8%), and Security & Protection (50.8%), while the most female-oriented occupations are Healthcare Support (100.0%), Personal Care & Service (68.4%), and Security & Protection (49.2%).
| Occupation | Male | Female |
| Healthcare Support | 0 (0.0%) | 166 (100.0%) |
| Security & Protection | 63 (50.8%) | 61 (49.2%) |
| Firefighting & Prevention | 63 (50.8%) | 61 (49.2%) |
| Law Enforcement | 0 (0.0%) | 0 (0.0%) |
| Food Preparation & Serving | 122 (77.7%) | 35 (22.3%) |
| Cleaning & Maintenance | 21 (53.8%) | 18 (46.2%) |
| Personal Care & Service | 24 (31.6%) | 52 (68.4%) |
| Total (Category) | 230 (40.9%) | 332 (59.1%) |
| Total (Overall) | 1,707 (51.1%) | 1,636 (48.9%) |
Sales and Office Occupations
The most common Sales and Office occupations in Cheverly are Office & Administration (371 | 11.1%), and Sales & Related (121 | 3.6%).
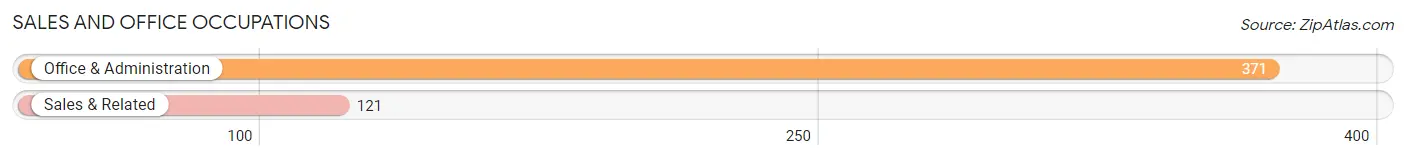
Sales and Office Occupations by Sex
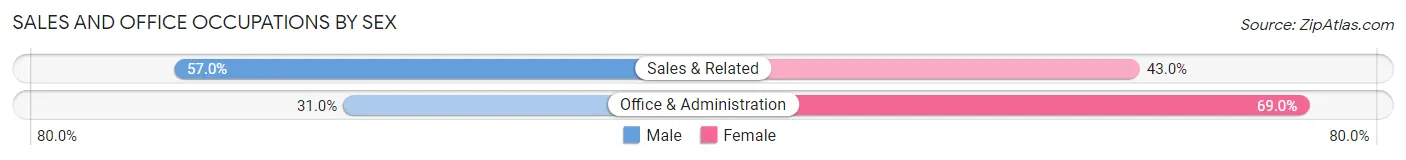
| Occupation | Male | Female |
| Sales & Related | 69 (57.0%) | 52 (43.0%) |
| Office & Administration | 115 (31.0%) | 256 (69.0%) |
| Total (Category) | 184 (37.4%) | 308 (62.6%) |
| Total (Overall) | 1,707 (51.1%) | 1,636 (48.9%) |
Natural Resources, Construction and Maintenance Occupations
The most common Natural Resources, Construction and Maintenance occupations in Cheverly are Construction & Extraction (62 | 1.8%), Installation, Maintenance & Repair (37 | 1.1%), and Farming, Fishing & Forestry (16 | 0.5%).
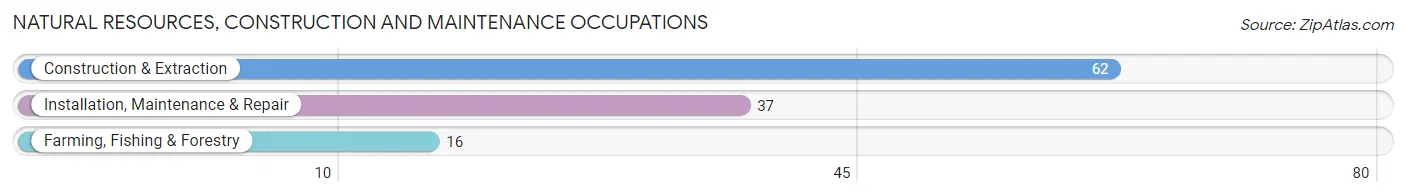
Natural Resources, Construction and Maintenance Occupations by Sex
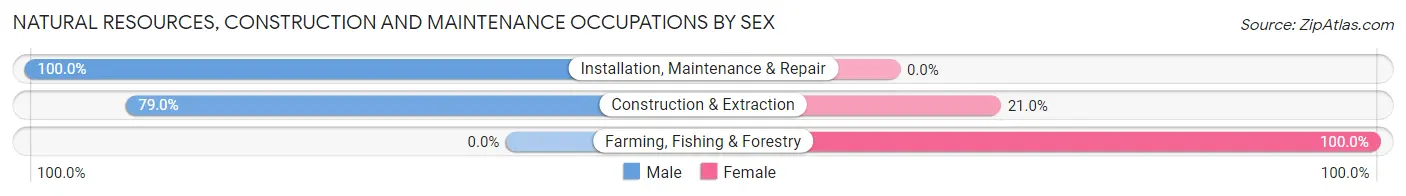
| Occupation | Male | Female |
| Farming, Fishing & Forestry | 0 (0.0%) | 16 (100.0%) |
| Construction & Extraction | 49 (79.0%) | 13 (21.0%) |
| Installation, Maintenance & Repair | 37 (100.0%) | 0 (0.0%) |
| Total (Category) | 86 (74.8%) | 29 (25.2%) |
| Total (Overall) | 1,707 (51.1%) | 1,636 (48.9%) |
Production, Transportation and Moving Occupations
The most common Production, Transportation and Moving occupations in Cheverly are Transportation (40 | 1.2%), and Production (33 | 1.0%).
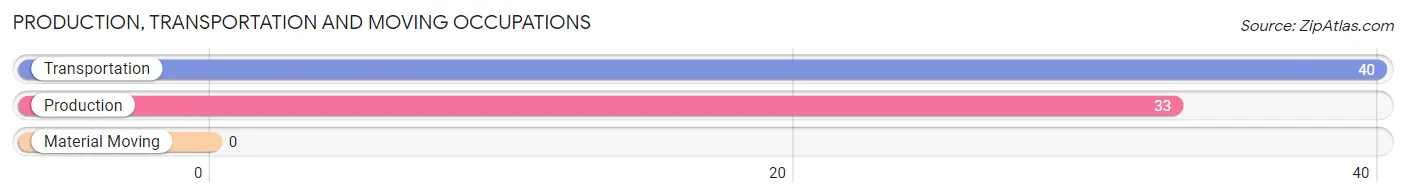
Production, Transportation and Moving Occupations by Sex
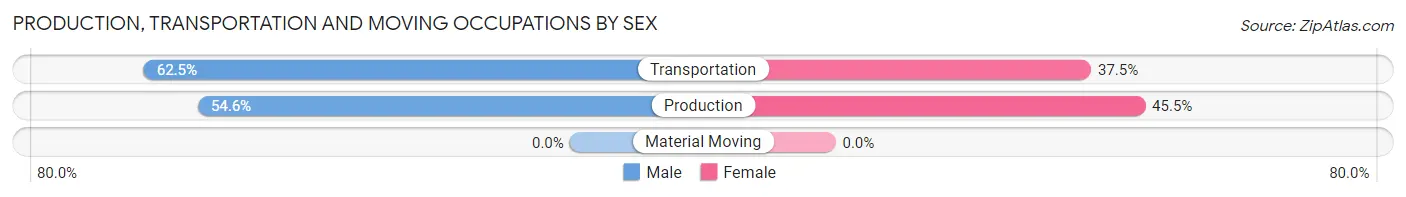
| Occupation | Male | Female |
| Production | 18 (54.5%) | 15 (45.5%) |
| Transportation | 25 (62.5%) | 15 (37.5%) |
| Material Moving | 0 (0.0%) | 0 (0.0%) |
| Total (Category) | 43 (58.9%) | 30 (41.1%) |
| Total (Overall) | 1,707 (51.1%) | 1,636 (48.9%) |
Employment Industries by Sex in Cheverly
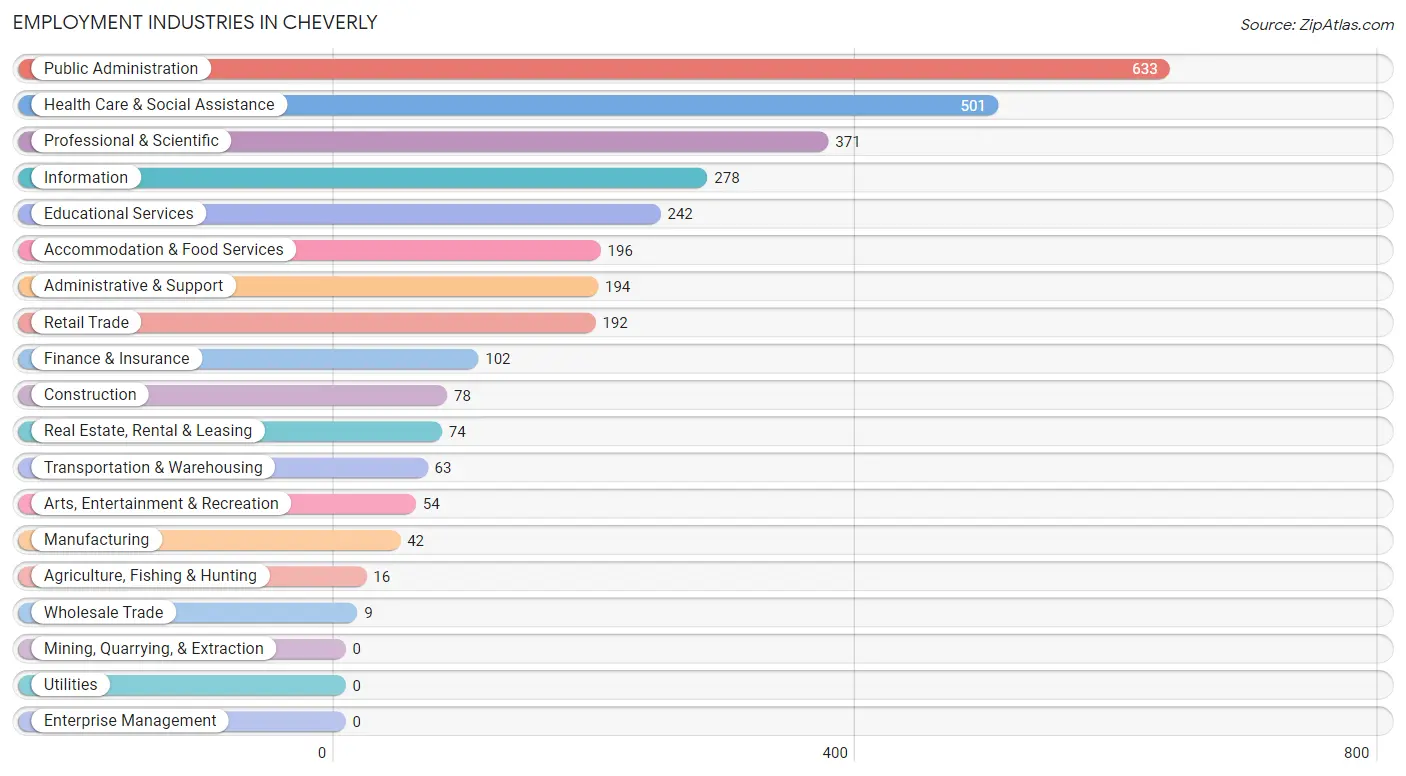
Employment Industries in Cheverly
The major employment industries in Cheverly include Public Administration (633 | 18.9%), Health Care & Social Assistance (501 | 15.0%), Professional & Scientific (371 | 11.1%), Information (278 | 8.3%), and Educational Services (242 | 7.2%).
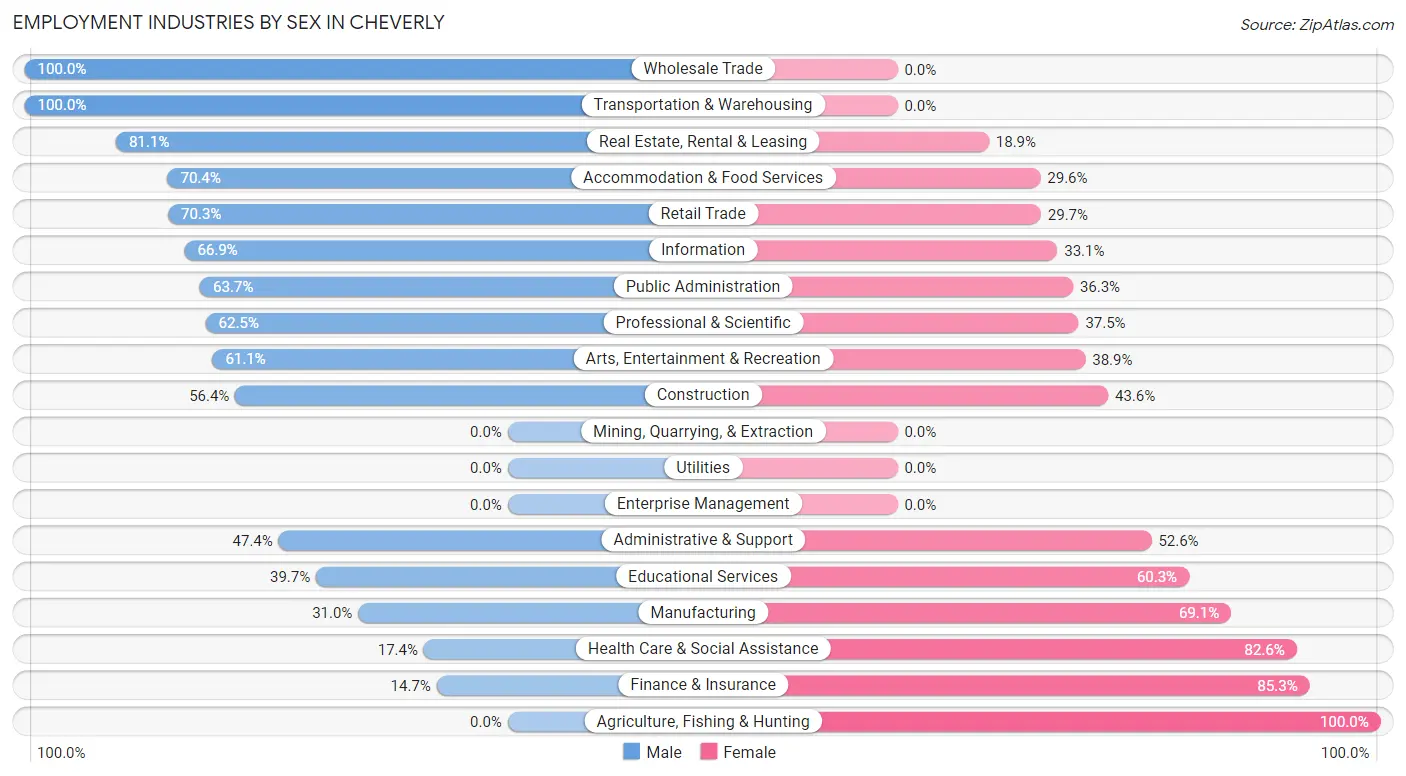
Employment Industries by Sex in Cheverly
The Cheverly industries that see more men than women are Wholesale Trade (100.0%), Transportation & Warehousing (100.0%), and Real Estate, Rental & Leasing (81.1%), whereas the industries that tend to have a higher number of women are Agriculture, Fishing & Hunting (100.0%), Finance & Insurance (85.3%), and Health Care & Social Assistance (82.6%).
| Industry | Male | Female |
| Agriculture, Fishing & Hunting | 0 (0.0%) | 16 (100.0%) |
| Mining, Quarrying, & Extraction | 0 (0.0%) | 0 (0.0%) |
| Construction | 44 (56.4%) | 34 (43.6%) |
| Manufacturing | 13 (30.9%) | 29 (69.1%) |
| Wholesale Trade | 9 (100.0%) | 0 (0.0%) |
| Retail Trade | 135 (70.3%) | 57 (29.7%) |
| Transportation & Warehousing | 63 (100.0%) | 0 (0.0%) |
| Utilities | 0 (0.0%) | 0 (0.0%) |
| Information | 186 (66.9%) | 92 (33.1%) |
| Finance & Insurance | 15 (14.7%) | 87 (85.3%) |
| Real Estate, Rental & Leasing | 60 (81.1%) | 14 (18.9%) |
| Professional & Scientific | 232 (62.5%) | 139 (37.5%) |
| Enterprise Management | 0 (0.0%) | 0 (0.0%) |
| Administrative & Support | 92 (47.4%) | 102 (52.6%) |
| Educational Services | 96 (39.7%) | 146 (60.3%) |
| Health Care & Social Assistance | 87 (17.4%) | 414 (82.6%) |
| Arts, Entertainment & Recreation | 33 (61.1%) | 21 (38.9%) |
| Accommodation & Food Services | 138 (70.4%) | 58 (29.6%) |
| Public Administration | 403 (63.7%) | 230 (36.3%) |
| Total | 1,707 (51.1%) | 1,636 (48.9%) |
Education in Cheverly
School Enrollment in Cheverly
The most common levels of schooling among the 1,153 students in Cheverly are elementary school (265 | 23.0%), college / undergraduate (210 | 18.2%), and middle school (202 | 17.5%).
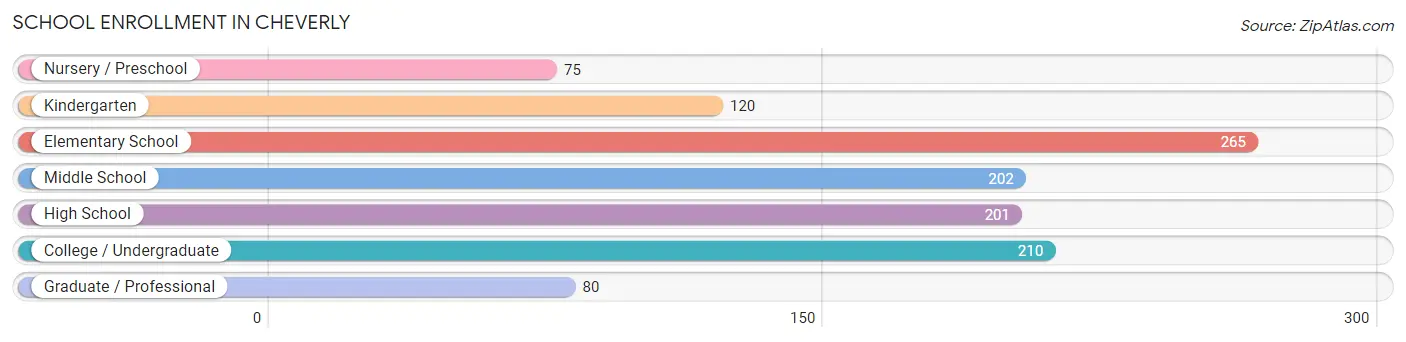
| School Level | # Students | % Students |
| Nursery / Preschool | 75 | 6.5% |
| Kindergarten | 120 | 10.4% |
| Elementary School | 265 | 23.0% |
| Middle School | 202 | 17.5% |
| High School | 201 | 17.4% |
| College / Undergraduate | 210 | 18.2% |
| Graduate / Professional | 80 | 6.9% |
| Total | 1,153 | 100.0% |
School Enrollment by Age by Funding Source in Cheverly
Out of a total of 1,153 students who are enrolled in schools in Cheverly, 300 (26.0%) attend a private institution, while the remaining 853 (74.0%) are enrolled in public schools. The age group of 3 to 4 year olds has the highest likelihood of being enrolled in private schools, with 52 (100.0% in the age bracket) enrolled. Conversely, the age group of 18 to 19 year olds has the lowest likelihood of being enrolled in a private school, with 33 (100.0% in the age bracket) attending a public institution.
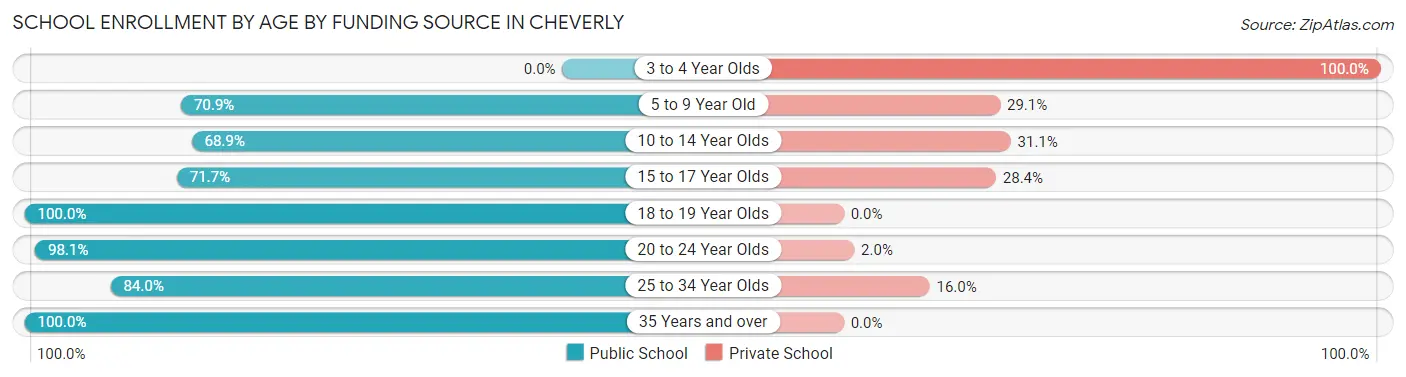
| Age Bracket | Public School | Private School |
| 3 to 4 Year Olds | 0 (0.0%) | 52 (100.0%) |
| 5 to 9 Year Old | 253 (70.9%) | 104 (29.1%) |
| 10 to 14 Year Olds | 206 (68.9%) | 93 (31.1%) |
| 15 to 17 Year Olds | 91 (71.7%) | 36 (28.3%) |
| 18 to 19 Year Olds | 33 (100.0%) | 0 (0.0%) |
| 20 to 24 Year Olds | 151 (98.1%) | 3 (1.9%) |
| 25 to 34 Year Olds | 63 (84.0%) | 12 (16.0%) |
| 35 Years and over | 56 (100.0%) | 0 (0.0%) |
| Total | 853 (74.0%) | 300 (26.0%) |
Educational Attainment by Field of Study in Cheverly
Social sciences (509 | 17.8%), computers & mathematics (394 | 13.8%), liberal arts & history (252 | 8.8%), visual & performing arts (251 | 8.8%), and business (234 | 8.2%) are the most common fields of study among 2,855 individuals in Cheverly who have obtained a bachelor's degree or higher.
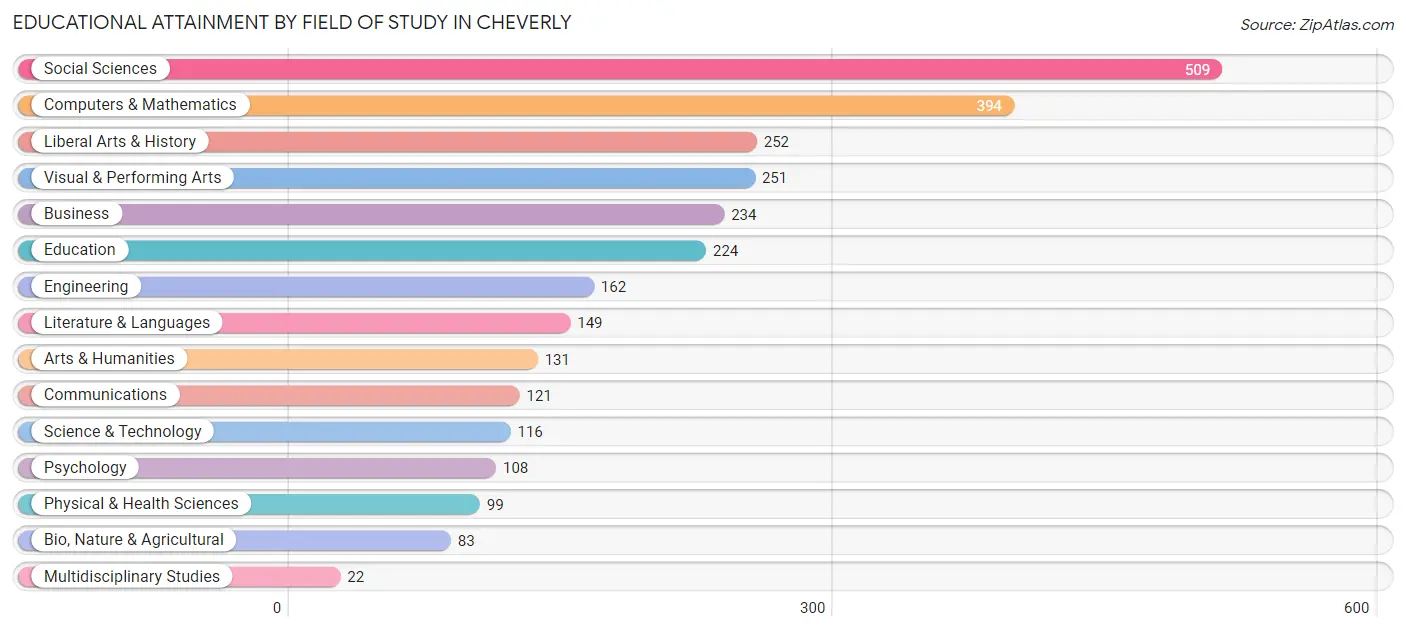
| Field of Study | # Graduates | % Graduates |
| Computers & Mathematics | 394 | 13.8% |
| Bio, Nature & Agricultural | 83 | 2.9% |
| Physical & Health Sciences | 99 | 3.5% |
| Psychology | 108 | 3.8% |
| Social Sciences | 509 | 17.8% |
| Engineering | 162 | 5.7% |
| Multidisciplinary Studies | 22 | 0.8% |
| Science & Technology | 116 | 4.1% |
| Business | 234 | 8.2% |
| Education | 224 | 7.9% |
| Literature & Languages | 149 | 5.2% |
| Liberal Arts & History | 252 | 8.8% |
| Visual & Performing Arts | 251 | 8.8% |
| Communications | 121 | 4.2% |
| Arts & Humanities | 131 | 4.6% |
| Total | 2,855 | 100.0% |
Transportation & Commute in Cheverly
Vehicle Availability by Sex in Cheverly
The most prevalent vehicle ownership categories in Cheverly are males with 2 vehicles (752, accounting for 44.1%) and females with 2 vehicles (494, making up 46.5%).
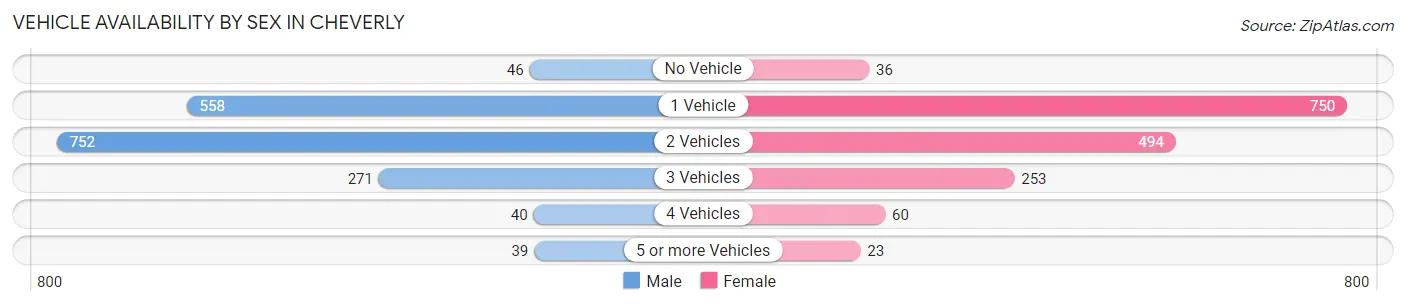
| Vehicles Available | Male | Female |
| No Vehicle | 46 (2.7%) | 36 (2.2%) |
| 1 Vehicle | 558 (32.7%) | 750 (46.4%) |
| 2 Vehicles | 752 (44.1%) | 494 (30.6%) |
| 3 Vehicles | 271 (15.9%) | 253 (15.7%) |
| 4 Vehicles | 40 (2.3%) | 60 (3.7%) |
| 5 or more Vehicles | 39 (2.3%) | 23 (1.4%) |
| Total | 1,706 (100.0%) | 1,616 (100.0%) |
Commute Time in Cheverly
The most frequently occuring commute durations in Cheverly are 30 to 34 minutes (584 commuters, 22.9%), 60 to 89 minutes (407 commuters, 16.0%), and 45 to 59 minutes (337 commuters, 13.2%).
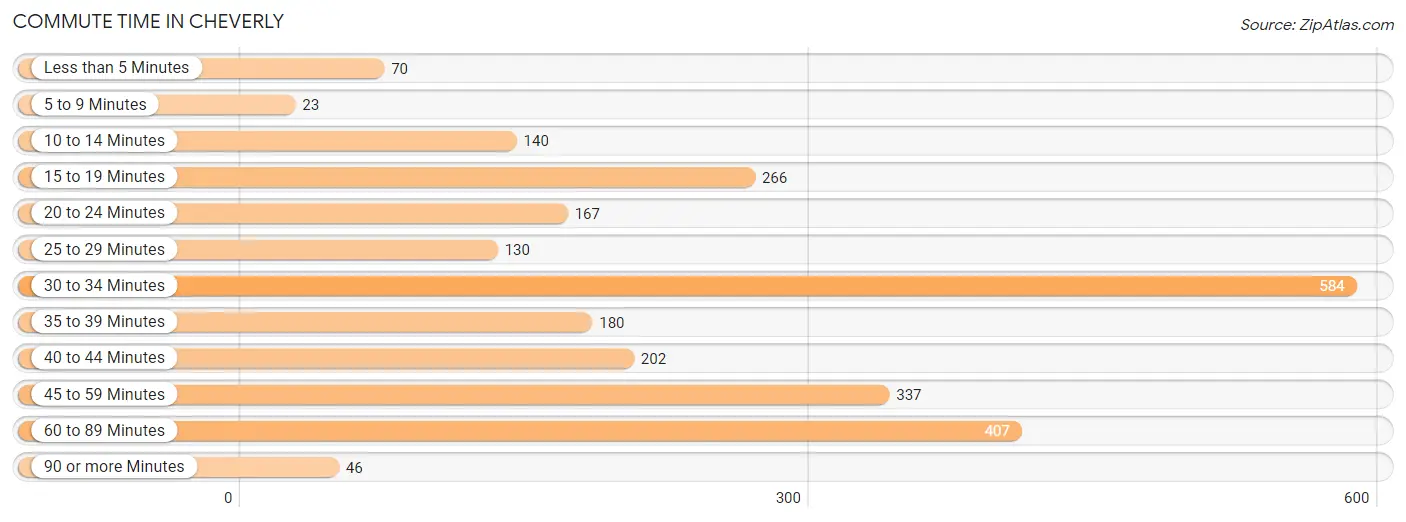
| Commute Time | # Commuters | % Commuters |
| Less than 5 Minutes | 70 | 2.7% |
| 5 to 9 Minutes | 23 | 0.9% |
| 10 to 14 Minutes | 140 | 5.5% |
| 15 to 19 Minutes | 266 | 10.4% |
| 20 to 24 Minutes | 167 | 6.5% |
| 25 to 29 Minutes | 130 | 5.1% |
| 30 to 34 Minutes | 584 | 22.9% |
| 35 to 39 Minutes | 180 | 7.0% |
| 40 to 44 Minutes | 202 | 7.9% |
| 45 to 59 Minutes | 337 | 13.2% |
| 60 to 89 Minutes | 407 | 16.0% |
| 90 or more Minutes | 46 | 1.8% |
Commute Time by Sex in Cheverly
The most common commute times in Cheverly are 30 to 34 minutes (345 commuters, 27.3%) for males and 45 to 59 minutes (259 commuters, 20.1%) for females.
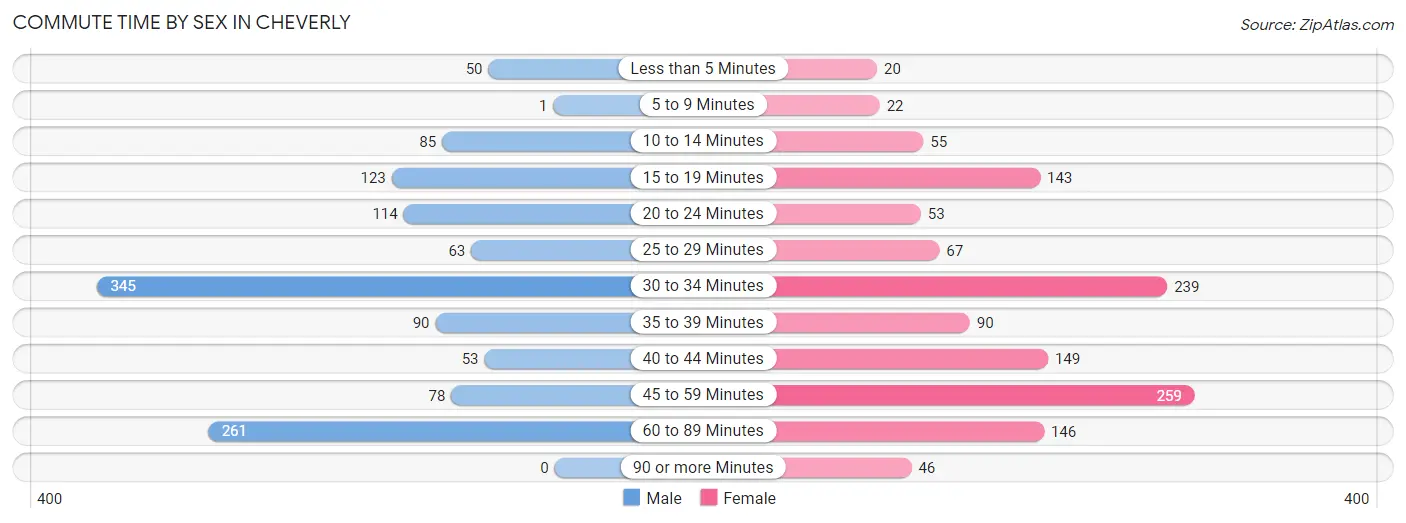
| Commute Time | Male | Female |
| Less than 5 Minutes | 50 (4.0%) | 20 (1.5%) |
| 5 to 9 Minutes | 1 (0.1%) | 22 (1.7%) |
| 10 to 14 Minutes | 85 (6.7%) | 55 (4.3%) |
| 15 to 19 Minutes | 123 (9.7%) | 143 (11.1%) |
| 20 to 24 Minutes | 114 (9.0%) | 53 (4.1%) |
| 25 to 29 Minutes | 63 (5.0%) | 67 (5.2%) |
| 30 to 34 Minutes | 345 (27.3%) | 239 (18.5%) |
| 35 to 39 Minutes | 90 (7.1%) | 90 (7.0%) |
| 40 to 44 Minutes | 53 (4.2%) | 149 (11.6%) |
| 45 to 59 Minutes | 78 (6.2%) | 259 (20.1%) |
| 60 to 89 Minutes | 261 (20.7%) | 146 (11.3%) |
| 90 or more Minutes | 0 (0.0%) | 46 (3.6%) |
Time of Departure to Work by Sex in Cheverly
The most frequent times of departure to work in Cheverly are 9:00 AM to 9:59 AM (175, 13.9%) for males and 7:30 AM to 7:59 AM (206, 16.0%) for females.
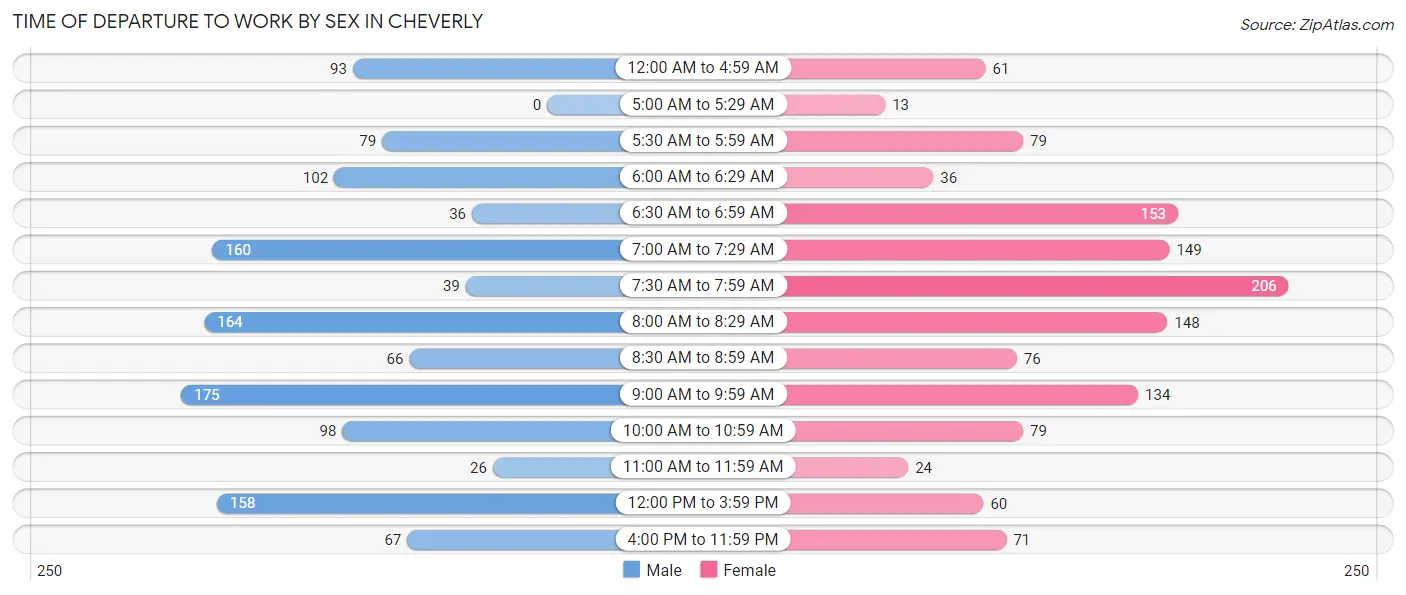
| Time of Departure | Male | Female |
| 12:00 AM to 4:59 AM | 93 (7.4%) | 61 (4.7%) |
| 5:00 AM to 5:29 AM | 0 (0.0%) | 13 (1.0%) |
| 5:30 AM to 5:59 AM | 79 (6.2%) | 79 (6.1%) |
| 6:00 AM to 6:29 AM | 102 (8.1%) | 36 (2.8%) |
| 6:30 AM to 6:59 AM | 36 (2.9%) | 153 (11.9%) |
| 7:00 AM to 7:29 AM | 160 (12.7%) | 149 (11.6%) |
| 7:30 AM to 7:59 AM | 39 (3.1%) | 206 (16.0%) |
| 8:00 AM to 8:29 AM | 164 (13.0%) | 148 (11.5%) |
| 8:30 AM to 8:59 AM | 66 (5.2%) | 76 (5.9%) |
| 9:00 AM to 9:59 AM | 175 (13.9%) | 134 (10.4%) |
| 10:00 AM to 10:59 AM | 98 (7.8%) | 79 (6.1%) |
| 11:00 AM to 11:59 AM | 26 (2.1%) | 24 (1.9%) |
| 12:00 PM to 3:59 PM | 158 (12.5%) | 60 (4.6%) |
| 4:00 PM to 11:59 PM | 67 (5.3%) | 71 (5.5%) |
| Total | 1,263 (100.0%) | 1,289 (100.0%) |
Housing Occupancy in Cheverly
Occupancy by Ownership in Cheverly
Of the total 2,557 dwellings in Cheverly, owner-occupied units account for 1,970 (77.0%), while renter-occupied units make up 587 (23.0%).
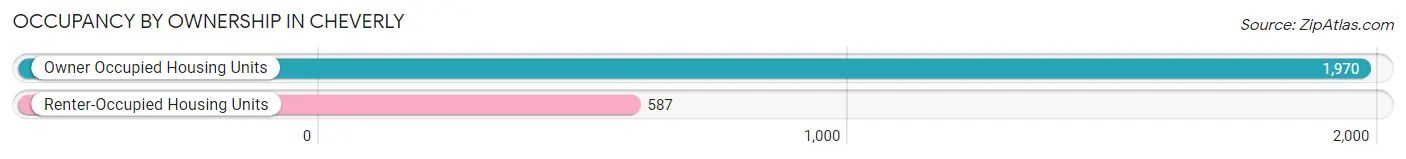
| Occupancy | # Housing Units | % Housing Units |
| Owner Occupied Housing Units | 1,970 | 77.0% |
| Renter-Occupied Housing Units | 587 | 23.0% |
| Total Occupied Housing Units | 2,557 | 100.0% |
Occupancy by Household Size in Cheverly
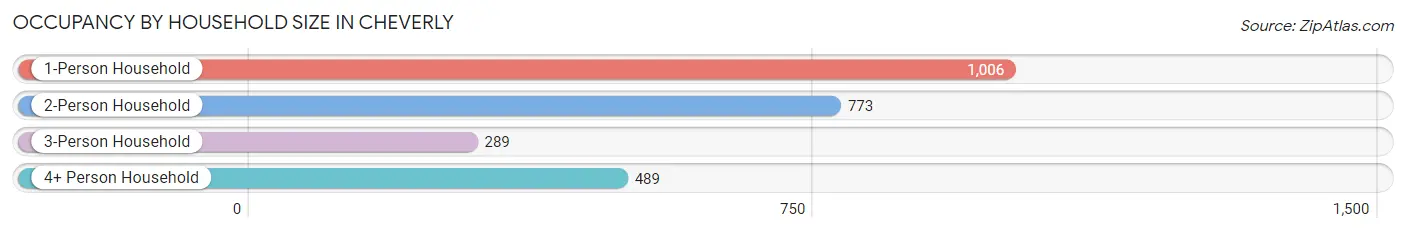
| Household Size | # Housing Units | % Housing Units |
| 1-Person Household | 1,006 | 39.3% |
| 2-Person Household | 773 | 30.2% |
| 3-Person Household | 289 | 11.3% |
| 4+ Person Household | 489 | 19.1% |
| Total Housing Units | 2,557 | 100.0% |
Occupancy by Ownership by Household Size in Cheverly
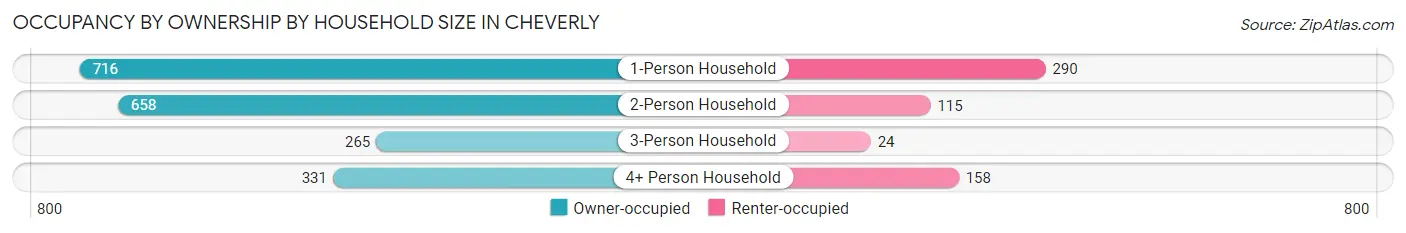
| Household Size | Owner-occupied | Renter-occupied |
| 1-Person Household | 716 (71.2%) | 290 (28.8%) |
| 2-Person Household | 658 (85.1%) | 115 (14.9%) |
| 3-Person Household | 265 (91.7%) | 24 (8.3%) |
| 4+ Person Household | 331 (67.7%) | 158 (32.3%) |
| Total Housing Units | 1,970 (77.0%) | 587 (23.0%) |
Occupancy by Educational Attainment in Cheverly
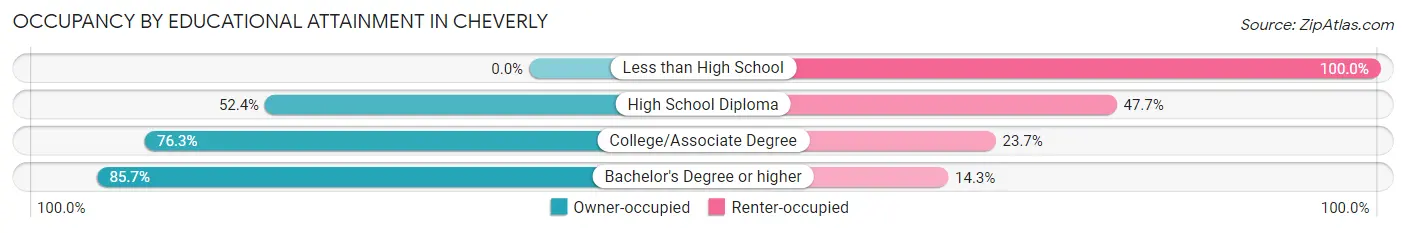
| Household Size | Owner-occupied | Renter-occupied |
| Less than High School | 0 (0.0%) | 33 (100.0%) |
| High School Diploma | 212 (52.3%) | 193 (47.6%) |
| College/Associate Degree | 477 (76.3%) | 148 (23.7%) |
| Bachelor's Degree or higher | 1,281 (85.7%) | 213 (14.3%) |
Occupancy by Age of Householder in Cheverly
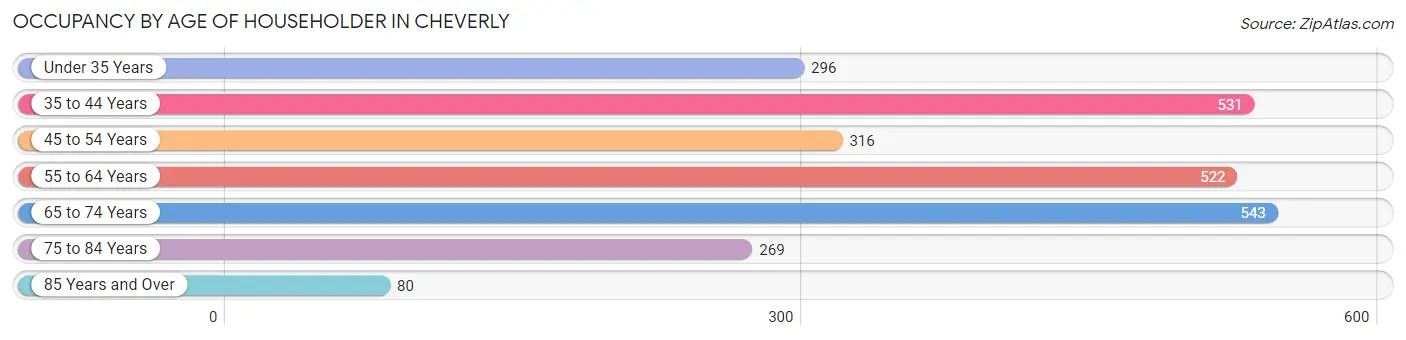
| Age Bracket | # Households | % Households |
| Under 35 Years | 296 | 11.6% |
| 35 to 44 Years | 531 | 20.8% |
| 45 to 54 Years | 316 | 12.4% |
| 55 to 64 Years | 522 | 20.4% |
| 65 to 74 Years | 543 | 21.2% |
| 75 to 84 Years | 269 | 10.5% |
| 85 Years and Over | 80 | 3.1% |
| Total | 2,557 | 100.0% |
Housing Finances in Cheverly
Median Income by Occupancy in Cheverly
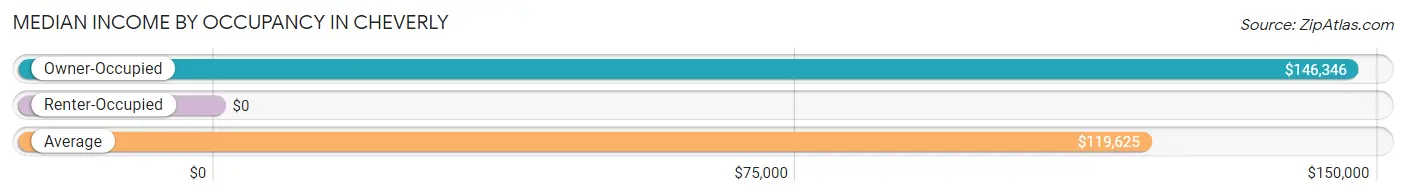
| Occupancy Type | # Households | Median Income |
| Owner-Occupied | 1,970 (77.0%) | $146,346 |
| Renter-Occupied | 587 (23.0%) | $0 |
| Average | 2,557 (100.0%) | $119,625 |
Occupancy by Householder Income Bracket in Cheverly
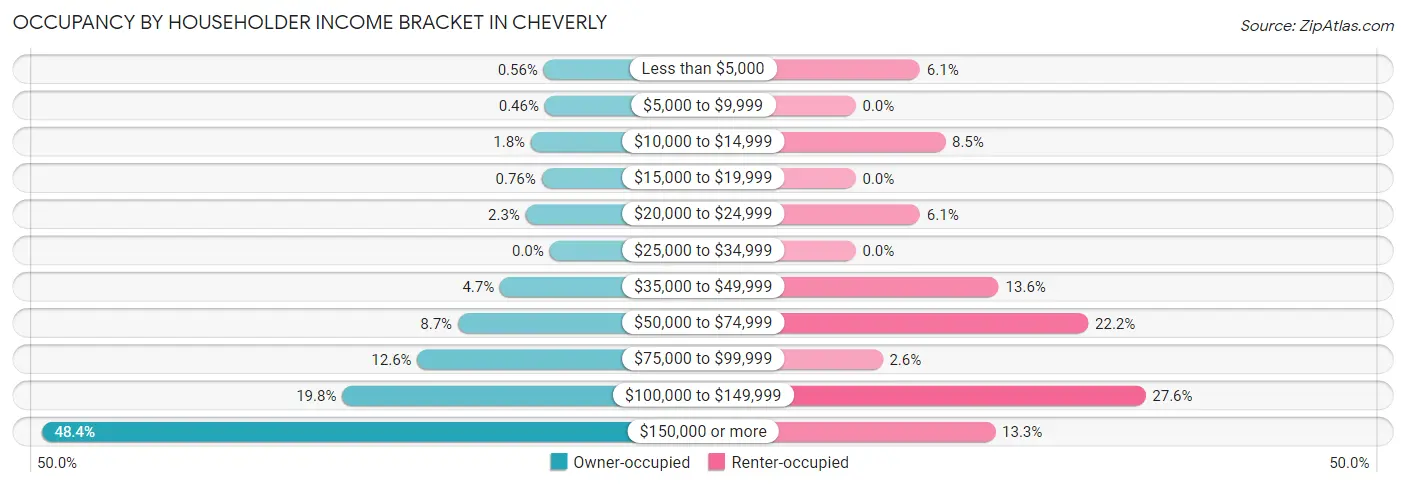
| Income Bracket | Owner-occupied | Renter-occupied |
| Less than $5,000 | 11 (0.6%) | 36 (6.1%) |
| $5,000 to $9,999 | 9 (0.5%) | 0 (0.0%) |
| $10,000 to $14,999 | 35 (1.8%) | 50 (8.5%) |
| $15,000 to $19,999 | 15 (0.8%) | 0 (0.0%) |
| $20,000 to $24,999 | 45 (2.3%) | 36 (6.1%) |
| $25,000 to $34,999 | 0 (0.0%) | 0 (0.0%) |
| $35,000 to $49,999 | 93 (4.7%) | 80 (13.6%) |
| $50,000 to $74,999 | 172 (8.7%) | 130 (22.2%) |
| $75,000 to $99,999 | 248 (12.6%) | 15 (2.6%) |
| $100,000 to $149,999 | 389 (19.8%) | 162 (27.6%) |
| $150,000 or more | 953 (48.4%) | 78 (13.3%) |
| Total | 1,970 (100.0%) | 587 (100.0%) |
Monthly Housing Cost Tiers in Cheverly
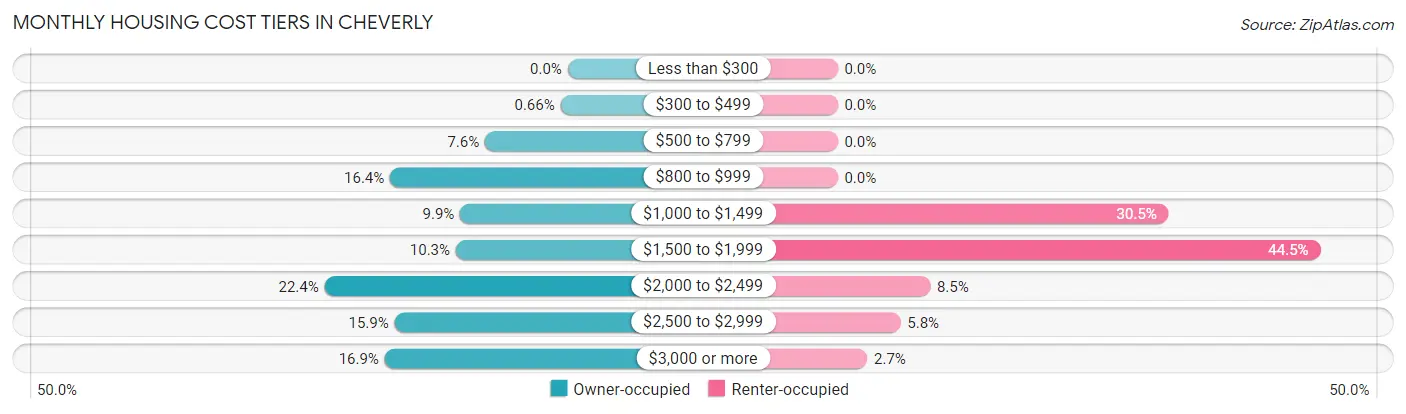
| Monthly Cost | Owner-occupied | Renter-occupied |
| Less than $300 | 0 (0.0%) | 0 (0.0%) |
| $300 to $499 | 13 (0.7%) | 0 (0.0%) |
| $500 to $799 | 150 (7.6%) | 0 (0.0%) |
| $800 to $999 | 322 (16.4%) | 0 (0.0%) |
| $1,000 to $1,499 | 195 (9.9%) | 179 (30.5%) |
| $1,500 to $1,999 | 203 (10.3%) | 261 (44.5%) |
| $2,000 to $2,499 | 441 (22.4%) | 50 (8.5%) |
| $2,500 to $2,999 | 314 (15.9%) | 34 (5.8%) |
| $3,000 or more | 332 (16.9%) | 16 (2.7%) |
| Total | 1,970 (100.0%) | 587 (100.0%) |
Physical Housing Characteristics in Cheverly
Housing Structures in Cheverly
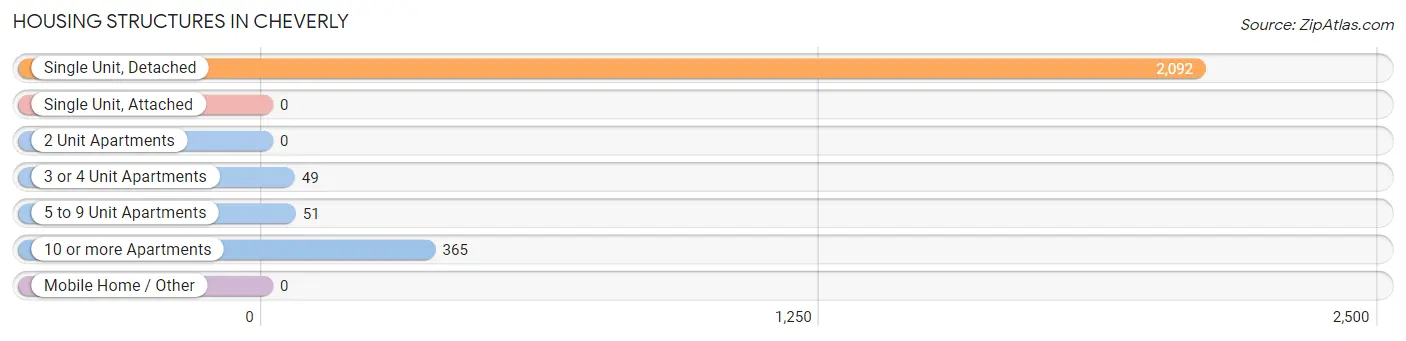
| Structure Type | # Housing Units | % Housing Units |
| Single Unit, Detached | 2,092 | 81.8% |
| Single Unit, Attached | 0 | 0.0% |
| 2 Unit Apartments | 0 | 0.0% |
| 3 or 4 Unit Apartments | 49 | 1.9% |
| 5 to 9 Unit Apartments | 51 | 2.0% |
| 10 or more Apartments | 365 | 14.3% |
| Mobile Home / Other | 0 | 0.0% |
| Total | 2,557 | 100.0% |
Housing Structures by Occupancy in Cheverly
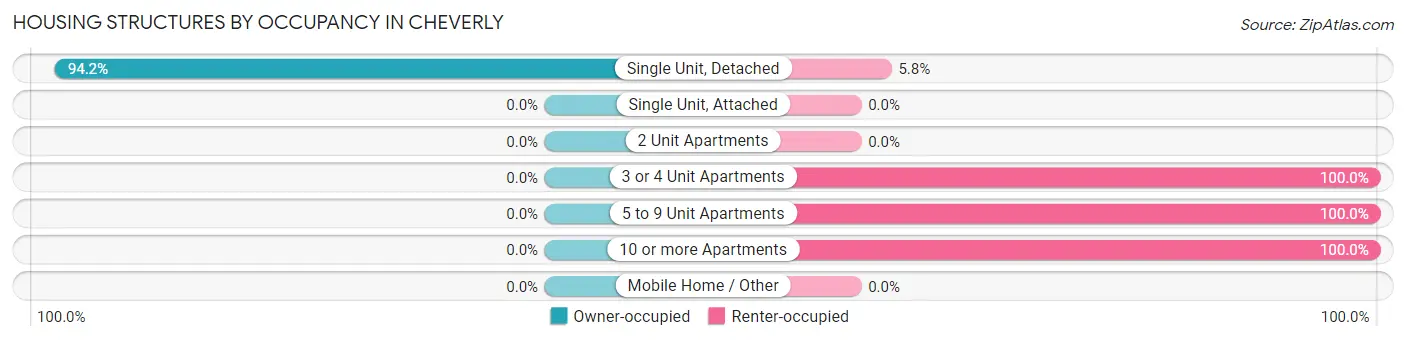
| Structure Type | Owner-occupied | Renter-occupied |
| Single Unit, Detached | 1,970 (94.2%) | 122 (5.8%) |
| Single Unit, Attached | 0 (0.0%) | 0 (0.0%) |
| 2 Unit Apartments | 0 (0.0%) | 0 (0.0%) |
| 3 or 4 Unit Apartments | 0 (0.0%) | 49 (100.0%) |
| 5 to 9 Unit Apartments | 0 (0.0%) | 51 (100.0%) |
| 10 or more Apartments | 0 (0.0%) | 365 (100.0%) |
| Mobile Home / Other | 0 (0.0%) | 0 (0.0%) |
| Total | 1,970 (77.0%) | 587 (23.0%) |
Housing Structures by Number of Rooms in Cheverly
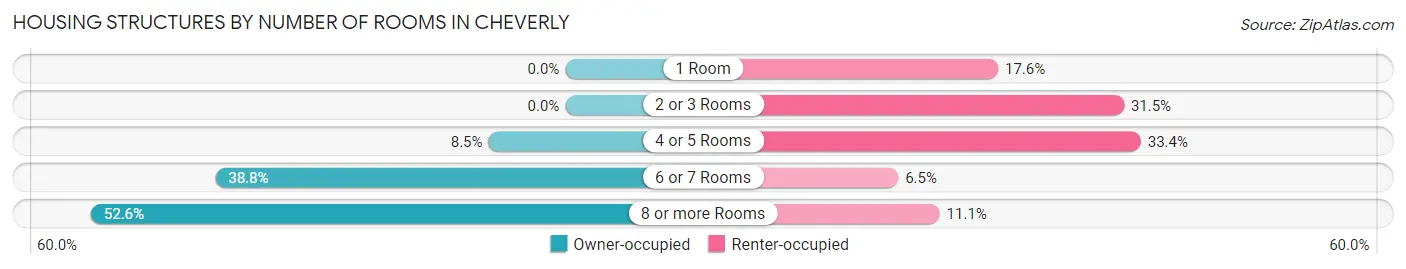
| Number of Rooms | Owner-occupied | Renter-occupied |
| 1 Room | 0 (0.0%) | 103 (17.5%) |
| 2 or 3 Rooms | 0 (0.0%) | 185 (31.5%) |
| 4 or 5 Rooms | 168 (8.5%) | 196 (33.4%) |
| 6 or 7 Rooms | 765 (38.8%) | 38 (6.5%) |
| 8 or more Rooms | 1,037 (52.6%) | 65 (11.1%) |
| Total | 1,970 (100.0%) | 587 (100.0%) |
Housing Structure by Heating Type in Cheverly
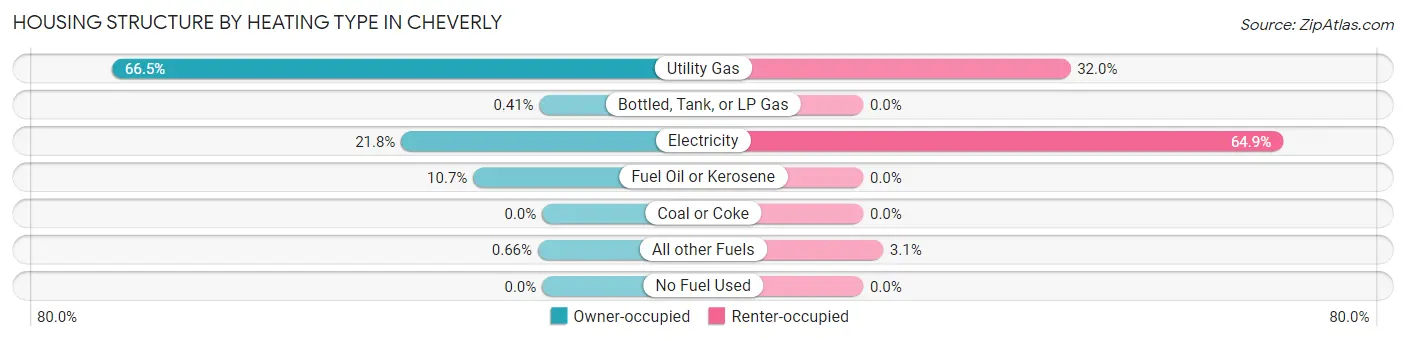
| Heating Type | Owner-occupied | Renter-occupied |
| Utility Gas | 1,310 (66.5%) | 188 (32.0%) |
| Bottled, Tank, or LP Gas | 8 (0.4%) | 0 (0.0%) |
| Electricity | 429 (21.8%) | 381 (64.9%) |
| Fuel Oil or Kerosene | 210 (10.7%) | 0 (0.0%) |
| Coal or Coke | 0 (0.0%) | 0 (0.0%) |
| All other Fuels | 13 (0.7%) | 18 (3.1%) |
| No Fuel Used | 0 (0.0%) | 0 (0.0%) |
| Total | 1,970 (100.0%) | 587 (100.0%) |
Household Vehicle Usage in Cheverly
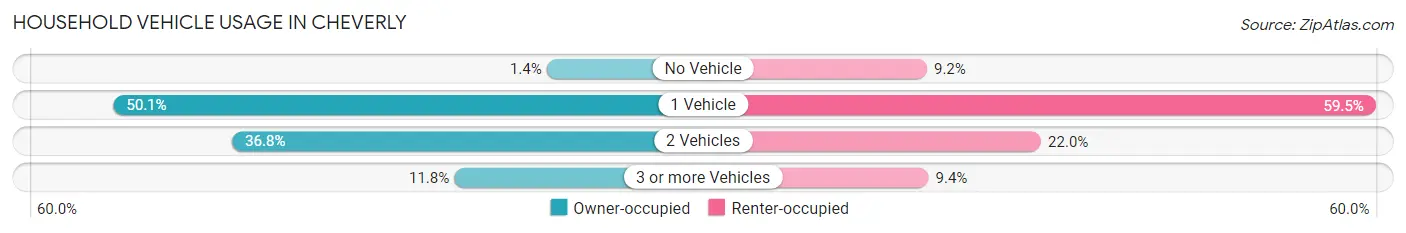
| Vehicles per Household | Owner-occupied | Renter-occupied |
| No Vehicle | 28 (1.4%) | 54 (9.2%) |
| 1 Vehicle | 986 (50.0%) | 349 (59.5%) |
| 2 Vehicles | 724 (36.7%) | 129 (22.0%) |
| 3 or more Vehicles | 232 (11.8%) | 55 (9.4%) |
| Total | 1,970 (100.0%) | 587 (100.0%) |
Real Estate & Mortgages in Cheverly
Real Estate and Mortgage Overview in Cheverly
| Characteristic | Without Mortgage | With Mortgage |
| Housing Units | 636 | 1,334 |
| Median Property Value | $401,500 | $445,100 |
| Median Household Income | $153,816 | $625 |
| Monthly Housing Costs | $872 | $332 |
| Real Estate Taxes | $6,454 | $0 |
Property Value by Mortgage Status in Cheverly
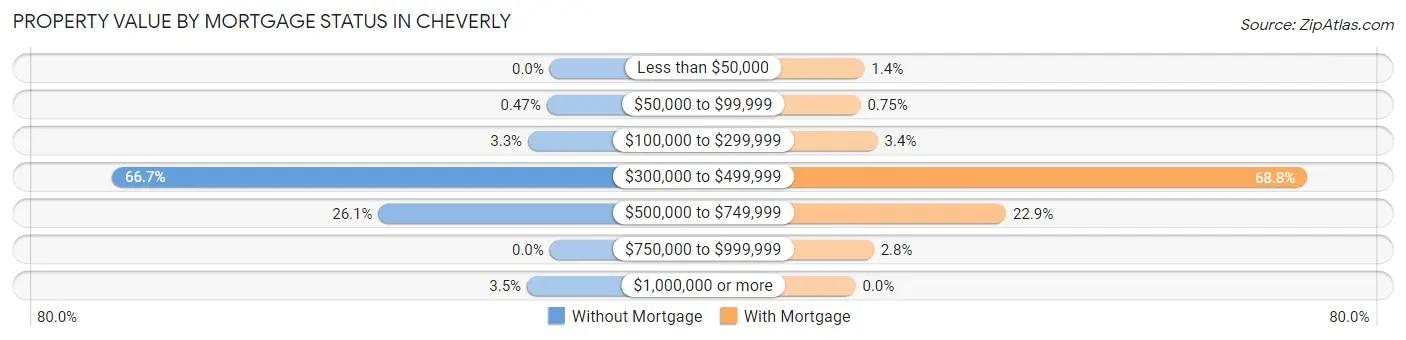
| Property Value | Without Mortgage | With Mortgage |
| Less than $50,000 | 0 (0.0%) | 18 (1.3%) |
| $50,000 to $99,999 | 3 (0.5%) | 10 (0.7%) |
| $100,000 to $299,999 | 21 (3.3%) | 45 (3.4%) |
| $300,000 to $499,999 | 424 (66.7%) | 918 (68.8%) |
| $500,000 to $749,999 | 166 (26.1%) | 306 (22.9%) |
| $750,000 to $999,999 | 0 (0.0%) | 37 (2.8%) |
| $1,000,000 or more | 22 (3.5%) | 0 (0.0%) |
| Total | 636 (100.0%) | 1,334 (100.0%) |
Household Income by Mortgage Status in Cheverly
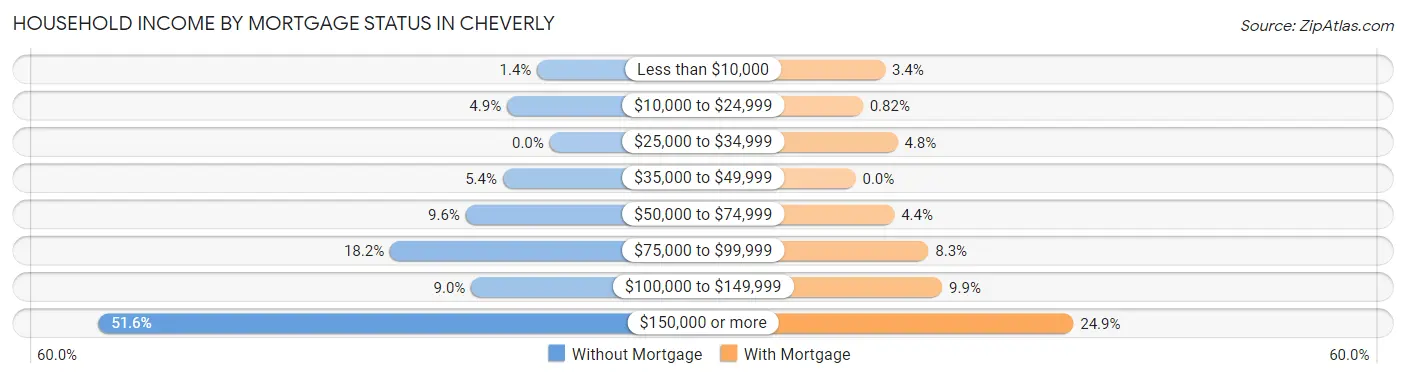
| Household Income | Without Mortgage | With Mortgage |
| Less than $10,000 | 9 (1.4%) | 45 (3.4%) |
| $10,000 to $24,999 | 31 (4.9%) | 11 (0.8%) |
| $25,000 to $34,999 | 0 (0.0%) | 64 (4.8%) |
| $35,000 to $49,999 | 34 (5.3%) | 0 (0.0%) |
| $50,000 to $74,999 | 61 (9.6%) | 59 (4.4%) |
| $75,000 to $99,999 | 116 (18.2%) | 111 (8.3%) |
| $100,000 to $149,999 | 57 (9.0%) | 132 (9.9%) |
| $150,000 or more | 328 (51.6%) | 332 (24.9%) |
| Total | 636 (100.0%) | 1,334 (100.0%) |
Property Value to Household Income Ratio in Cheverly
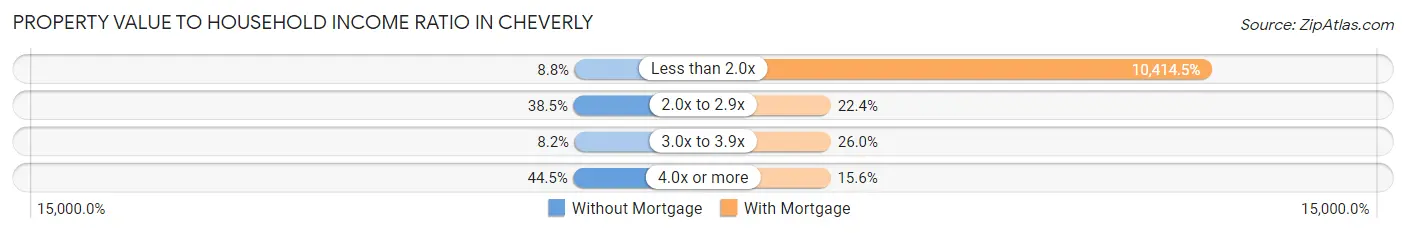
| Value-to-Income Ratio | Without Mortgage | With Mortgage |
| Less than 2.0x | 56 (8.8%) | 138,929 (10,414.5%) |
| 2.0x to 2.9x | 245 (38.5%) | 299 (22.4%) |
| 3.0x to 3.9x | 52 (8.2%) | 347 (26.0%) |
| 4.0x or more | 283 (44.5%) | 208 (15.6%) |
| Total | 636 (100.0%) | 1,334 (100.0%) |
Real Estate Taxes by Mortgage Status in Cheverly
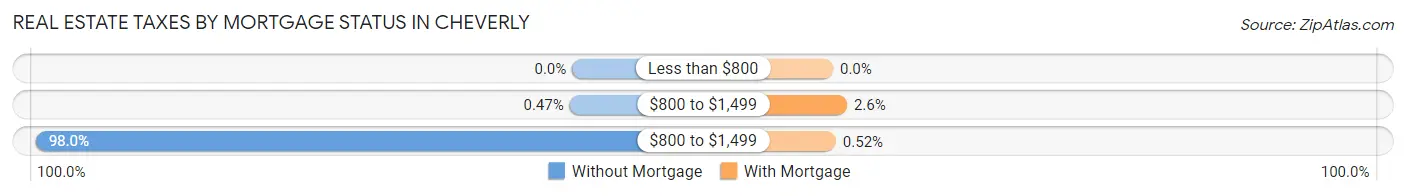
| Property Taxes | Without Mortgage | With Mortgage |
| Less than $800 | 0 (0.0%) | 0 (0.0%) |
| $800 to $1,499 | 3 (0.5%) | 34 (2.5%) |
| $800 to $1,499 | 623 (98.0%) | 7 (0.5%) |
| Total | 636 (100.0%) | 1,334 (100.0%) |
Health & Disability in Cheverly
Health Insurance Coverage by Age in Cheverly
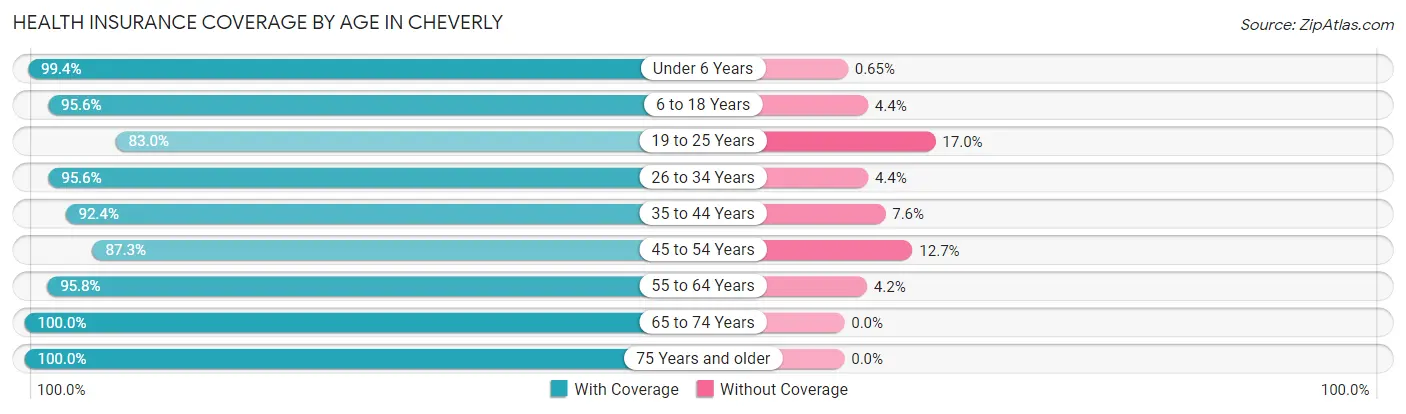
| Age Bracket | With Coverage | Without Coverage |
| Under 6 Years | 612 (99.4%) | 4 (0.6%) |
| 6 to 18 Years | 717 (95.6%) | 33 (4.4%) |
| 19 to 25 Years | 303 (83.0%) | 62 (17.0%) |
| 26 to 34 Years | 606 (95.6%) | 28 (4.4%) |
| 35 to 44 Years | 894 (92.4%) | 74 (7.6%) |
| 45 to 54 Years | 653 (87.3%) | 95 (12.7%) |
| 55 to 64 Years | 794 (95.8%) | 35 (4.2%) |
| 65 to 74 Years | 718 (100.0%) | 0 (0.0%) |
| 75 Years and older | 502 (100.0%) | 0 (0.0%) |
| Total | 5,799 (94.6%) | 331 (5.4%) |
Health Insurance Coverage by Citizenship Status in Cheverly
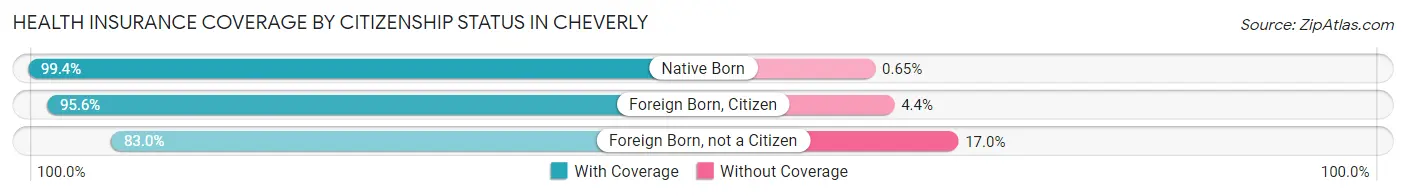
| Citizenship Status | With Coverage | Without Coverage |
| Native Born | 612 (99.4%) | 4 (0.6%) |
| Foreign Born, Citizen | 717 (95.6%) | 33 (4.4%) |
| Foreign Born, not a Citizen | 303 (83.0%) | 62 (17.0%) |
Health Insurance Coverage by Household Income in Cheverly
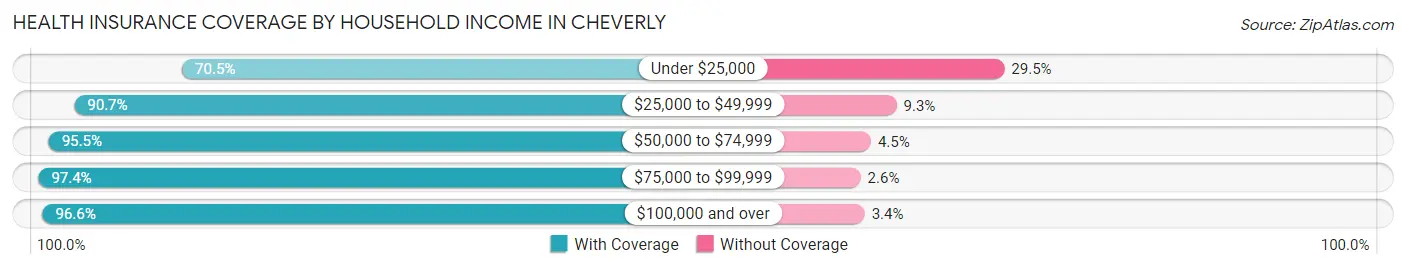
| Household Income | With Coverage | Without Coverage |
| Under $25,000 | 272 (70.5%) | 114 (29.5%) |
| $25,000 to $49,999 | 272 (90.7%) | 28 (9.3%) |
| $50,000 to $74,999 | 800 (95.5%) | 38 (4.5%) |
| $75,000 to $99,999 | 449 (97.4%) | 12 (2.6%) |
| $100,000 and over | 3,998 (96.6%) | 139 (3.4%) |
Public vs Private Health Insurance Coverage by Age in Cheverly
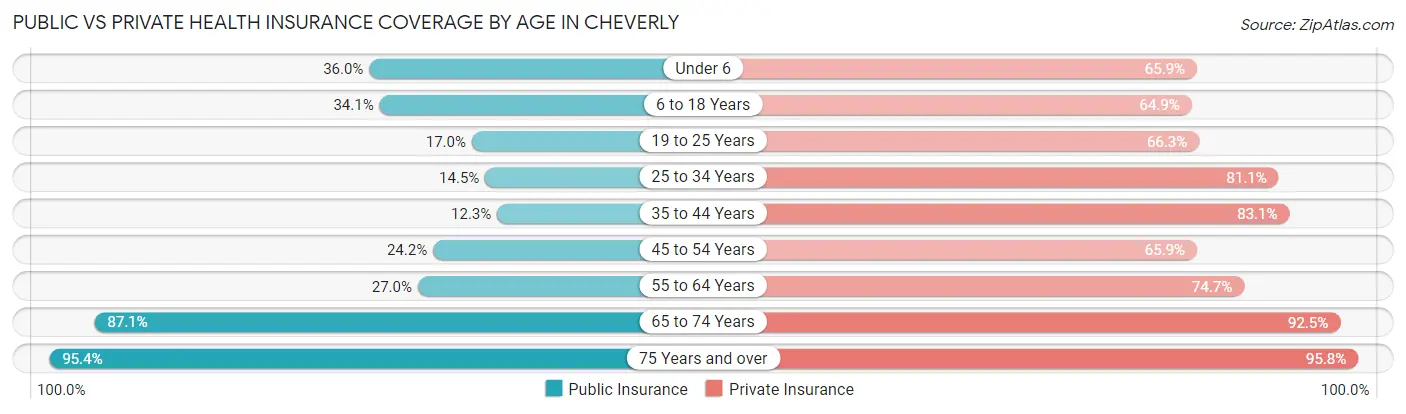
| Age Bracket | Public Insurance | Private Insurance |
| Under 6 | 222 (36.0%) | 406 (65.9%) |
| 6 to 18 Years | 256 (34.1%) | 487 (64.9%) |
| 19 to 25 Years | 62 (17.0%) | 242 (66.3%) |
| 25 to 34 Years | 92 (14.5%) | 514 (81.1%) |
| 35 to 44 Years | 119 (12.3%) | 804 (83.1%) |
| 45 to 54 Years | 181 (24.2%) | 493 (65.9%) |
| 55 to 64 Years | 224 (27.0%) | 619 (74.7%) |
| 65 to 74 Years | 625 (87.1%) | 664 (92.5%) |
| 75 Years and over | 479 (95.4%) | 481 (95.8%) |
| Total | 2,260 (36.9%) | 4,710 (76.8%) |
Disability Status by Sex by Age in Cheverly
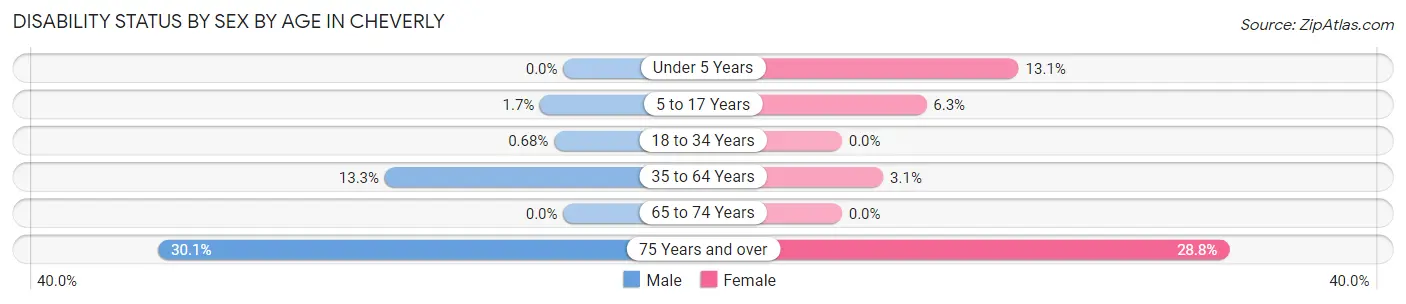
| Age Bracket | Male | Female |
| Under 5 Years | 0 (0.0%) | 34 (13.1%) |
| 5 to 17 Years | 6 (1.7%) | 31 (6.3%) |
| 18 to 34 Years | 3 (0.7%) | 0 (0.0%) |
| 35 to 64 Years | 182 (13.3%) | 36 (3.1%) |
| 65 to 74 Years | 0 (0.0%) | 0 (0.0%) |
| 75 Years and over | 37 (30.1%) | 109 (28.8%) |
Disability Class by Sex by Age in Cheverly
Disability Class: Hearing Difficulty
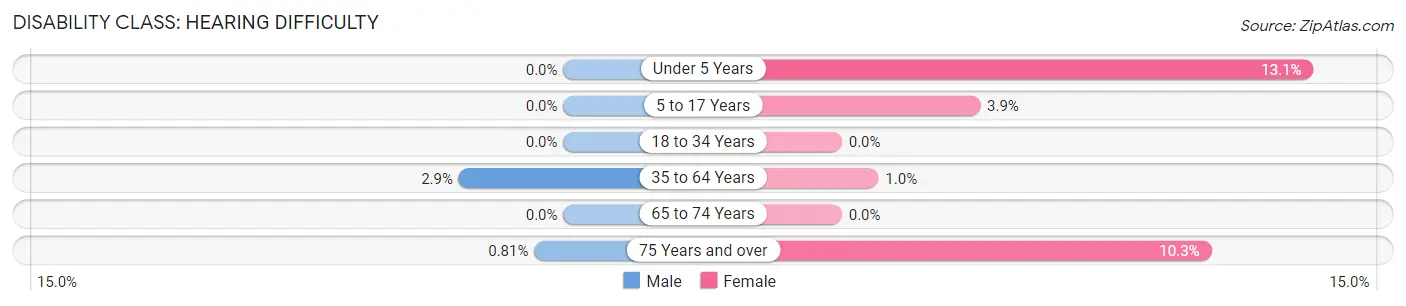
| Age Bracket | Male | Female |
| Under 5 Years | 0 (0.0%) | 34 (13.1%) |
| 5 to 17 Years | 0 (0.0%) | 19 (3.8%) |
| 18 to 34 Years | 0 (0.0%) | 0 (0.0%) |
| 35 to 64 Years | 40 (2.9%) | 12 (1.0%) |
| 65 to 74 Years | 0 (0.0%) | 0 (0.0%) |
| 75 Years and over | 1 (0.8%) | 39 (10.3%) |
Disability Class: Vision Difficulty
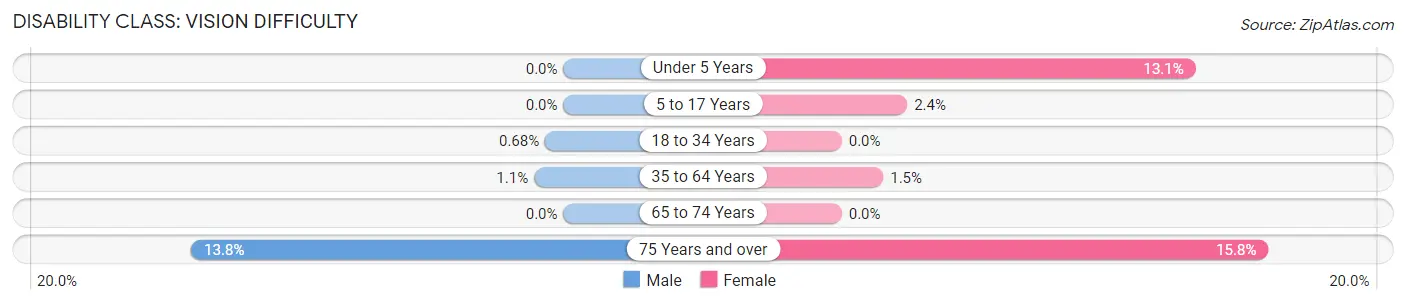
| Age Bracket | Male | Female |
| Under 5 Years | 0 (0.0%) | 34 (13.1%) |
| 5 to 17 Years | 0 (0.0%) | 12 (2.4%) |
| 18 to 34 Years | 3 (0.7%) | 0 (0.0%) |
| 35 to 64 Years | 15 (1.1%) | 18 (1.5%) |
| 65 to 74 Years | 0 (0.0%) | 0 (0.0%) |
| 75 Years and over | 17 (13.8%) | 60 (15.8%) |
Disability Class: Cognitive Difficulty
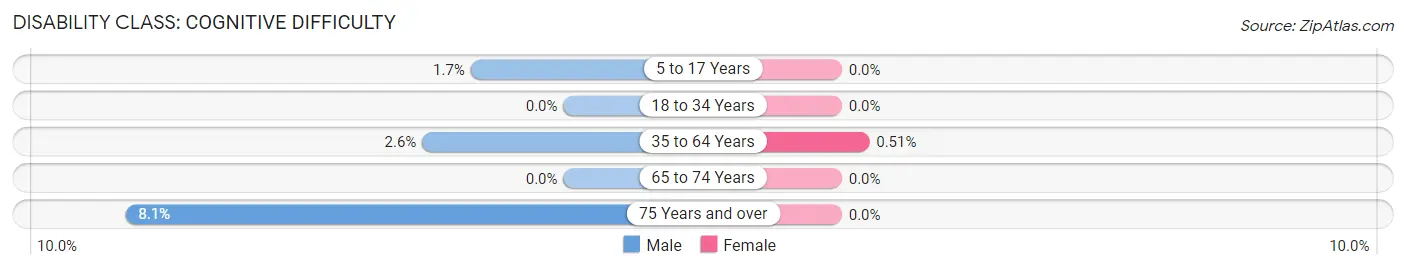
| Age Bracket | Male | Female |
| 5 to 17 Years | 6 (1.7%) | 0 (0.0%) |
| 18 to 34 Years | 0 (0.0%) | 0 (0.0%) |
| 35 to 64 Years | 36 (2.6%) | 6 (0.5%) |
| 65 to 74 Years | 0 (0.0%) | 0 (0.0%) |
| 75 Years and over | 10 (8.1%) | 0 (0.0%) |
Disability Class: Ambulatory Difficulty
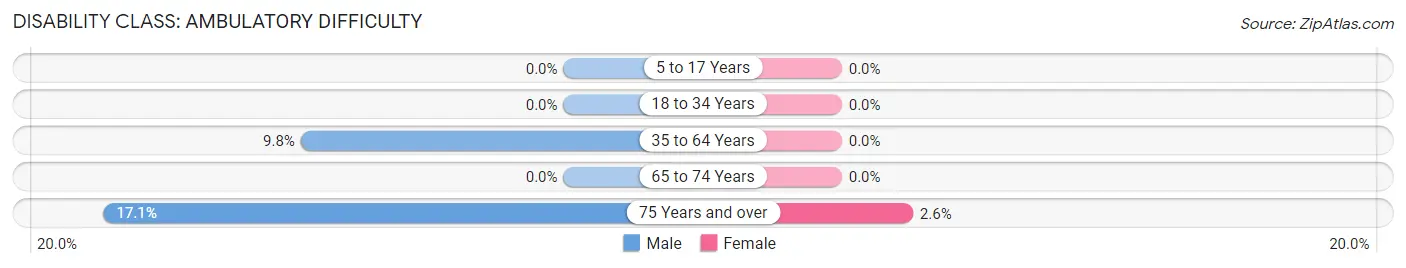
| Age Bracket | Male | Female |
| 5 to 17 Years | 0 (0.0%) | 0 (0.0%) |
| 18 to 34 Years | 0 (0.0%) | 0 (0.0%) |
| 35 to 64 Years | 134 (9.8%) | 0 (0.0%) |
| 65 to 74 Years | 0 (0.0%) | 0 (0.0%) |
| 75 Years and over | 21 (17.1%) | 10 (2.6%) |
Disability Class: Self-Care Difficulty
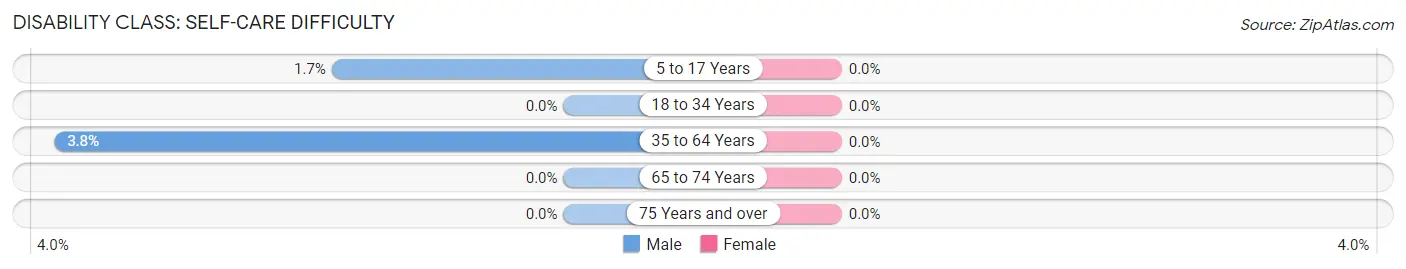
| Age Bracket | Male | Female |
| 5 to 17 Years | 6 (1.7%) | 0 (0.0%) |
| 18 to 34 Years | 0 (0.0%) | 0 (0.0%) |
| 35 to 64 Years | 52 (3.8%) | 0 (0.0%) |
| 65 to 74 Years | 0 (0.0%) | 0 (0.0%) |
| 75 Years and over | 0 (0.0%) | 0 (0.0%) |
Technology Access in Cheverly
Computing Device Access in Cheverly
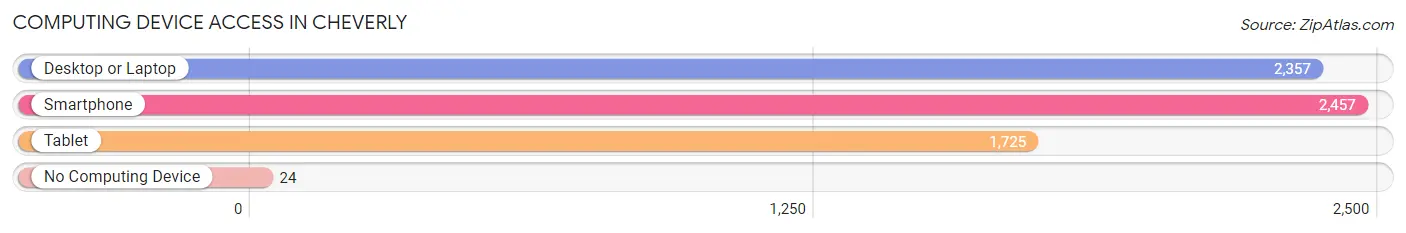
| Device Type | # Households | % Households |
| Desktop or Laptop | 2,357 | 92.2% |
| Smartphone | 2,457 | 96.1% |
| Tablet | 1,725 | 67.5% |
| No Computing Device | 24 | 0.9% |
| Total | 2,557 | 100.0% |
Internet Access in Cheverly
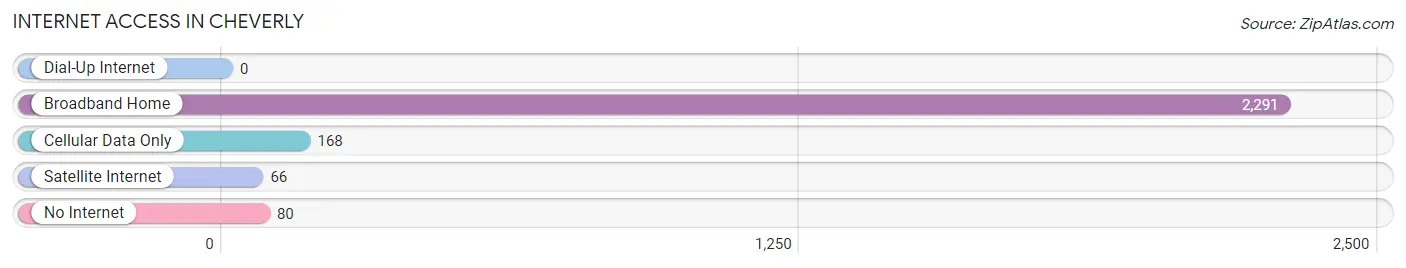
| Internet Type | # Households | % Households |
| Dial-Up Internet | 0 | 0.0% |
| Broadband Home | 2,291 | 89.6% |
| Cellular Data Only | 168 | 6.6% |
| Satellite Internet | 66 | 2.6% |
| No Internet | 80 | 3.1% |
| Total | 2,557 | 100.0% |
Cheverly Summary
Cheverly, Maryland is a small town located in Prince George’s County, Maryland, just outside of Washington, D.C. It is a suburb of the nation’s capital and is home to a population of 6,173 people as of the 2010 census. Cheverly is a diverse community with a rich history and a vibrant economy.
History
Cheverly was founded in 1918 by the Cheverly Land Company, which was owned by the Washington Suburban Sanitary Commission. The company purchased the land from the estate of William H. Chew, a prominent Washington, D.C. lawyer. The town was named after Chew and was designed to be a residential community for government workers.
The town was officially incorporated in 1931 and was the first town in Prince George’s County to be incorporated. In the 1940s, the town experienced a population boom as many African Americans moved to the area to take advantage of the new job opportunities in the federal government.
Geography
Cheverly is located in Prince George’s County, Maryland, just outside of Washington, D.C. It is bordered by the towns of Bladensburg, Landover, and New Carrollton. The town is situated on a plateau and is surrounded by rolling hills. The town is located in the Piedmont region of Maryland and is part of the Atlantic Coastal Plain.
The town is located in the humid subtropical climate zone and experiences hot, humid summers and mild winters. The average annual temperature is around 60 degrees Fahrenheit and the average annual precipitation is around 40 inches.
Economy
Cheverly’s economy is largely based on the federal government and the service industry. The town is home to several federal government agencies, including the National Institutes of Health, the National Security Agency, and the Department of Homeland Security.
The town is also home to several large employers, including the University of Maryland Medical Center, the University of Maryland College Park, and the Washington Suburban Sanitary Commission. The town is also home to several small businesses, including restaurants, retail stores, and professional services.
Demographics
As of the 2010 census, Cheverly had a population of 6,173 people. The population is racially diverse, with African Americans making up the largest racial group at 44.3%, followed by Whites at 37.2%, Hispanics at 8.3%, and Asians at 5.2%.
The median household income in Cheverly is $68,945, which is higher than the national average. The median home value is $310,000, which is also higher than the national average. The town has a high rate of homeownership, with 73.3% of the population owning their own homes.
Cheverly is a diverse and vibrant community with a rich history and a strong economy. The town is home to a variety of businesses and government agencies, and is a great place to live and work.
Common Questions
What is Per Capita Income in Cheverly?
Per Capita income in Cheverly is $58,109.
What is the Median Family Income in Cheverly?
Median Family Income in Cheverly is $149,814.
What is the Median Household income in Cheverly?
Median Household Income in Cheverly is $119,625.
What is Income or Wage Gap in Cheverly?
Income or Wage Gap in Cheverly is 32.5%.
Women in Cheverly earn 67.5 cents for every dollar earned by a man.
What is Inequality or Gini Index in Cheverly?
Inequality or Gini Index in Cheverly is 0.35.
What is the Total Population of Cheverly?
Total Population of Cheverly is 6,132.
What is the Total Male Population of Cheverly?
Total Male Population of Cheverly is 2,911.
What is the Total Female Population of Cheverly?
Total Female Population of Cheverly is 3,221.
What is the Ratio of Males per 100 Females in Cheverly?
There are 90.38 Males per 100 Females in Cheverly.
What is the Ratio of Females per 100 Males in Cheverly?
There are 110.65 Females per 100 Males in Cheverly.
What is the Median Population Age in Cheverly?
Median Population Age in Cheverly is 42.0 Years.
What is the Average Family Size in Cheverly
Average Family Size in Cheverly is 3.4 People.
What is the Average Household Size in Cheverly
Average Household Size in Cheverly is 2.4 People.
How Large is the Labor Force in Cheverly?
There are 3,572 People in the Labor Forcein in Cheverly.
What is the Percentage of People in the Labor Force in Cheverly?
72.8% of People are in the Labor Force in Cheverly.
What is the Unemployment Rate in Cheverly?
Unemployment Rate in Cheverly is 6.4%.