Cities with the Largest Lebanese Community in the United States
RELATED REPORTS & OPTIONS
Lebanese
United States
Compare Cities
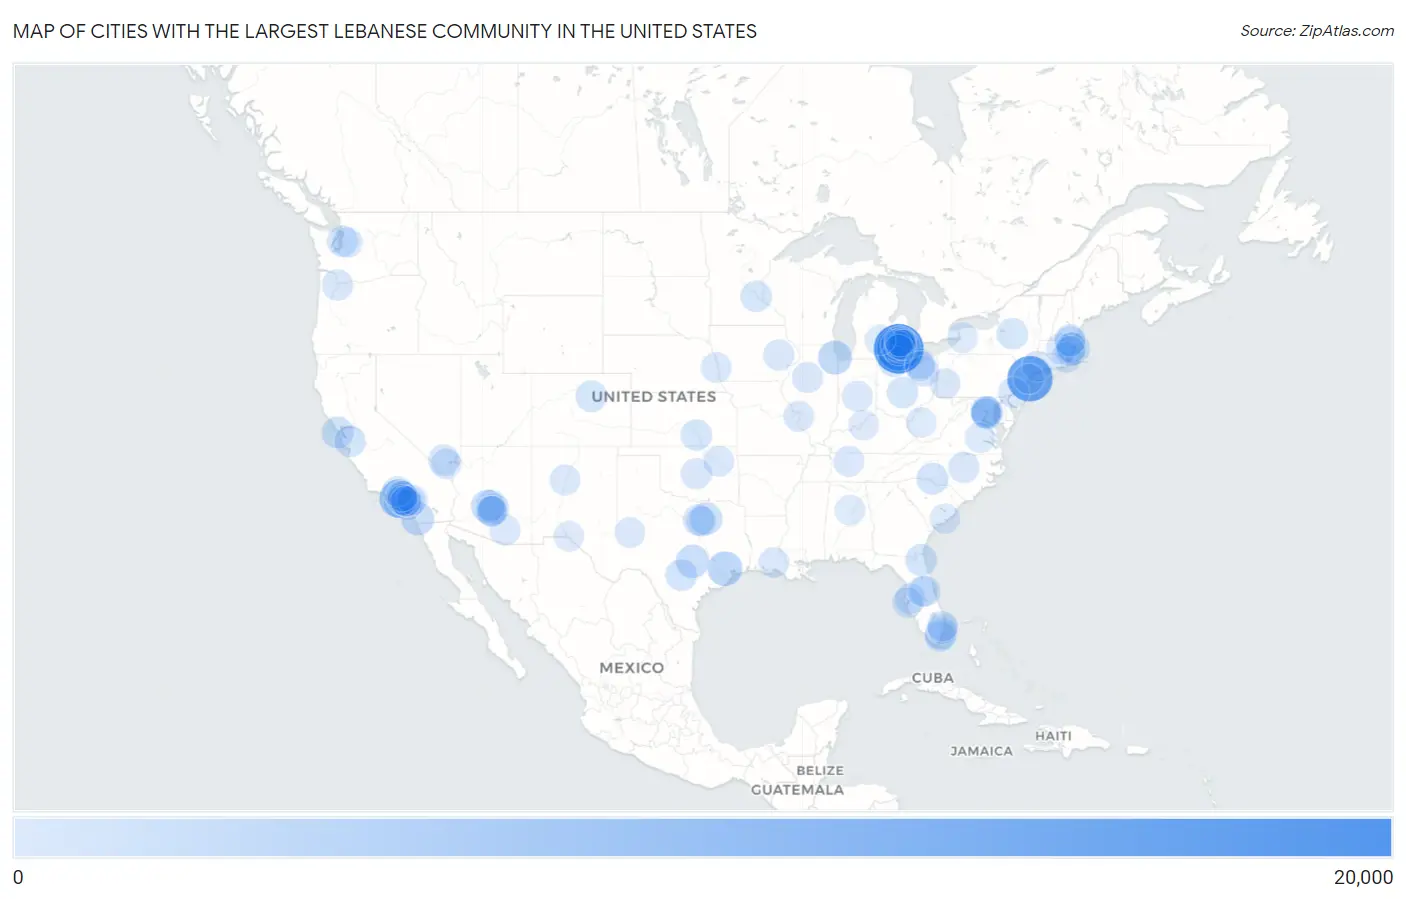
Map of Cities with the Largest Lebanese Community in the United States
0
20,000
Cities with the Largest Lebanese Community in the United States
| City | Lebanese | vs State | vs National | |
| 1. | Dearborn | 18,656 | 69,798(26.73%)#1 | 546,795(3.41%)#1 |
| 2. | New York | 14,594 | 36,152(40.37%)#1 | 546,795(2.67%)#2 |
| 3. | Dearborn Heights | 13,155 | 69,798(18.85%)#2 | 546,795(2.41%)#3 |
| 4. | Los Angeles | 7,986 | 63,675(12.54%)#1 | 546,795(1.46%)#4 |
| 5. | Houston | 4,393 | 36,524(12.03%)#1 | 546,795(0.80%)#5 |
| 6. | Chicago | 3,729 | 12,364(30.16%)#1 | 546,795(0.68%)#6 |
| 7. | Austin | 3,096 | 36,524(8.48%)#2 | 546,795(0.57%)#7 |
| 8. | San Diego | 3,064 | 63,675(4.81%)#2 | 546,795(0.56%)#8 |
| 9. | Phoenix | 2,741 | 9,970(27.49%)#1 | 546,795(0.50%)#9 |
| 10. | Dallas | 2,272 | 36,524(6.22%)#3 | 546,795(0.42%)#10 |
| 11. | Boston | 2,197 | 30,833(7.13%)#1 | 546,795(0.40%)#11 |
| 12. | San Francisco | 1,951 | 63,675(3.06%)#3 | 546,795(0.36%)#12 |
| 13. | Washington | 1,934 | 1,934(100.00%)#1 | 546,795(0.35%)#13 |
| 14. | Miami | 1,898 | 43,481(4.37%)#1 | 546,795(0.35%)#14 |
| 15. | Jacksonville | 1,847 | 43,481(4.25%)#2 | 546,795(0.34%)#15 |
| 16. | Charlotte | 1,795 | 13,288(13.51%)#1 | 546,795(0.33%)#16 |
| 17. | San Antonio | 1,737 | 36,524(4.76%)#4 | 546,795(0.32%)#17 |
| 18. | Livonia | 1,697 | 69,798(2.43%)#3 | 546,795(0.31%)#18 |
| 19. | Denver | 1,603 | 7,416(21.62%)#1 | 546,795(0.29%)#19 |
| 20. | Sterling Heights | 1,588 | 69,798(2.28%)#4 | 546,795(0.29%)#20 |
| 21. | San Jose | 1,522 | 63,675(2.39%)#4 | 546,795(0.28%)#21 |
| 22. | Toledo | 1,470 | 27,726(5.30%)#1 | 546,795(0.27%)#22 |
| 23. | Minneapolis | 1,448 | 8,040(18.01%)#1 | 546,795(0.26%)#23 |
| 24. | Fort Worth | 1,442 | 36,524(3.95%)#5 | 546,795(0.26%)#24 |
| 25. | Columbus | 1,420 | 27,726(5.12%)#2 | 546,795(0.26%)#25 |
| 26. | Seattle | 1,358 | 8,774(15.48%)#1 | 546,795(0.25%)#26 |
| 27. | Wichita | 1,339 | 3,396(39.43%)#1 | 546,795(0.24%)#27 |
| 28. | Methuen Town | 1,332 | 30,833(4.32%)#2 | 546,795(0.24%)#28 |
| 29. | Utica | 1,320 | 36,152(3.65%)#2 | 546,795(0.24%)#29 |
| 30. | Las Vegas | 1,285 | 4,377(29.36%)#1 | 546,795(0.24%)#30 |
| 31. | Raleigh | 1,266 | 13,288(9.53%)#2 | 546,795(0.23%)#31 |
| 32. | Portland | 1,214 | 5,016(24.20%)#1 | 546,795(0.22%)#32 |
| 33. | Orlando | 1,213 | 43,481(2.79%)#3 | 546,795(0.22%)#33 |
| 34. | Oklahoma City | 1,202 | 4,748(25.32%)#1 | 546,795(0.22%)#34 |
| 35. | Farmington Hills | 1,161 | 69,798(1.66%)#5 | 546,795(0.21%)#35 |
| 36. | Cedar Rapids | 1,090 | 3,394(32.12%)#1 | 546,795(0.20%)#36 |
| 37. | Peoria | 1,090 | 12,364(8.82%)#2 | 546,795(0.20%)#37 |
| 38. | Bell | 1,084 | 63,675(1.70%)#5 | 546,795(0.20%)#38 |
| 39. | Detroit | 1,075 | 69,798(1.54%)#6 | 546,795(0.20%)#39 |
| 40. | Philadelphia | 1,048 | 22,723(4.61%)#1 | 546,795(0.19%)#40 |
| 41. | Tucson | 983 | 9,970(9.86%)#2 | 546,795(0.18%)#41 |
| 42. | Cleveland | 969 | 27,726(3.49%)#3 | 546,795(0.18%)#42 |
| 43. | Indianapolis | 959 | 5,423(17.68%)#1 | 546,795(0.18%)#43 |
| 44. | Tampa | 957 | 43,481(2.20%)#4 | 546,795(0.18%)#44 |
| 45. | Troy | 957 | 69,798(1.37%)#7 | 546,795(0.18%)#45 |
| 46. | Irvine | 950 | 63,675(1.49%)#6 | 546,795(0.17%)#46 |
| 47. | Arlington | 927 | 17,815(5.20%)#1 | 546,795(0.17%)#47 |
| 48. | Scottsdale | 915 | 9,970(9.18%)#3 | 546,795(0.17%)#48 |
| 49. | St Louis | 911 | 5,940(15.34%)#1 | 546,795(0.17%)#49 |
| 50. | Albuquerque | 881 | 2,412(36.53%)#1 | 546,795(0.16%)#50 |
| 51. | Kendall | 876 | 43,481(2.01%)#5 | 546,795(0.16%)#51 |
| 52. | Worcester | 875 | 30,833(2.84%)#3 | 546,795(0.16%)#52 |
| 53. | Torrance | 870 | 63,675(1.37%)#7 | 546,795(0.16%)#53 |
| 54. | Nashville | 868 | 6,780(12.80%)#1 | 546,795(0.16%)#54 |
| 55. | Danbury | 864 | 9,225(9.37%)#1 | 546,795(0.16%)#55 |
| 56. | Mesa | 847 | 9,970(8.50%)#4 | 546,795(0.15%)#56 |
| 57. | Tulsa | 836 | 4,748(17.61%)#2 | 546,795(0.15%)#57 |
| 58. | Providence | 833 | 3,564(23.37%)#1 | 546,795(0.15%)#58 |
| 59. | Akron | 831 | 27,726(3.00%)#4 | 546,795(0.15%)#59 |
| 60. | Anaheim | 819 | 63,675(1.29%)#8 | 546,795(0.15%)#60 |
| 61. | Gilbert | 819 | 9,970(8.21%)#5 | 546,795(0.15%)#61 |
| 62. | Glendale | 813 | 63,675(1.28%)#9 | 546,795(0.15%)#62 |
| 63. | St Clair Shores | 807 | 69,798(1.16%)#8 | 546,795(0.15%)#63 |
| 64. | Warren | 803 | 69,798(1.15%)#9 | 546,795(0.15%)#64 |
| 65. | Taylor | 779 | 69,798(1.12%)#10 | 546,795(0.14%)#65 |
| 66. | Bethesda | 778 | 7,429(10.47%)#1 | 546,795(0.14%)#66 |
| 67. | Omaha | 766 | 1,892(40.49%)#1 | 546,795(0.14%)#67 |
| 68. | Pittsburgh | 761 | 22,723(3.35%)#2 | 546,795(0.14%)#68 |
| 69. | St Petersburg | 745 | 43,481(1.71%)#6 | 546,795(0.14%)#69 |
| 70. | Henderson | 738 | 4,377(16.86%)#2 | 546,795(0.13%)#70 |
| 71. | Lafayette | 738 | 6,161(11.98%)#1 | 546,795(0.13%)#71 |
| 72. | Midland | 733 | 36,524(2.01%)#6 | 546,795(0.13%)#72 |
| 73. | Chandler | 730 | 9,970(7.32%)#6 | 546,795(0.13%)#73 |
| 74. | Corona | 693 | 63,675(1.09%)#10 | 546,795(0.13%)#74 |
| 75. | Lawrence | 672 | 30,833(2.18%)#4 | 546,795(0.12%)#75 |
| 76. | Fort Lauderdale | 667 | 43,481(1.53%)#7 | 546,795(0.12%)#76 |
| 77. | Fullerton | 667 | 63,675(1.05%)#11 | 546,795(0.12%)#77 |
| 78. | Louisville | 659 | 3,462(19.04%)#1 | 546,795(0.12%)#78 |
| 79. | Santa Clarita | 654 | 63,675(1.03%)#12 | 546,795(0.12%)#79 |
| 80. | Riverside | 651 | 63,675(1.02%)#13 | 546,795(0.12%)#80 |
| 81. | Lansing | 642 | 69,798(0.92%)#11 | 546,795(0.12%)#81 |
| 82. | Alexandria | 641 | 17,815(3.60%)#2 | 546,795(0.12%)#82 |
| 83. | Deerfield Beach | 641 | 43,481(1.47%)#8 | 546,795(0.12%)#83 |
| 84. | Placentia | 637 | 63,675(1.00%)#14 | 546,795(0.12%)#84 |
| 85. | Parma | 634 | 27,726(2.29%)#5 | 546,795(0.12%)#85 |
| 86. | Rochester Hills | 632 | 69,798(0.91%)#12 | 546,795(0.12%)#86 |
| 87. | Jersey City | 612 | 13,568(4.51%)#1 | 546,795(0.11%)#87 |
| 88. | Chelsea | 607 | 5,199(11.68%)#1 | 546,795(0.11%)#88 |
| 89. | Cambridge | 604 | 30,833(1.96%)#5 | 546,795(0.11%)#89 |
| 90. | Richmond | 602 | 17,815(3.38%)#3 | 546,795(0.11%)#90 |
| 91. | Horizon West | 582 | 43,481(1.34%)#9 | 546,795(0.11%)#91 |
| 92. | Cheektowaga | 575 | 36,152(1.59%)#3 | 546,795(0.11%)#92 |
| 93. | El Paso | 566 | 36,524(1.55%)#7 | 546,795(0.10%)#93 |
| 94. | Sammamish | 564 | 8,774(6.43%)#2 | 546,795(0.10%)#94 |
| 95. | Pasadena | 562 | 63,675(0.88%)#15 | 546,795(0.10%)#95 |
| 96. | Arlington | 558 | 36,524(1.53%)#8 | 546,795(0.10%)#96 |
| 97. | Charleston | 557 | 3,004(18.54%)#1 | 546,795(0.10%)#97 |
| 98. | Charleston | 556 | 6,008(9.25%)#1 | 546,795(0.10%)#98 |
| 99. | Norwood | 551 | 30,833(1.79%)#6 | 546,795(0.10%)#99 |
| 100. | Downey | 550 | 63,675(0.86%)#16 | 546,795(0.10%)#100 |
Common Questions
What are the Top 10 Cities with the Largest Lebanese Community in the United States?
Top 10 Cities with the Largest Lebanese Community in the United States are:
What city has the Largest Lebanese Community in the United States?
Dearborn has the Largest Lebanese Community in the United States with 18,656.
What is the Total Lebanese Population in the United States?
Total Lebanese Population in the United States is 546,795.