Cities with the Largest Nepalese Community in the United States
RELATED REPORTS & OPTIONS
Nepalese
United States
Compare Cities
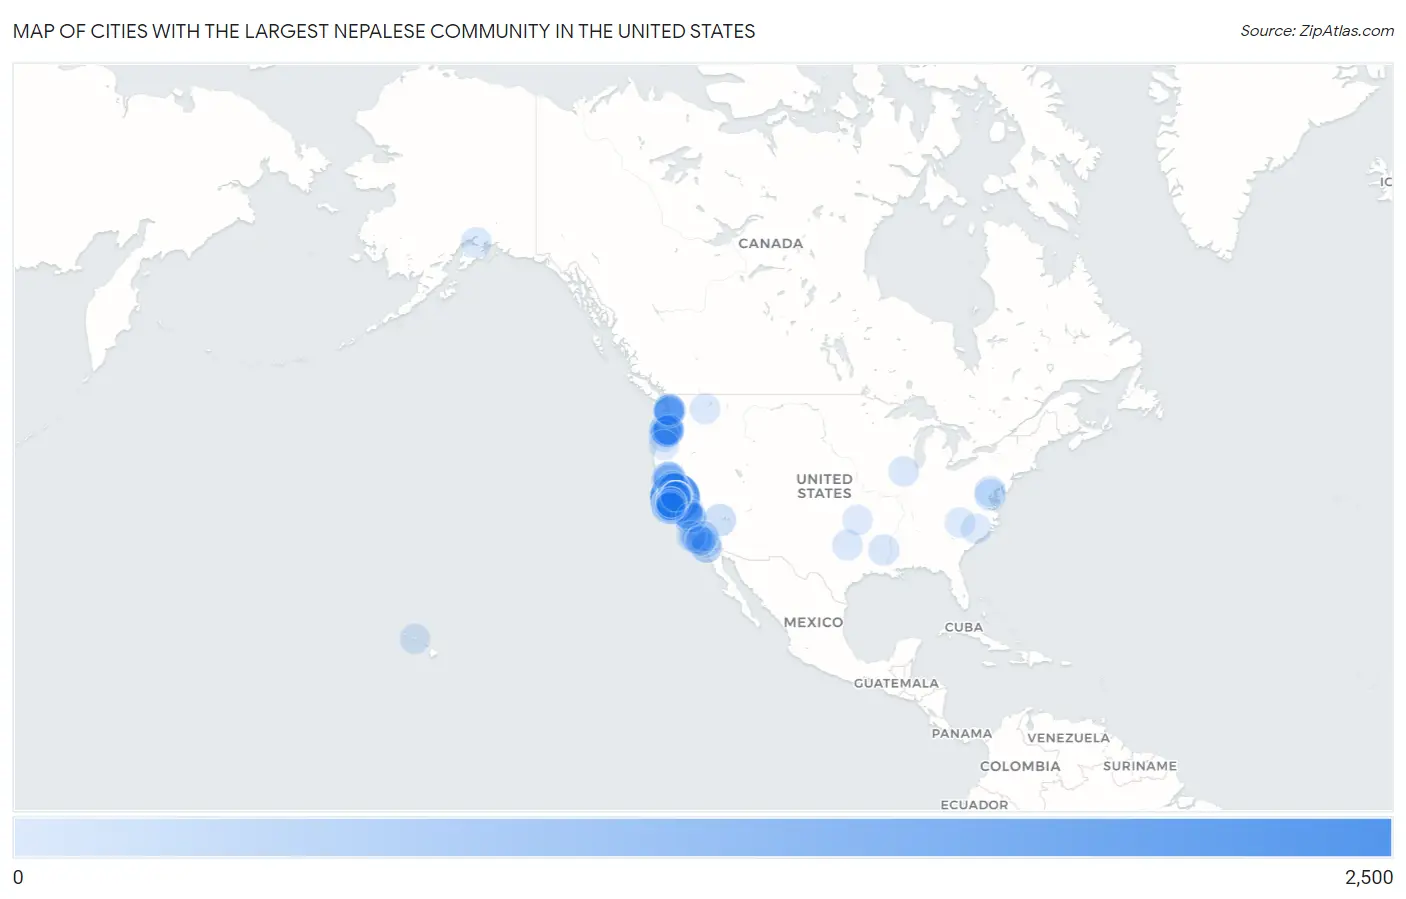
Map of Cities with the Largest Nepalese Community in the United States
0
2,500
Cities with the Largest Nepalese Community in the United States
| City | Nepalese | vs State | vs National | |
| 1. | Sacramento | 2,223 | 10,704(20.77%)#1 | 13,631(16.31%)#1 |
| 2. | Oakland | 897 | 10,704(8.38%)#2 | 13,631(6.58%)#2 |
| 3. | Merced | 489 | 10,704(4.57%)#3 | 13,631(3.59%)#3 |
| 4. | Redding | 481 | 10,704(4.49%)#4 | 13,631(3.53%)#4 |
| 5. | Portland | 415 | 1,079(38.46%)#1 | 13,631(3.04%)#5 |
| 6. | Roseville | 410 | 10,704(3.83%)#5 | 13,631(3.01%)#6 |
| 7. | Elk Grove | 404 | 10,704(3.77%)#6 | 13,631(2.96%)#7 |
| 8. | Vineyard | 400 | 10,704(3.74%)#7 | 13,631(2.93%)#8 |
| 9. | Rancho Cordova | 369 | 10,704(3.45%)#8 | 13,631(2.71%)#9 |
| 10. | Visalia | 356 | 10,704(3.33%)#9 | 13,631(2.61%)#10 |
| 11. | Florin | 332 | 10,704(3.10%)#10 | 13,631(2.44%)#11 |
| 12. | San Pablo | 299 | 10,704(2.79%)#11 | 13,631(2.19%)#12 |
| 13. | Lemon Hill | 264 | 10,704(2.47%)#12 | 13,631(1.94%)#13 |
| 14. | Henderson | 217 | 217(100.00%)#1 | 13,631(1.59%)#14 |
| 15. | Hazel Dell | 214 | 952(22.48%)#1 | 13,631(1.57%)#15 |
| 16. | Gresham | 208 | 1,079(19.28%)#2 | 13,631(1.53%)#16 |
| 17. | Richmond | 182 | 10,704(1.70%)#13 | 13,631(1.34%)#17 |
| 18. | Renton | 156 | 952(16.39%)#2 | 13,631(1.14%)#18 |
| 19. | Fairfield | 143 | 10,704(1.34%)#14 | 13,631(1.05%)#19 |
| 20. | Stockton | 142 | 10,704(1.33%)#15 | 13,631(1.04%)#20 |
| 21. | Arden Arcade | 142 | 10,704(1.33%)#16 | 13,631(1.04%)#21 |
| 22. | Oroville | 134 | 10,704(1.25%)#17 | 13,631(0.98%)#22 |
| 23. | Bella Vista | 134 | 10,704(1.25%)#18 | 13,631(0.98%)#23 |
| 24. | Troutdale | 126 | 1,079(11.68%)#3 | 13,631(0.92%)#24 |
| 25. | Los Angeles | 121 | 10,704(1.13%)#19 | 13,631(0.89%)#25 |
| 26. | Ceres | 121 | 10,704(1.13%)#20 | 13,631(0.89%)#26 |
| 27. | Arlington | 110 | 110(100.00%)#1 | 13,631(0.81%)#27 |
| 28. | South Oroville | 107 | 10,704(1.00%)#21 | 13,631(0.78%)#28 |
| 29. | Shasta Lake | 98 | 10,704(0.92%)#22 | 13,631(0.72%)#29 |
| 30. | Anderson | 97 | 10,704(0.91%)#23 | 13,631(0.71%)#30 |
| 31. | Thermalito | 95 | 10,704(0.89%)#24 | 13,631(0.70%)#31 |
| 32. | Burien | 93 | 952(9.77%)#3 | 13,631(0.68%)#32 |
| 33. | Seattle | 92 | 952(9.66%)#4 | 13,631(0.67%)#33 |
| 34. | Hillsboro | 91 | 1,079(8.43%)#4 | 13,631(0.67%)#34 |
| 35. | Bryn Mawr Skyway | 88 | 952(9.24%)#5 | 13,631(0.65%)#35 |
| 36. | Monroe | 83 | 83(100.00%)#1 | 13,631(0.61%)#36 |
| 37. | Fremont | 82 | 10,704(0.77%)#25 | 13,631(0.60%)#37 |
| 38. | San Diego | 81 | 10,704(0.76%)#26 | 13,631(0.59%)#38 |
| 39. | Franklin Cdp Merced County | 78 | 10,704(0.73%)#27 | 13,631(0.57%)#39 |
| 40. | Vallejo | 77 | 10,704(0.72%)#28 | 13,631(0.56%)#40 |
| 41. | Tulare | 77 | 10,704(0.72%)#29 | 13,631(0.56%)#41 |
| 42. | North Highlands | 75 | 10,704(0.70%)#30 | 13,631(0.55%)#42 |
| 43. | Suisun City | 75 | 10,704(0.70%)#31 | 13,631(0.55%)#43 |
| 44. | Fairwood Cdp King County | 74 | 952(7.77%)#6 | 13,631(0.54%)#44 |
| 45. | Parkway | 73 | 10,704(0.68%)#32 | 13,631(0.54%)#45 |
| 46. | Happy Valley | 71 | 1,079(6.58%)#5 | 13,631(0.52%)#46 |
| 47. | Rancho Cucamonga | 70 | 10,704(0.65%)#33 | 13,631(0.51%)#47 |
| 48. | Simi Valley | 68 | 10,704(0.64%)#34 | 13,631(0.50%)#48 |
| 49. | Fresno | 66 | 10,704(0.62%)#35 | 13,631(0.48%)#49 |
| 50. | West Sacramento | 65 | 10,704(0.61%)#36 | 13,631(0.48%)#50 |
| 51. | Orchards | 64 | 952(6.72%)#7 | 13,631(0.47%)#51 |
| 52. | Coarsegold | 64 | 10,704(0.60%)#37 | 13,631(0.47%)#52 |
| 53. | Tara Hills | 63 | 10,704(0.59%)#38 | 13,631(0.46%)#53 |
| 54. | Chico | 61 | 10,704(0.57%)#39 | 13,631(0.45%)#54 |
| 55. | La Mesa | 58 | 10,704(0.54%)#40 | 13,631(0.43%)#55 |
| 56. | Damascus | 56 | 56(100.00%)#1 | 13,631(0.41%)#56 |
| 57. | Pacifica | 55 | 10,704(0.51%)#41 | 13,631(0.40%)#57 |
| 58. | Manteca | 54 | 10,704(0.50%)#42 | 13,631(0.40%)#58 |
| 59. | Milwaukie | 49 | 1,079(4.54%)#6 | 13,631(0.36%)#59 |
| 60. | San Lorenzo | 48 | 10,704(0.45%)#43 | 13,631(0.35%)#60 |
| 61. | Clovis | 47 | 10,704(0.44%)#44 | 13,631(0.34%)#61 |
| 62. | Spokane Valley | 47 | 952(4.94%)#8 | 13,631(0.34%)#62 |
| 63. | West Carson | 47 | 10,704(0.44%)#45 | 13,631(0.34%)#63 |
| 64. | Northlake | 47 | 60(78.33%)#1 | 13,631(0.34%)#64 |
| 65. | Antelope | 46 | 10,704(0.43%)#46 | 13,631(0.34%)#65 |
| 66. | Anchorage | 45 | 45(100.00%)#1 | 13,631(0.33%)#66 |
| 67. | Salem | 45 | 1,079(4.17%)#7 | 13,631(0.33%)#67 |
| 68. | Kent | 45 | 952(4.73%)#9 | 13,631(0.33%)#68 |
| 69. | Pittsburg | 45 | 10,704(0.42%)#47 | 13,631(0.33%)#69 |
| 70. | Woodland | 45 | 10,704(0.42%)#48 | 13,631(0.33%)#70 |
| 71. | Lakeland North | 38 | 952(3.99%)#10 | 13,631(0.28%)#71 |
| 72. | Wood Village | 38 | 1,079(3.52%)#8 | 13,631(0.28%)#72 |
| 73. | San Jose | 37 | 10,704(0.35%)#49 | 13,631(0.27%)#73 |
| 74. | Ashland | 37 | 10,704(0.35%)#50 | 13,631(0.27%)#74 |
| 75. | Carmichael | 33 | 10,704(0.31%)#51 | 13,631(0.24%)#75 |
| 76. | Seatonville | 32 | 32(100.00%)#1 | 13,631(0.23%)#76 |
| 77. | Calwa | 31 | 10,704(0.29%)#52 | 13,631(0.23%)#77 |
| 78. | Citrus Heights | 29 | 10,704(0.27%)#53 | 13,631(0.21%)#78 |
| 79. | Temecula | 27 | 10,704(0.25%)#54 | 13,631(0.20%)#79 |
| 80. | Tukwila | 27 | 952(2.84%)#11 | 13,631(0.20%)#80 |
| 81. | Rockfish | 27 | 242(11.16%)#1 | 13,631(0.20%)#81 |
| 82. | Pleasanton | 24 | 10,704(0.22%)#55 | 13,631(0.18%)#82 |
| 83. | Foothill Farms | 24 | 10,704(0.22%)#56 | 13,631(0.18%)#83 |
| 84. | Hickory | 21 | 242(8.68%)#2 | 13,631(0.15%)#84 |
| 85. | Fontana | 20 | 10,704(0.19%)#57 | 13,631(0.15%)#85 |
| 86. | Oxnard | 20 | 10,704(0.19%)#58 | 13,631(0.15%)#86 |
| 87. | South San Francisco | 20 | 10,704(0.19%)#59 | 13,631(0.15%)#87 |
| 88. | Orangevale | 20 | 10,704(0.19%)#60 | 13,631(0.15%)#88 |
| 89. | Schofield Barracks | 20 | 20(100.00%)#1 | 13,631(0.15%)#89 |
| 90. | San Ramon | 17 | 10,704(0.16%)#61 | 13,631(0.12%)#90 |
| 91. | Elverta | 17 | 10,704(0.16%)#62 | 13,631(0.12%)#91 |
| 92. | Concord | 16 | 10,704(0.15%)#63 | 13,631(0.12%)#92 |
| 93. | Broken Arrow | 13 | 13(100.00%)#1 | 13,631(0.10%)#93 |
| 94. | Newark | 13 | 10,704(0.12%)#64 | 13,631(0.10%)#94 |
| 95. | Pleasant Hill | 13 | 10,704(0.12%)#65 | 13,631(0.10%)#95 |
| 96. | Eugene | 12 | 1,079(1.11%)#9 | 13,631(0.09%)#96 |
| 97. | Tustin | 12 | 10,704(0.11%)#66 | 13,631(0.09%)#97 |
| 98. | Exeter | 12 | 10,704(0.11%)#67 | 13,631(0.09%)#98 |
| 99. | Menlo Park | 11 | 10,704(0.10%)#68 | 13,631(0.08%)#99 |
| 100. | Newport Beach | 10 | 10,704(0.09%)#69 | 13,631(0.07%)#100 |
Common Questions
What are the Top 10 Cities with the Largest Nepalese Community in the United States?
Top 10 Cities with the Largest Nepalese Community in the United States are:
What city has the Largest Nepalese Community in the United States?
Sacramento has the Largest Nepalese Community in the United States with 2,223.
What is the Total Nepalese Population in the United States?
Total Nepalese Population in the United States is 13,631.