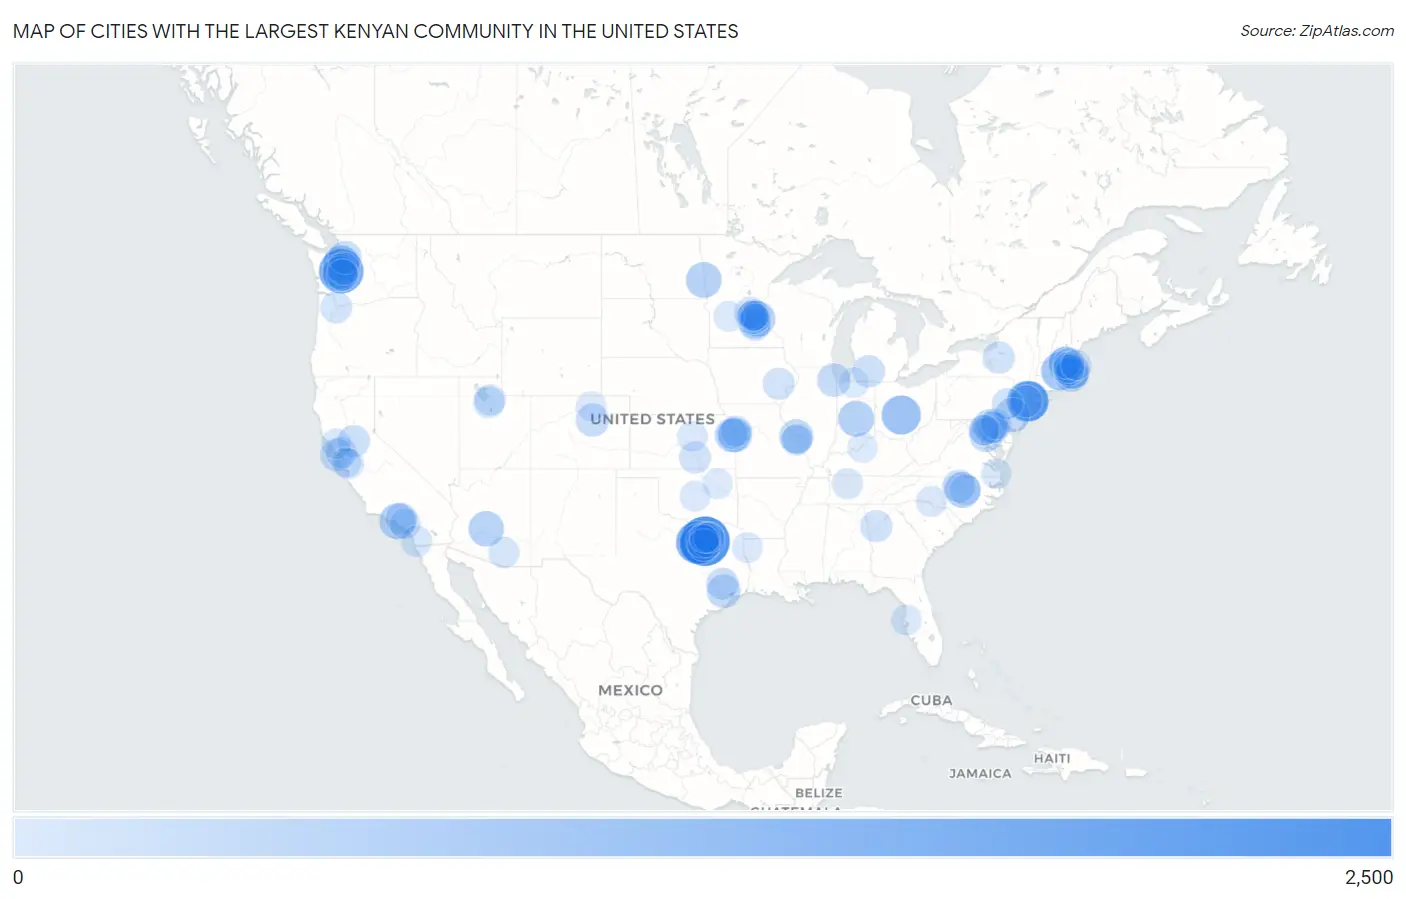
Cities with the Largest Kenyan Community in the United States
RELATED REPORTS & OPTIONS
Kenyan
United States
Compare Cities
Map of Cities with the Largest Kenyan Community in the United States
0
2,500
Cities with the Largest Kenyan Community in the United States
| City | Kenyan | vs State | vs National | |
| 1. | Dallas | 2,075 | 14,373(14.44%)#1 | 103,802(2.00%)#1 |
| 2. | Federal Way | 1,567 | 8,304(18.87%)#1 | 103,802(1.51%)#2 |
| 3. | Fort Worth | 1,419 | 14,373(9.87%)#2 | 103,802(1.37%)#3 |
| 4. | Arlington | 1,226 | 14,373(8.53%)#3 | 103,802(1.18%)#4 |
| 5. | Jersey City | 1,223 | 4,229(28.92%)#1 | 103,802(1.18%)#5 |
| 6. | New York | 1,136 | 3,201(35.49%)#1 | 103,802(1.09%)#6 |
| 7. | Columbus | 1,050 | 2,320(45.26%)#1 | 103,802(1.01%)#7 |
| 8. | Worcester | 916 | 7,043(13.01%)#1 | 103,802(0.88%)#8 |
| 9. | Seattle | 805 | 8,304(9.69%)#2 | 103,802(0.78%)#9 |
| 10. | Lowell | 766 | 7,043(10.88%)#2 | 103,802(0.74%)#10 |
| 11. | Los Angeles | 755 | 8,087(9.34%)#1 | 103,802(0.73%)#11 |
| 12. | Indianapolis | 730 | 2,462(29.65%)#1 | 103,802(0.70%)#12 |
| 13. | St Paul | 726 | 7,862(9.23%)#1 | 103,802(0.70%)#13 |
| 14. | Raleigh | 719 | 3,200(22.47%)#1 | 103,802(0.69%)#14 |
| 15. | Fargo | 716 | 847(84.53%)#1 | 103,802(0.69%)#15 |
| 16. | Phoenix | 690 | 1,548(44.57%)#1 | 103,802(0.66%)#16 |
| 17. | Tacoma | 674 | 8,304(8.12%)#3 | 103,802(0.65%)#17 |
| 18. | Parkland | 672 | 8,304(8.09%)#4 | 103,802(0.65%)#18 |
| 19. | Garland | 649 | 14,373(4.52%)#4 | 103,802(0.63%)#19 |
| 20. | Olathe | 647 | 2,574(25.14%)#1 | 103,802(0.62%)#20 |
| 21. | Philadelphia | 631 | 2,957(21.34%)#1 | 103,802(0.61%)#21 |
| 22. | Boston | 624 | 7,043(8.86%)#3 | 103,802(0.60%)#22 |
| 23. | Overland Park | 589 | 2,574(22.88%)#2 | 103,802(0.57%)#23 |
| 24. | Lochearn | 577 | 5,937(9.72%)#1 | 103,802(0.56%)#24 |
| 25. | Washington | 553 | 553(100.00%)#1 | 103,802(0.53%)#25 |
| 26. | Hazelwood | 553 | 3,136(17.63%)#1 | 103,802(0.53%)#26 |
| 27. | Houston | 538 | 14,373(3.74%)#5 | 103,802(0.52%)#27 |
| 28. | Brockton | 538 | 7,043(7.64%)#4 | 103,802(0.52%)#28 |
| 29. | Chicago | 509 | 1,475(34.51%)#1 | 103,802(0.49%)#29 |
| 30. | Aurora | 504 | 1,249(40.35%)#1 | 103,802(0.49%)#30 |
| 31. | Weymouth Town | 484 | 7,043(6.87%)#5 | 103,802(0.47%)#31 |
| 32. | Everett | 475 | 8,304(5.72%)#5 | 103,802(0.46%)#32 |
| 33. | Irving | 469 | 14,373(3.26%)#6 | 103,802(0.45%)#33 |
| 34. | Plymouth | 463 | 7,862(5.89%)#2 | 103,802(0.45%)#34 |
| 35. | St Anthony City Hennepin And Ramsey Counties | 445 | 7,862(5.66%)#3 | 103,802(0.43%)#35 |
| 36. | Durham | 443 | 3,200(13.84%)#2 | 103,802(0.43%)#36 |
| 37. | Kent | 429 | 8,304(5.17%)#6 | 103,802(0.41%)#37 |
| 38. | San Francisco | 420 | 8,087(5.19%)#2 | 103,802(0.40%)#38 |
| 39. | Conroe | 407 | 14,373(2.83%)#7 | 103,802(0.39%)#39 |
| 40. | Baltimore | 398 | 5,937(6.70%)#2 | 103,802(0.38%)#40 |
| 41. | Sacramento | 394 | 8,087(4.87%)#3 | 103,802(0.38%)#41 |
| 42. | Battle Creek | 394 | 1,271(31.00%)#1 | 103,802(0.38%)#42 |
| 43. | Newark | 389 | 4,229(9.20%)#2 | 103,802(0.37%)#43 |
| 44. | Burnsville | 386 | 7,862(4.91%)#4 | 103,802(0.37%)#44 |
| 45. | Syracuse | 380 | 3,201(11.87%)#2 | 103,802(0.37%)#45 |
| 46. | Desoto | 379 | 14,373(2.64%)#8 | 103,802(0.37%)#46 |
| 47. | Iowa City | 375 | 740(50.68%)#1 | 103,802(0.36%)#47 |
| 48. | Douglasville | 372 | 3,621(10.27%)#1 | 103,802(0.36%)#48 |
| 49. | Nashua | 371 | 701(52.92%)#1 | 103,802(0.36%)#49 |
| 50. | Altadena | 371 | 8,087(4.59%)#4 | 103,802(0.36%)#50 |
| 51. | Wichita | 361 | 2,574(14.02%)#3 | 103,802(0.35%)#51 |
| 52. | Portland | 347 | 956(36.30%)#1 | 103,802(0.33%)#52 |
| 53. | Essex | 342 | 5,937(5.76%)#3 | 103,802(0.33%)#53 |
| 54. | South Hill | 341 | 8,304(4.11%)#7 | 103,802(0.33%)#54 |
| 55. | Richmond | 338 | 8,087(4.18%)#5 | 103,802(0.33%)#55 |
| 56. | Lakeville | 331 | 7,862(4.21%)#5 | 103,802(0.32%)#56 |
| 57. | Allentown | 323 | 2,957(10.92%)#2 | 103,802(0.31%)#57 |
| 58. | Watertown Town | 317 | 7,043(4.50%)#6 | 103,802(0.31%)#58 |
| 59. | San Diego | 310 | 8,087(3.83%)#6 | 103,802(0.30%)#59 |
| 60. | West Valley City | 310 | 752(41.22%)#1 | 103,802(0.30%)#60 |
| 61. | Salt Lake City | 307 | 752(40.82%)#2 | 103,802(0.30%)#61 |
| 62. | Lawrence | 303 | 7,043(4.30%)#7 | 103,802(0.29%)#62 |
| 63. | Otsego | 302 | 7,862(3.84%)#6 | 103,802(0.29%)#63 |
| 64. | Athens-Clarke County Unified Government (Balance) | 298 | 3,621(8.23%)#2 | 103,802(0.29%)#64 |
| 65. | Tucson | 296 | 1,548(19.12%)#2 | 103,802(0.29%)#65 |
| 66. | Kansas City | 295 | 3,136(9.41%)#2 | 103,802(0.28%)#66 |
| 67. | Champlin | 295 | 7,862(3.75%)#7 | 103,802(0.28%)#67 |
| 68. | Coon Rapids | 293 | 7,862(3.73%)#8 | 103,802(0.28%)#68 |
| 69. | Nashville | 292 | 774(37.73%)#1 | 103,802(0.28%)#69 |
| 70. | Knightdale | 289 | 3,200(9.03%)#3 | 103,802(0.28%)#70 |
| 71. | Anaheim | 285 | 8,087(3.52%)#7 | 103,802(0.27%)#71 |
| 72. | Olney | 285 | 5,937(4.80%)#4 | 103,802(0.27%)#72 |
| 73. | New Brighton | 283 | 7,862(3.60%)#9 | 103,802(0.27%)#73 |
| 74. | Woodlawn Cdp Fairfax County | 282 | 3,294(8.56%)#1 | 103,802(0.27%)#74 |
| 75. | St Louis | 274 | 3,136(8.74%)#3 | 103,802(0.26%)#75 |
| 76. | Sienna | 273 | 14,373(1.90%)#9 | 103,802(0.26%)#76 |
| 77. | Woburn | 272 | 7,043(3.86%)#8 | 103,802(0.26%)#77 |
| 78. | Charlotte | 271 | 3,200(8.47%)#4 | 103,802(0.26%)#78 |
| 79. | Rock Hill | 270 | 3,136(8.61%)#4 | 103,802(0.26%)#79 |
| 80. | San Jose | 263 | 8,087(3.25%)#8 | 103,802(0.25%)#80 |
| 81. | Bel Air South | 263 | 5,937(4.43%)#5 | 103,802(0.25%)#81 |
| 82. | Westchase | 260 | 2,417(10.76%)#1 | 103,802(0.25%)#82 |
| 83. | Shreveport | 257 | 616(41.72%)#1 | 103,802(0.25%)#83 |
| 84. | Salina | 256 | 2,574(9.95%)#4 | 103,802(0.25%)#84 |
| 85. | Wylie | 251 | 14,373(1.75%)#10 | 103,802(0.24%)#85 |
| 86. | Plano | 249 | 14,373(1.73%)#11 | 103,802(0.24%)#86 |
| 87. | Willmar | 247 | 7,862(3.14%)#10 | 103,802(0.24%)#87 |
| 88. | Oklahoma City | 243 | 891(27.27%)#1 | 103,802(0.23%)#88 |
| 89. | Chesapeake | 237 | 3,294(7.19%)#2 | 103,802(0.23%)#89 |
| 90. | Santa Rosa | 237 | 8,087(2.93%)#9 | 103,802(0.23%)#90 |
| 91. | Gloucester | 233 | 7,043(3.31%)#9 | 103,802(0.22%)#91 |
| 92. | Santa Clara | 230 | 8,087(2.84%)#10 | 103,802(0.22%)#92 |
| 93. | Maple Grove | 230 | 7,862(2.93%)#11 | 103,802(0.22%)#93 |
| 94. | Redland | 230 | 5,937(3.87%)#6 | 103,802(0.22%)#94 |
| 95. | Tulsa | 226 | 891(25.36%)#2 | 103,802(0.22%)#95 |
| 96. | Louisville | 223 | 469(47.55%)#1 | 103,802(0.21%)#96 |
| 97. | Lenexa | 220 | 2,574(8.55%)#5 | 103,802(0.21%)#97 |
| 98. | Minneapolis | 217 | 7,862(2.76%)#12 | 103,802(0.21%)#98 |
| 99. | Greeley | 217 | 1,249(17.37%)#2 | 103,802(0.21%)#99 |
| 100. | South Bend | 217 | 2,462(8.81%)#2 | 103,802(0.21%)#100 |
Common Questions
What are the Top 10 Cities with the Largest Kenyan Community in the United States?
Top 10 Cities with the Largest Kenyan Community in the United States are:
What city has the Largest Kenyan Community in the United States?
Dallas has the Largest Kenyan Community in the United States with 2,075.
What is the Total Kenyan Population in the United States?
Total Kenyan Population in the United States is 103,802.