Cities with the Largest Armenian Community in the United States
RELATED REPORTS & OPTIONS
Armenian
United States
Compare Cities
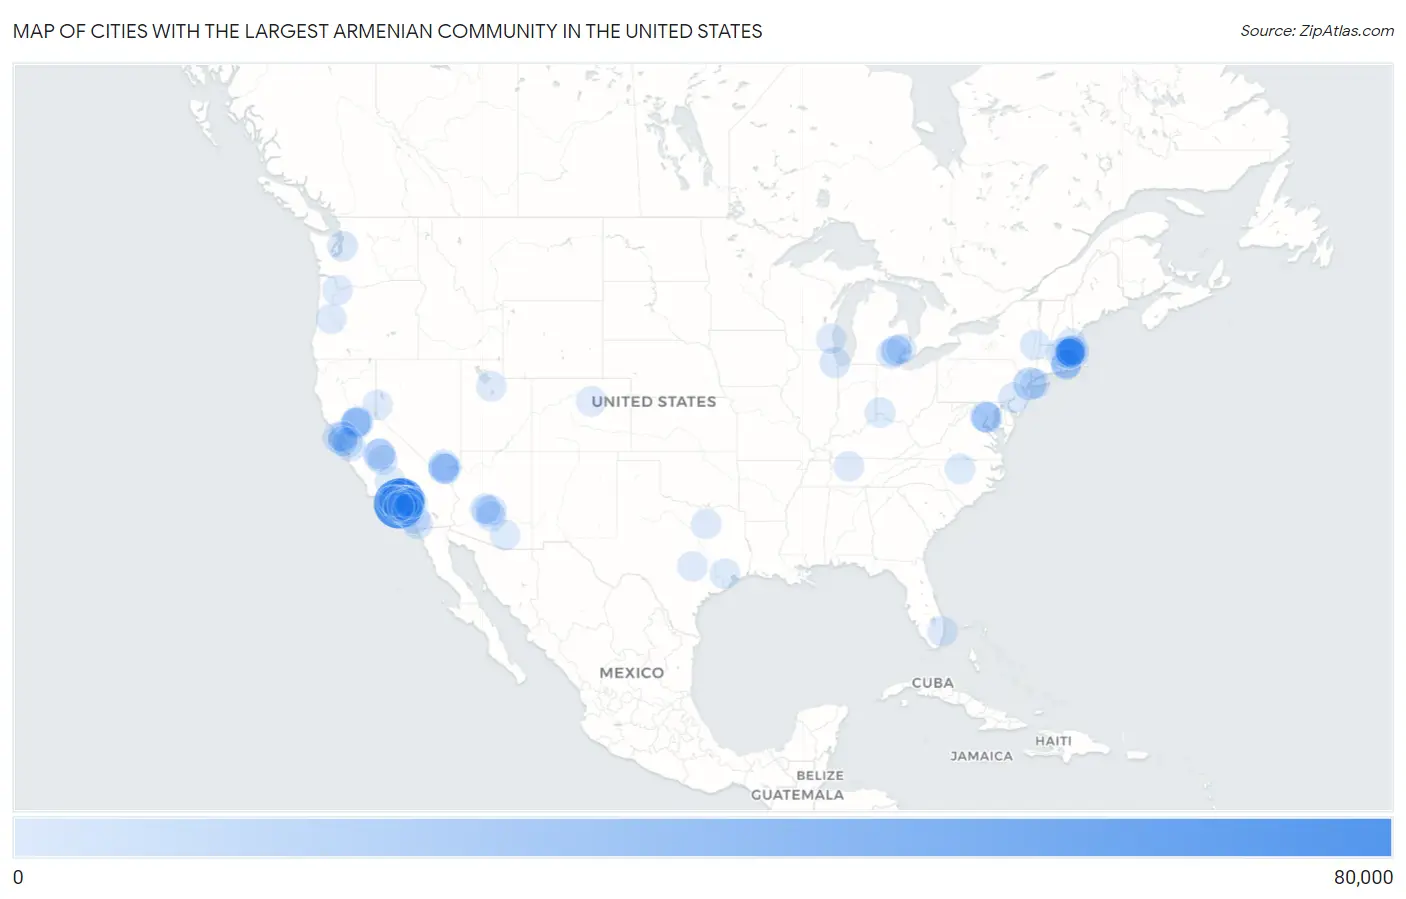
Map of Cities with the Largest Armenian Community in the United States
0
80,000
Cities with the Largest Armenian Community in the United States
| City | Armenian | vs State | vs National | |
| 1. | Los Angeles | 78,951 | 246,285(32.06%)#1 | 453,620(17.40%)#1 |
| 2. | Glendale | 67,121 | 246,285(27.25%)#2 | 453,620(14.80%)#2 |
| 3. | New York | 10,227 | 24,587(41.60%)#1 | 453,620(2.25%)#3 |
| 4. | Fresno | 6,616 | 246,285(2.69%)#3 | 453,620(1.46%)#4 |
| 5. | Pasadena | 3,158 | 246,285(1.28%)#4 | 453,620(0.70%)#5 |
| 6. | Altadena | 2,932 | 246,285(1.19%)#5 | 453,620(0.65%)#6 |
| 7. | Santa Clarita | 2,877 | 246,285(1.17%)#6 | 453,620(0.63%)#7 |
| 8. | Las Vegas | 2,461 | 7,453(33.02%)#1 | 453,620(0.54%)#8 |
| 9. | San Diego | 2,421 | 246,285(0.98%)#7 | 453,620(0.53%)#9 |
| 10. | Rancho Cordova | 2,266 | 246,285(0.92%)#8 | 453,620(0.50%)#10 |
| 11. | Chicago | 2,244 | 9,346(24.01%)#1 | 453,620(0.49%)#11 |
| 12. | San Francisco | 2,164 | 246,285(0.88%)#9 | 453,620(0.48%)#12 |
| 13. | Watertown Town | 1,903 | 27,399(6.95%)#1 | 453,620(0.42%)#13 |
| 14. | Spring Valley | 1,640 | 7,453(22.00%)#2 | 453,620(0.36%)#14 |
| 15. | Montebello | 1,617 | 246,285(0.66%)#10 | 453,620(0.36%)#15 |
| 16. | Phoenix | 1,574 | 5,358(29.38%)#1 | 453,620(0.35%)#16 |
| 17. | San Jose | 1,522 | 246,285(0.62%)#11 | 453,620(0.34%)#17 |
| 18. | La Crescenta Montrose | 1,445 | 246,285(0.59%)#12 | 453,620(0.32%)#18 |
| 19. | Waltham | 1,385 | 27,399(5.05%)#2 | 453,620(0.31%)#19 |
| 20. | Philadelphia | 1,261 | 9,766(12.91%)#1 | 453,620(0.28%)#20 |
| 21. | Boston | 1,249 | 27,399(4.56%)#3 | 453,620(0.28%)#21 |
| 22. | Irvine | 1,204 | 246,285(0.49%)#13 | 453,620(0.27%)#22 |
| 23. | La Canada Flintridge | 1,177 | 246,285(0.48%)#14 | 453,620(0.26%)#23 |
| 24. | Clovis | 1,163 | 246,285(0.47%)#15 | 453,620(0.26%)#24 |
| 25. | Seattle | 1,066 | 6,949(15.34%)#1 | 453,620(0.23%)#25 |
| 26. | Palmdale | 1,045 | 246,285(0.42%)#16 | 453,620(0.23%)#26 |
| 27. | Newport Beach | 1,041 | 246,285(0.42%)#17 | 453,620(0.23%)#27 |
| 28. | Long Beach | 1,018 | 246,285(0.41%)#18 | 453,620(0.22%)#28 |
| 29. | Houston | 932 | 6,530(14.27%)#1 | 453,620(0.21%)#29 |
| 30. | Enterprise | 913 | 7,453(12.25%)#3 | 453,620(0.20%)#30 |
| 31. | Washington | 884 | 884(100.00%)#1 | 453,620(0.19%)#31 |
| 32. | Worcester | 836 | 27,399(3.05%)#4 | 453,620(0.18%)#32 |
| 33. | Oakland | 801 | 246,285(0.33%)#19 | 453,620(0.18%)#33 |
| 34. | Denver | 770 | 4,708(16.36%)#1 | 453,620(0.17%)#34 |
| 35. | Whittier | 770 | 246,285(0.31%)#20 | 453,620(0.17%)#35 |
| 36. | Bakersfield | 769 | 246,285(0.31%)#21 | 453,620(0.17%)#36 |
| 37. | Belmont | 739 | 27,399(2.70%)#5 | 453,620(0.16%)#37 |
| 38. | Huntington Beach | 731 | 246,285(0.30%)#22 | 453,620(0.16%)#38 |
| 39. | Arcadia | 730 | 246,285(0.30%)#23 | 453,620(0.16%)#39 |
| 40. | Providence | 718 | 5,056(14.20%)#1 | 453,620(0.16%)#40 |
| 41. | La Verne | 714 | 246,285(0.29%)#24 | 453,620(0.16%)#41 |
| 42. | Santa Monica | 688 | 246,285(0.28%)#25 | 453,620(0.15%)#42 |
| 43. | Sandy | 682 | 2,652(25.72%)#1 | 453,620(0.15%)#43 |
| 44. | Fort Lee Borough | 664 | 14,436(4.60%)#1 | 453,620(0.15%)#44 |
| 45. | Livonia | 644 | 12,740(5.05%)#1 | 453,620(0.14%)#45 |
| 46. | Austin | 635 | 6,530(9.72%)#2 | 453,620(0.14%)#46 |
| 47. | Simi Valley | 629 | 246,285(0.26%)#26 | 453,620(0.14%)#47 |
| 48. | Henderson | 621 | 7,453(8.33%)#4 | 453,620(0.14%)#48 |
| 49. | Portland | 619 | 3,339(18.54%)#1 | 453,620(0.14%)#49 |
| 50. | Farmington Hills | 612 | 12,740(4.80%)#2 | 453,620(0.13%)#50 |
| 51. | Sacramento | 605 | 246,285(0.25%)#27 | 453,620(0.13%)#51 |
| 52. | Haverhill | 602 | 27,399(2.20%)#6 | 453,620(0.13%)#52 |
| 53. | Deerfield Beach | 599 | 12,396(4.83%)#1 | 453,620(0.13%)#53 |
| 54. | Laguna Niguel | 588 | 246,285(0.24%)#28 | 453,620(0.13%)#54 |
| 55. | Anaheim | 587 | 246,285(0.24%)#29 | 453,620(0.13%)#55 |
| 56. | Citrus Heights | 586 | 246,285(0.24%)#30 | 453,620(0.13%)#56 |
| 57. | Reno | 577 | 7,453(7.74%)#5 | 453,620(0.13%)#57 |
| 58. | Kingsburg | 559 | 246,285(0.23%)#31 | 453,620(0.12%)#58 |
| 59. | Arden Arcade | 557 | 246,285(0.23%)#32 | 453,620(0.12%)#59 |
| 60. | Scottsdale | 545 | 5,358(10.17%)#2 | 453,620(0.12%)#60 |
| 61. | Cranston | 542 | 5,056(10.72%)#2 | 453,620(0.12%)#61 |
| 62. | Carlsbad | 538 | 246,285(0.22%)#33 | 453,620(0.12%)#62 |
| 63. | Rancho Cucamonga | 524 | 246,285(0.21%)#34 | 453,620(0.12%)#63 |
| 64. | Berkeley | 514 | 246,285(0.21%)#35 | 453,620(0.11%)#64 |
| 65. | Burlington | 507 | 27,399(1.85%)#7 | 453,620(0.11%)#65 |
| 66. | Durham | 504 | 3,719(13.55%)#1 | 453,620(0.11%)#66 |
| 67. | Thousand Oaks | 504 | 246,285(0.20%)#36 | 453,620(0.11%)#67 |
| 68. | Warwick | 487 | 5,056(9.63%)#3 | 453,620(0.11%)#68 |
| 69. | Marlborough | 483 | 27,399(1.76%)#8 | 453,620(0.11%)#69 |
| 70. | Arlington | 479 | 27,399(1.75%)#9 | 453,620(0.11%)#70 |
| 71. | Duarte | 478 | 246,285(0.19%)#37 | 453,620(0.11%)#71 |
| 72. | Mclean | 477 | 6,803(7.01%)#1 | 453,620(0.11%)#72 |
| 73. | Claremont | 467 | 246,285(0.19%)#38 | 453,620(0.10%)#73 |
| 74. | Chandler | 460 | 5,358(8.59%)#3 | 453,620(0.10%)#74 |
| 75. | Fontana | 460 | 246,285(0.19%)#39 | 453,620(0.10%)#75 |
| 76. | Somerville | 459 | 27,399(1.68%)#10 | 453,620(0.10%)#76 |
| 77. | Calabasas | 455 | 246,285(0.18%)#40 | 453,620(0.10%)#77 |
| 78. | Nashville | 449 | 1,602(28.03%)#1 | 453,620(0.10%)#78 |
| 79. | Tucson | 448 | 5,358(8.36%)#4 | 453,620(0.10%)#79 |
| 80. | Garden City | 448 | 24,587(1.82%)#2 | 453,620(0.10%)#80 |
| 81. | Swampscott | 437 | 27,399(1.59%)#11 | 453,620(0.10%)#81 |
| 82. | Peoria | 435 | 5,358(8.12%)#5 | 453,620(0.10%)#82 |
| 83. | Troy | 424 | 24,587(1.72%)#3 | 453,620(0.09%)#83 |
| 84. | Ann Arbor | 423 | 12,740(3.32%)#3 | 453,620(0.09%)#84 |
| 85. | Eugene | 421 | 3,339(12.61%)#2 | 453,620(0.09%)#85 |
| 86. | Cincinnati | 419 | 4,901(8.55%)#1 | 453,620(0.09%)#86 |
| 87. | Torrance | 419 | 246,285(0.17%)#41 | 453,620(0.09%)#87 |
| 88. | Wellesley | 419 | 27,399(1.53%)#12 | 453,620(0.09%)#88 |
| 89. | Milwaukee | 413 | 3,442(12.00%)#1 | 453,620(0.09%)#89 |
| 90. | Newton | 413 | 27,399(1.51%)#13 | 453,620(0.09%)#90 |
| 91. | Dallas | 411 | 6,530(6.29%)#3 | 453,620(0.09%)#91 |
| 92. | Downey | 403 | 246,285(0.16%)#42 | 453,620(0.09%)#92 |
| 93. | Ontario | 402 | 246,285(0.16%)#43 | 453,620(0.09%)#93 |
| 94. | Sterling Heights | 398 | 12,740(3.12%)#4 | 453,620(0.09%)#94 |
| 95. | Fremont | 395 | 246,285(0.16%)#44 | 453,620(0.09%)#95 |
| 96. | Arlington | 394 | 6,803(5.79%)#2 | 453,620(0.09%)#96 |
| 97. | Cambridge | 391 | 27,399(1.43%)#14 | 453,620(0.09%)#97 |
| 98. | San Mateo | 391 | 246,285(0.16%)#45 | 453,620(0.09%)#98 |
| 99. | Tustin | 381 | 246,285(0.15%)#46 | 453,620(0.08%)#99 |
| 100. | Redondo Beach | 381 | 246,285(0.15%)#47 | 453,620(0.08%)#100 |
Common Questions
What are the Top 10 Cities with the Largest Armenian Community in the United States?
Top 10 Cities with the Largest Armenian Community in the United States are:
What city has the Largest Armenian Community in the United States?
Los Angeles has the Largest Armenian Community in the United States with 78,951.
What is the Total Armenian Population in the United States?
Total Armenian Population in the United States is 453,620.