Cities with the Largest Indonesian Community in the United States
RELATED REPORTS & OPTIONS
Indonesian
United States
Compare Cities
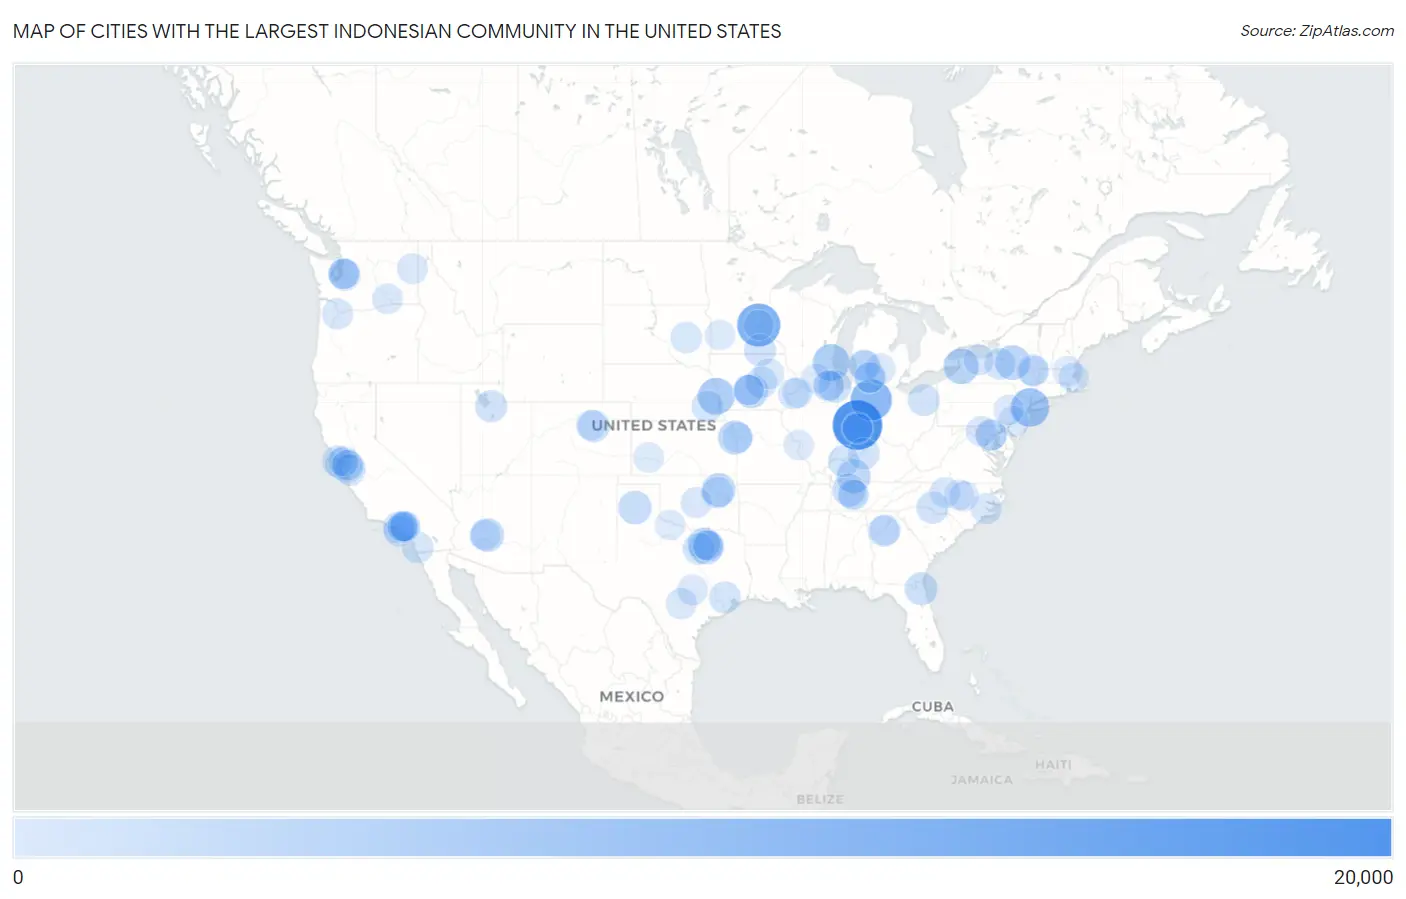
Map of Cities with the Largest Indonesian Community in the United States
0
20,000
Cities with the Largest Indonesian Community in the United States
| City | Indonesian | vs State | vs National | |
| 1. | Indianapolis | 15,189 | 27,674(54.89%)#1 | 218,048(6.97%)#1 |
| 2. | St Paul | 10,065 | 15,237(66.06%)#1 | 218,048(4.62%)#2 |
| 3. | Fort Wayne | 8,706 | 27,674(31.46%)#2 | 218,048(3.99%)#3 |
| 4. | New York | 6,477 | 21,118(30.67%)#1 | 218,048(2.97%)#4 |
| 5. | Milwaukee | 5,137 | 6,333(81.11%)#1 | 218,048(2.36%)#5 |
| 6. | Omaha | 5,129 | 7,019(73.07%)#1 | 218,048(2.35%)#6 |
| 7. | Buffalo | 3,975 | 21,118(18.82%)#2 | 218,048(1.82%)#7 |
| 8. | Utica | 3,655 | 21,118(17.31%)#3 | 218,048(1.68%)#8 |
| 9. | Bowling Green | 3,075 | 6,326(48.61%)#1 | 218,048(1.41%)#9 |
| 10. | Kansas City | 3,053 | 4,449(68.62%)#1 | 218,048(1.40%)#10 |
| 11. | Des Moines | 2,899 | 7,226(40.12%)#1 | 218,048(1.33%)#11 |
| 12. | Dallas | 2,795 | 17,492(15.98%)#1 | 218,048(1.28%)#12 |
| 13. | Tulsa | 2,750 | 5,761(47.73%)#1 | 218,048(1.26%)#13 |
| 14. | Amarillo | 2,569 | 17,492(14.69%)#2 | 218,048(1.18%)#14 |
| 15. | Phoenix | 2,555 | 3,740(68.32%)#1 | 218,048(1.17%)#15 |
| 16. | Nashville | 2,166 | 3,616(59.90%)#1 | 218,048(0.99%)#16 |
| 17. | Jacksonville | 2,137 | 5,208(41.03%)#1 | 218,048(0.98%)#17 |
| 18. | Chicago | 1,868 | 7,613(24.54%)#1 | 218,048(0.86%)#18 |
| 19. | Lewisville | 1,805 | 17,492(10.32%)#3 | 218,048(0.83%)#19 |
| 20. | Aurora | 1,642 | 2,990(54.92%)#1 | 218,048(0.75%)#20 |
| 21. | Charlotte | 1,638 | 6,161(26.59%)#1 | 218,048(0.75%)#21 |
| 22. | Fremont | 1,622 | 23,418(6.93%)#1 | 218,048(0.74%)#22 |
| 23. | Akron | 1,546 | 2,335(66.21%)#1 | 218,048(0.71%)#23 |
| 24. | Salt Lake City | 1,543 | 2,121(72.75%)#1 | 218,048(0.71%)#24 |
| 25. | Austin | 1,529 | 15,237(10.03%)#2 | 218,048(0.70%)#25 |
| 26. | Fort Worth | 1,427 | 17,492(8.16%)#4 | 218,048(0.65%)#26 |
| 27. | Daly City | 1,375 | 23,418(5.87%)#2 | 218,048(0.63%)#27 |
| 28. | Los Angeles | 1,366 | 23,418(5.83%)#3 | 218,048(0.63%)#28 |
| 29. | Battle Creek | 1,365 | 5,230(26.10%)#1 | 218,048(0.63%)#29 |
| 30. | Houston | 1,344 | 17,492(7.68%)#5 | 218,048(0.62%)#30 |
| 31. | Louisville | 1,337 | 6,326(21.13%)#2 | 218,048(0.61%)#31 |
| 32. | Syracuse | 1,318 | 21,118(6.24%)#4 | 218,048(0.60%)#32 |
| 33. | Lincoln | 1,317 | 7,019(18.76%)#2 | 218,048(0.60%)#33 |
| 34. | Kent | 1,304 | 5,207(25.04%)#1 | 218,048(0.60%)#34 |
| 35. | Owensboro | 1,237 | 6,326(19.55%)#3 | 218,048(0.57%)#35 |
| 36. | San Diego | 1,228 | 23,418(5.24%)#4 | 218,048(0.56%)#36 |
| 37. | Marshalltown | 1,203 | 7,226(16.65%)#2 | 218,048(0.55%)#37 |
| 38. | Jenks | 1,201 | 5,761(20.85%)#2 | 218,048(0.55%)#38 |
| 39. | San Jose | 1,066 | 23,418(4.55%)#5 | 218,048(0.49%)#39 |
| 40. | Kentwood | 1,047 | 5,230(20.02%)#2 | 218,048(0.48%)#40 |
| 41. | Albany | 1,042 | 21,118(4.93%)#5 | 218,048(0.48%)#41 |
| 42. | Huron | 1,033 | 1,507(68.55%)#1 | 218,048(0.47%)#42 |
| 43. | Portland | 960 | 1,703(56.37%)#1 | 218,048(0.44%)#43 |
| 44. | Clarkston | 942 | 7,090(13.29%)#1 | 218,048(0.43%)#44 |
| 45. | San Francisco | 936 | 23,418(4.00%)#6 | 218,048(0.43%)#45 |
| 46. | Arbutus | 908 | 6,337(14.33%)#1 | 218,048(0.42%)#46 |
| 47. | Rock Island | 902 | 7,613(11.85%)#2 | 218,048(0.41%)#47 |
| 48. | San Antonio | 868 | 17,492(4.96%)#6 | 218,048(0.40%)#48 |
| 49. | New Bern | 852 | 6,161(13.83%)#2 | 218,048(0.39%)#49 |
| 50. | Wheaton | 812 | 7,613(10.67%)#3 | 218,048(0.37%)#50 |
| 51. | Oklahoma City | 810 | 5,761(14.06%)#3 | 218,048(0.37%)#51 |
| 52. | Woodlawn Cdp Baltimore County | 754 | 6,337(11.90%)#2 | 218,048(0.35%)#52 |
| 53. | Catonsville | 727 | 6,337(11.47%)#3 | 218,048(0.33%)#53 |
| 54. | Waterloo | 724 | 7,226(10.02%)#3 | 218,048(0.33%)#54 |
| 55. | Grand Rapids | 716 | 5,230(13.69%)#3 | 218,048(0.33%)#55 |
| 56. | Garland | 701 | 17,492(4.01%)#7 | 218,048(0.32%)#56 |
| 57. | Austin | 684 | 17,492(3.91%)#8 | 218,048(0.31%)#57 |
| 58. | Lansing | 683 | 5,230(13.06%)#4 | 218,048(0.31%)#58 |
| 59. | Tucker | 683 | 7,090(9.63%)#2 | 218,048(0.31%)#59 |
| 60. | Pasco | 642 | 5,207(12.33%)#2 | 218,048(0.29%)#60 |
| 61. | Torrance | 634 | 23,418(2.71%)#7 | 218,048(0.29%)#61 |
| 62. | Philadelphia | 615 | 2,318(26.53%)#1 | 218,048(0.28%)#62 |
| 63. | Spokane | 608 | 5,207(11.68%)#3 | 218,048(0.28%)#63 |
| 64. | High Point | 608 | 6,161(9.87%)#3 | 218,048(0.28%)#64 |
| 65. | Rochester | 585 | 21,118(2.77%)#6 | 218,048(0.27%)#65 |
| 66. | Seatac | 582 | 5,207(11.18%)#4 | 218,048(0.27%)#66 |
| 67. | Tukwila | 560 | 5,207(10.75%)#5 | 218,048(0.26%)#67 |
| 68. | Frederick | 555 | 6,337(8.76%)#4 | 218,048(0.25%)#68 |
| 69. | Glendale | 554 | 3,740(14.81%)#2 | 218,048(0.25%)#69 |
| 70. | Smyrna | 552 | 3,616(15.27%)#2 | 218,048(0.25%)#70 |
| 71. | Union City | 545 | 23,418(2.33%)#8 | 218,048(0.25%)#71 |
| 72. | Clive | 531 | 7,226(7.35%)#4 | 218,048(0.24%)#72 |
| 73. | Southport | 496 | 27,674(1.79%)#3 | 218,048(0.23%)#73 |
| 74. | Richardson | 493 | 17,492(2.82%)#9 | 218,048(0.23%)#74 |
| 75. | Garden City | 489 | 4,449(10.99%)#2 | 218,048(0.22%)#75 |
| 76. | Lowell | 488 | 1,759(27.74%)#1 | 218,048(0.22%)#76 |
| 77. | Rensselaer | 485 | 21,118(2.30%)#7 | 218,048(0.22%)#77 |
| 78. | West Covina | 466 | 23,418(1.99%)#9 | 218,048(0.21%)#78 |
| 79. | Rockford | 459 | 7,613(6.03%)#4 | 218,048(0.21%)#79 |
| 80. | Rosemead | 457 | 23,418(1.95%)#10 | 218,048(0.21%)#80 |
| 81. | Murfreesboro | 451 | 3,616(12.47%)#3 | 218,048(0.21%)#81 |
| 82. | Urbandale | 451 | 7,226(6.24%)#5 | 218,048(0.21%)#82 |
| 83. | Oakland | 447 | 23,418(1.91%)#11 | 218,048(0.21%)#83 |
| 84. | Alhambra | 447 | 23,418(1.91%)#12 | 218,048(0.21%)#84 |
| 85. | Monterey Park | 431 | 23,418(1.84%)#13 | 218,048(0.20%)#85 |
| 86. | Maplewood | 424 | 15,237(2.78%)#3 | 218,048(0.19%)#86 |
| 87. | Chapel Hill | 420 | 6,161(6.82%)#4 | 218,048(0.19%)#87 |
| 88. | St Louis | 413 | 1,767(23.37%)#1 | 218,048(0.19%)#88 |
| 89. | Allentown | 413 | 2,318(17.82%)#2 | 218,048(0.19%)#89 |
| 90. | Marshall | 413 | 15,237(2.71%)#4 | 218,048(0.19%)#90 |
| 91. | Denver | 411 | 2,990(13.75%)#2 | 218,048(0.19%)#91 |
| 92. | Raleigh | 398 | 6,161(6.46%)#5 | 218,048(0.18%)#92 |
| 93. | Kansas City | 396 | 1,767(22.41%)#2 | 218,048(0.18%)#93 |
| 94. | Greenwood | 383 | 27,674(1.38%)#4 | 218,048(0.18%)#94 |
| 95. | Vernon | 382 | 17,492(2.18%)#10 | 218,048(0.18%)#95 |
| 96. | Springfield | 382 | 5,230(7.30%)#5 | 218,048(0.18%)#96 |
| 97. | Baldwin Park | 374 | 23,418(1.60%)#14 | 218,048(0.17%)#97 |
| 98. | Carol Stream | 371 | 7,613(4.87%)#5 | 218,048(0.17%)#98 |
| 99. | Boston | 367 | 1,759(20.86%)#2 | 218,048(0.17%)#99 |
| 100. | East Moline | 367 | 7,613(4.82%)#6 | 218,048(0.17%)#100 |
Common Questions
What are the Top 10 Cities with the Largest Indonesian Community in the United States?
Top 10 Cities with the Largest Indonesian Community in the United States are:
#1
15,189
#2
10,065
#3
8,706
#4
6,477
#5
5,137
#6
5,129
#7
3,975
#8
3,655
#9
3,075
#10
3,053
What city has the Largest Indonesian Community in the United States?
Indianapolis has the Largest Indonesian Community in the United States with 15,189.
What is the Total Indonesian Population in the United States?
Total Indonesian Population in the United States is 218,048.