Annapolis Neck, MD Map & Demographics
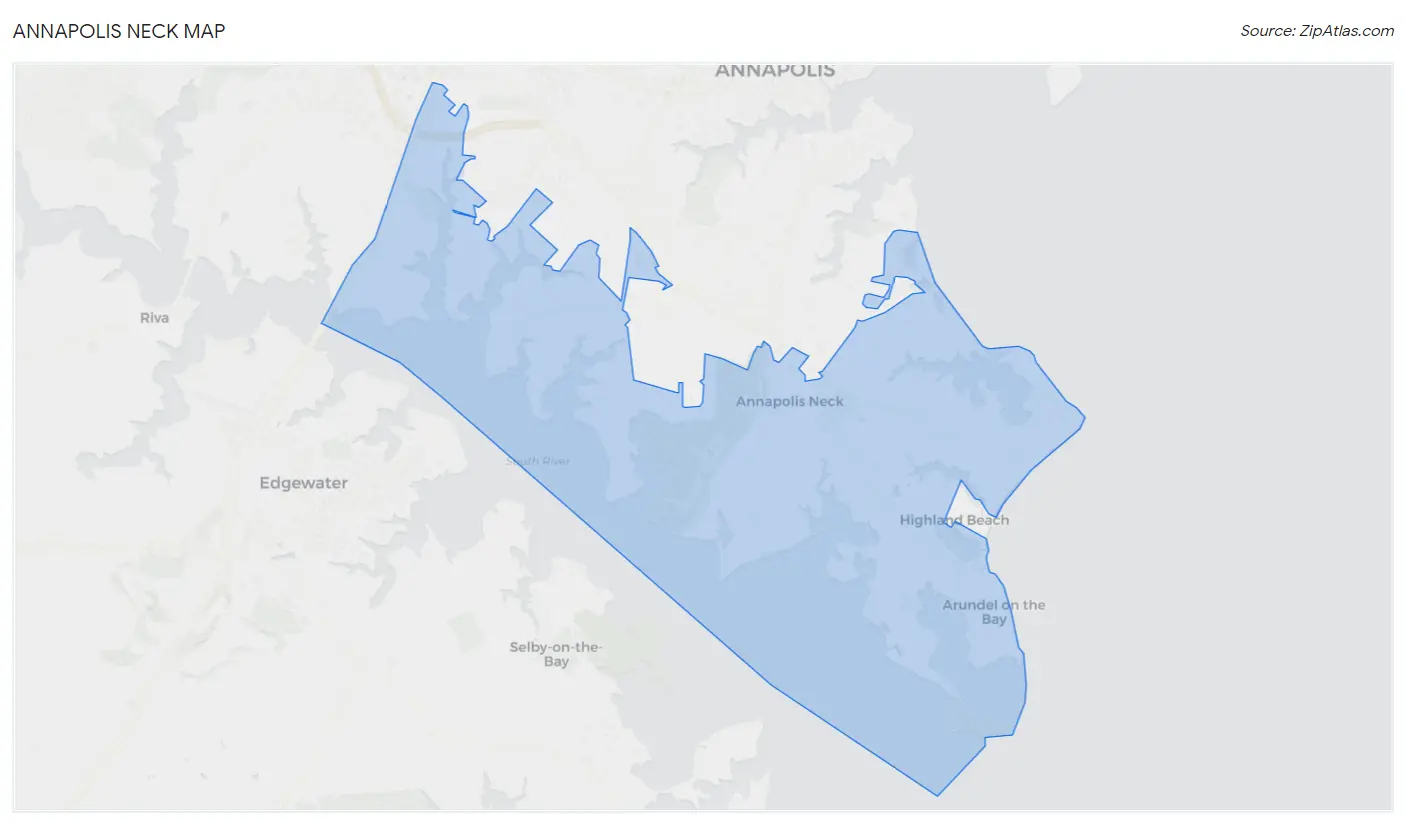
Annapolis Neck Map
Annapolis Neck Overview
$87,155
PER CAPITA INCOME
$188,798
AVG FAMILY INCOME
$161,859
AVG HOUSEHOLD INCOME
28.9%
WAGE / INCOME GAP [ % ]
71.1¢/ $1
WAGE / INCOME GAP [ $ ]
0.43
INEQUALITY / GINI INDEX
12,712
TOTAL POPULATION
6,517
MALE POPULATION
6,195
FEMALE POPULATION
105.20
MALES / 100 FEMALES
95.06
FEMALES / 100 MALES
49.7
MEDIAN AGE
2.9
AVG FAMILY SIZE
2.5
AVG HOUSEHOLD SIZE
6,600
LABOR FORCE [ PEOPLE ]
63.1%
PERCENT IN LABOR FORCE
1.9%
UNEMPLOYMENT RATE
Income in Annapolis Neck
Income Overview in Annapolis Neck
Per Capita Income in Annapolis Neck is $87,155, while median incomes of families and households are $188,798 and $161,859 respectively.
| Characteristic | Number | Measure |
| Per Capita Income | 12,712 | $87,155 |
| Median Family Income | 3,697 | $188,798 |
| Mean Family Income | 3,697 | $253,111 |
| Median Household Income | 5,126 | $161,859 |
| Mean Household Income | 5,126 | $216,070 |
| Income Deficit | 3,697 | $0 |
| Wage / Income Gap (%) | 12,712 | 28.89% |
| Wage / Income Gap ($) | 12,712 | 71.11¢ per $1 |
| Gini / Inequality Index | 12,712 | 0.43 |
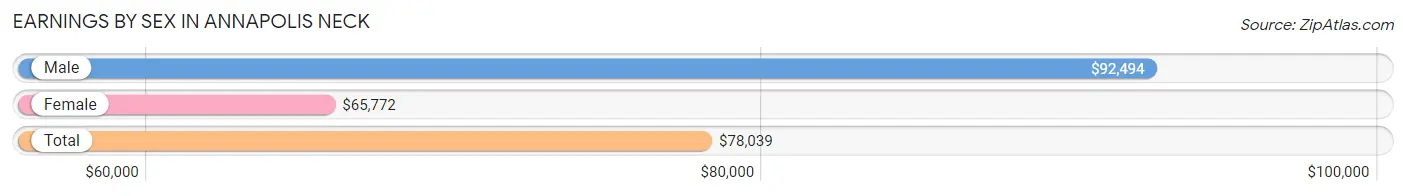
Earnings by Sex in Annapolis Neck
Average Earnings in Annapolis Neck are $78,039, $92,494 for men and $65,772 for women, a difference of 28.9%.
| Sex | Number | Average Earnings |
| Male | 4,015 (56.3%) | $92,494 |
| Female | 3,119 (43.7%) | $65,772 |
| Total | 7,134 (100.0%) | $78,039 |
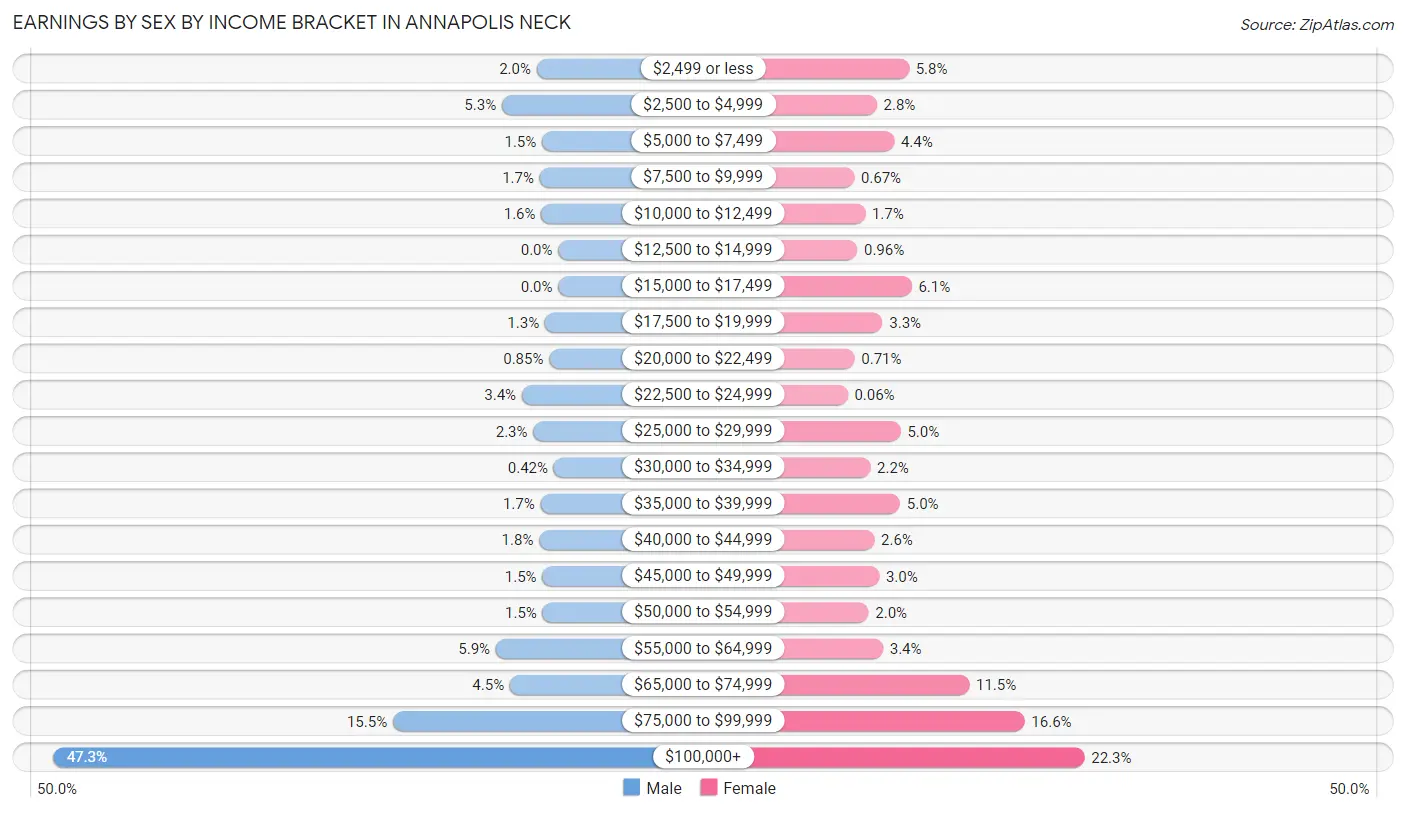
Earnings by Sex by Income Bracket in Annapolis Neck
The most common earnings brackets in Annapolis Neck are $100,000+ for men (1,898 | 47.3%) and $100,000+ for women (694 | 22.3%).
| Income | Male | Female |
| $2,499 or less | 81 (2.0%) | 181 (5.8%) |
| $2,500 to $4,999 | 212 (5.3%) | 87 (2.8%) |
| $5,000 to $7,499 | 61 (1.5%) | 138 (4.4%) |
| $7,500 to $9,999 | 70 (1.7%) | 21 (0.7%) |
| $10,000 to $12,499 | 64 (1.6%) | 53 (1.7%) |
| $12,500 to $14,999 | 0 (0.0%) | 30 (1.0%) |
| $15,000 to $17,499 | 0 (0.0%) | 189 (6.1%) |
| $17,500 to $19,999 | 50 (1.3%) | 104 (3.3%) |
| $20,000 to $22,499 | 34 (0.9%) | 22 (0.7%) |
| $22,500 to $24,999 | 137 (3.4%) | 2 (0.1%) |
| $25,000 to $29,999 | 94 (2.3%) | 157 (5.0%) |
| $30,000 to $34,999 | 17 (0.4%) | 68 (2.2%) |
| $35,000 to $39,999 | 67 (1.7%) | 155 (5.0%) |
| $40,000 to $44,999 | 72 (1.8%) | 80 (2.6%) |
| $45,000 to $49,999 | 60 (1.5%) | 94 (3.0%) |
| $50,000 to $54,999 | 59 (1.5%) | 63 (2.0%) |
| $55,000 to $64,999 | 235 (5.9%) | 105 (3.4%) |
| $65,000 to $74,999 | 182 (4.5%) | 357 (11.5%) |
| $75,000 to $99,999 | 622 (15.5%) | 519 (16.6%) |
| $100,000+ | 1,898 (47.3%) | 694 (22.3%) |
| Total | 4,015 (100.0%) | 3,119 (100.0%) |
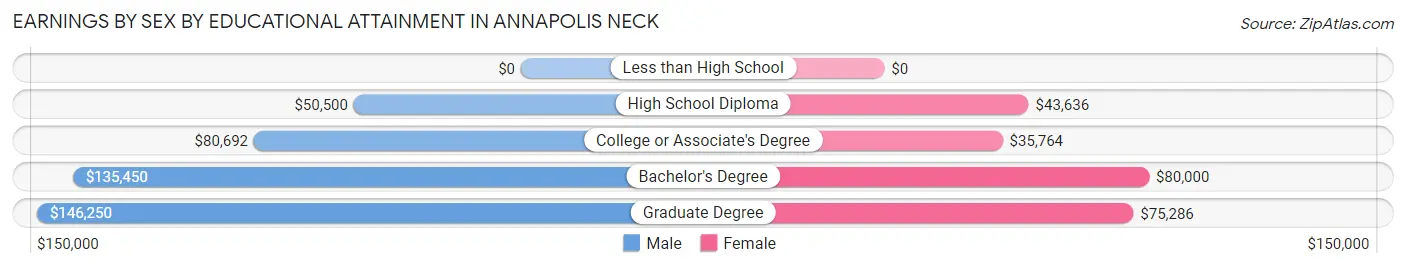
Earnings by Sex by Educational Attainment in Annapolis Neck
Average earnings in Annapolis Neck are $114,241 for men and $69,124 for women, a difference of 39.5%. Men with an educational attainment of graduate degree enjoy the highest average annual earnings of $146,250, while those with high school diploma education earn the least with $50,500. Women with an educational attainment of bachelor's degree earn the most with the average annual earnings of $80,000, while those with college or associate's degree education have the smallest earnings of $35,764.
| Educational Attainment | Male Income | Female Income |
| Less than High School | - | - |
| High School Diploma | $50,500 | $43,636 |
| College or Associate's Degree | $80,692 | $35,764 |
| Bachelor's Degree | $135,450 | $80,000 |
| Graduate Degree | $146,250 | $75,286 |
| Total | $114,241 | $69,124 |
Family Income in Annapolis Neck
Family Income Brackets in Annapolis Neck
According to the Annapolis Neck family income data, there are 1,763 families falling into the $200,000+ income range, which is the most common income bracket and makes up 47.7% of all families.
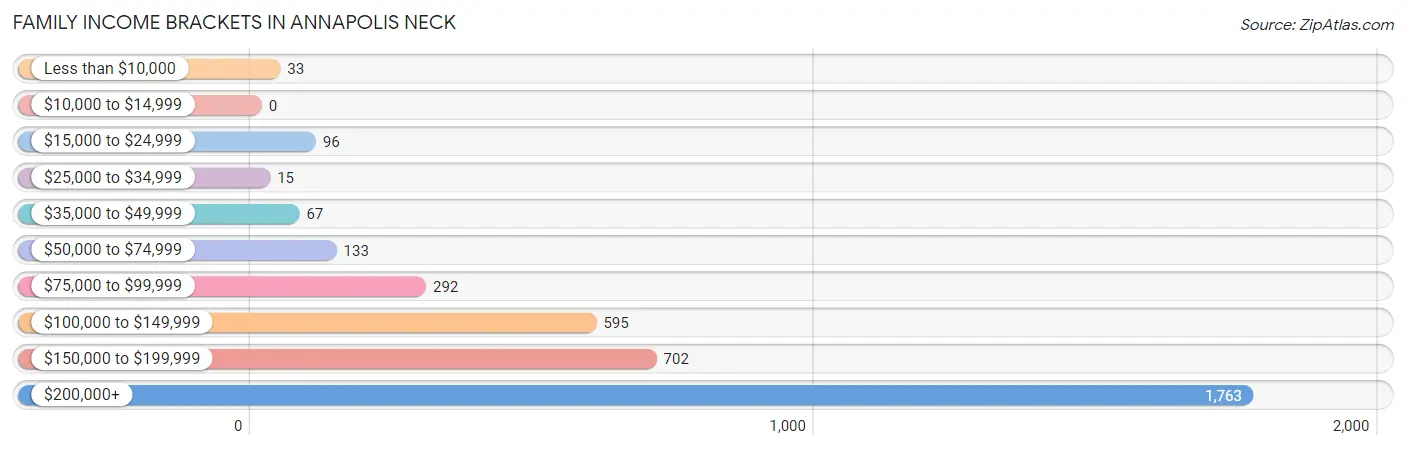
| Income Bracket | # Families | % Families |
| Less than $10,000 | 33 | 0.9% |
| $10,000 to $14,999 | 0 | 0.0% |
| $15,000 to $24,999 | 96 | 2.6% |
| $25,000 to $34,999 | 15 | 0.4% |
| $35,000 to $49,999 | 67 | 1.8% |
| $50,000 to $74,999 | 133 | 3.6% |
| $75,000 to $99,999 | 292 | 7.9% |
| $100,000 to $149,999 | 595 | 16.1% |
| $150,000 to $199,999 | 702 | 19.0% |
| $200,000+ | 1,763 | 47.7% |
Family Income by Famaliy Size in Annapolis Neck
4-person families (560 | 15.1%) account for the highest median family income in Annapolis Neck with $233,636 per family, while 2-person families (2,068 | 55.9%) have the highest median income of $80,864 per family member.
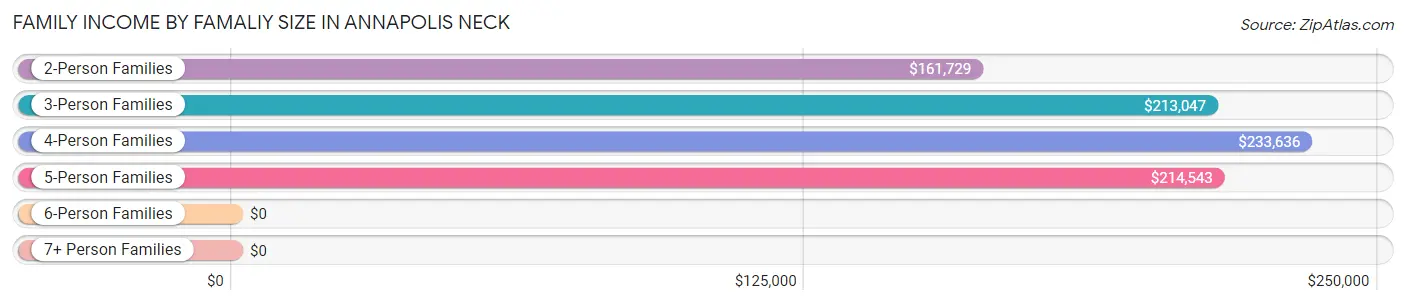
| Income Bracket | # Families | Median Income |
| 2-Person Families | 2,068 (55.9%) | $161,729 |
| 3-Person Families | 703 (19.0%) | $213,047 |
| 4-Person Families | 560 (15.1%) | $233,636 |
| 5-Person Families | 342 (9.2%) | $214,543 |
| 6-Person Families | 0 (0.0%) | $0 |
| 7+ Person Families | 24 (0.6%) | $0 |
| Total | 3,697 (100.0%) | $188,798 |
Family Income by Number of Earners in Annapolis Neck
The median family income in Annapolis Neck is $188,798, with families comprising 2 earners (1,714) having the highest median family income of $232,130, while families with no earners (716) have the lowest median family income of $109,348, accounting for 46.4% and 19.4% of families, respectively.
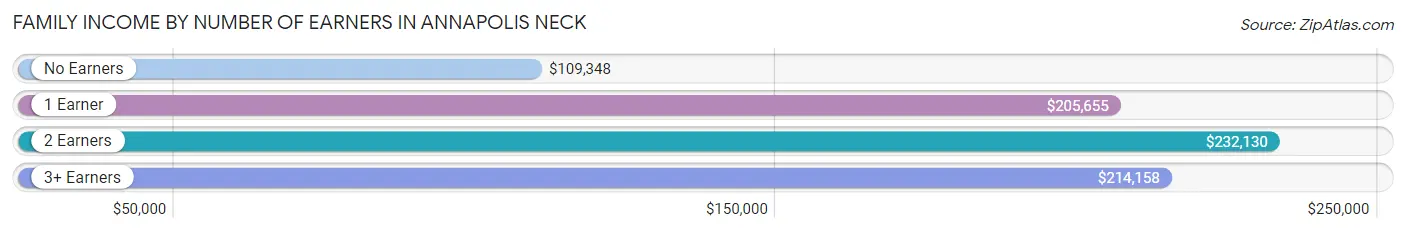
| Number of Earners | # Families | Median Income |
| No Earners | 716 (19.4%) | $109,348 |
| 1 Earner | 901 (24.4%) | $205,655 |
| 2 Earners | 1,714 (46.4%) | $232,130 |
| 3+ Earners | 366 (9.9%) | $214,158 |
| Total | 3,697 (100.0%) | $188,798 |
Household Income in Annapolis Neck
Household Income Brackets in Annapolis Neck
With 1,938 households falling in the category, the $200,000+ income range is the most frequent in Annapolis Neck, accounting for 37.8% of all households.
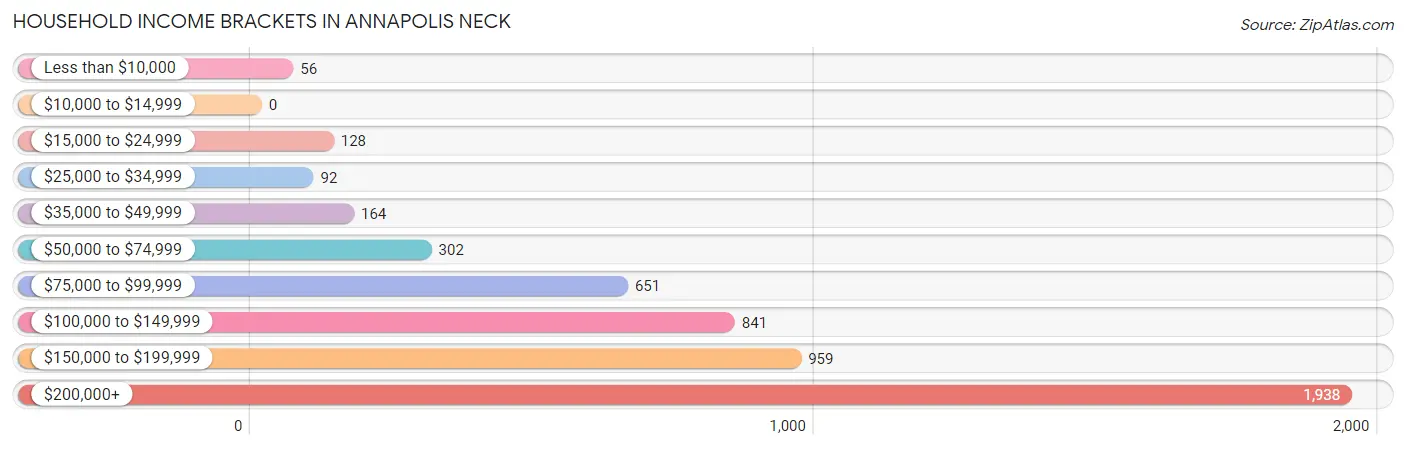
| Income Bracket | # Households | % Households |
| Less than $10,000 | 56 | 1.1% |
| $10,000 to $14,999 | 0 | 0.0% |
| $15,000 to $24,999 | 128 | 2.5% |
| $25,000 to $34,999 | 92 | 1.8% |
| $35,000 to $49,999 | 164 | 3.2% |
| $50,000 to $74,999 | 302 | 5.9% |
| $75,000 to $99,999 | 651 | 12.7% |
| $100,000 to $149,999 | 841 | 16.4% |
| $150,000 to $199,999 | 959 | 18.7% |
| $200,000+ | 1,938 | 37.8% |
Household Income by Householder Age in Annapolis Neck
The median household income in Annapolis Neck is $161,859, with the highest median household income of $201,875 found in the 45 to 64 years age bracket for the primary householder. A total of 2,118 households (41.3%) fall into this category.
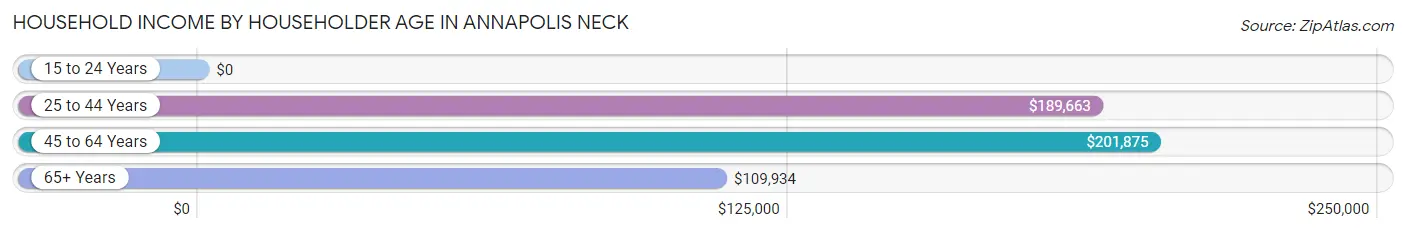
| Income Bracket | # Households | Median Income |
| 15 to 24 Years | 0 (0.0%) | $0 |
| 25 to 44 Years | 1,055 (20.6%) | $189,663 |
| 45 to 64 Years | 2,118 (41.3%) | $201,875 |
| 65+ Years | 1,953 (38.1%) | $109,934 |
| Total | 5,126 (100.0%) | $161,859 |
Poverty in Annapolis Neck
Income Below Poverty by Sex and Age in Annapolis Neck
With 1.4% poverty level for males and 3.3% for females among the residents of Annapolis Neck, 18 to 24 year old males and 16 and 17 year old females are the most vulnerable to poverty, with 54 males (16.1%) and 38 females (30.2%) in their respective age groups living below the poverty level.
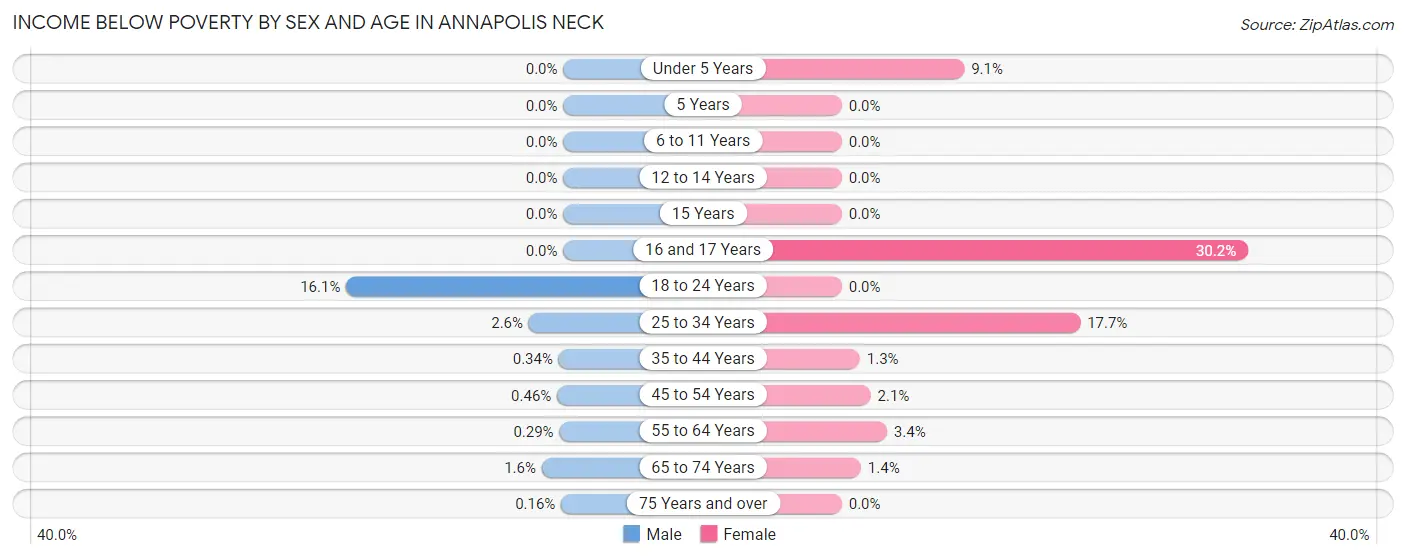
| Age Bracket | Male | Female |
| Under 5 Years | 0 (0.0%) | 21 (9.1%) |
| 5 Years | 0 (0.0%) | 0 (0.0%) |
| 6 to 11 Years | 0 (0.0%) | 0 (0.0%) |
| 12 to 14 Years | 0 (0.0%) | 0 (0.0%) |
| 15 Years | 0 (0.0%) | 0 (0.0%) |
| 16 and 17 Years | 0 (0.0%) | 38 (30.2%) |
| 18 to 24 Years | 54 (16.1%) | 0 (0.0%) |
| 25 to 34 Years | 10 (2.6%) | 57 (17.7%) |
| 35 to 44 Years | 3 (0.3%) | 10 (1.3%) |
| 45 to 54 Years | 4 (0.5%) | 19 (2.1%) |
| 55 to 64 Years | 3 (0.3%) | 41 (3.4%) |
| 65 to 74 Years | 14 (1.6%) | 13 (1.4%) |
| 75 Years and over | 1 (0.2%) | 0 (0.0%) |
| Total | 89 (1.4%) | 199 (3.3%) |
Income Above Poverty by Sex and Age in Annapolis Neck
According to the poverty statistics in Annapolis Neck, males aged under 5 years and females aged 5 years are the age groups that are most secure financially, with 100.0% of males and 100.0% of females in these age groups living above the poverty line.
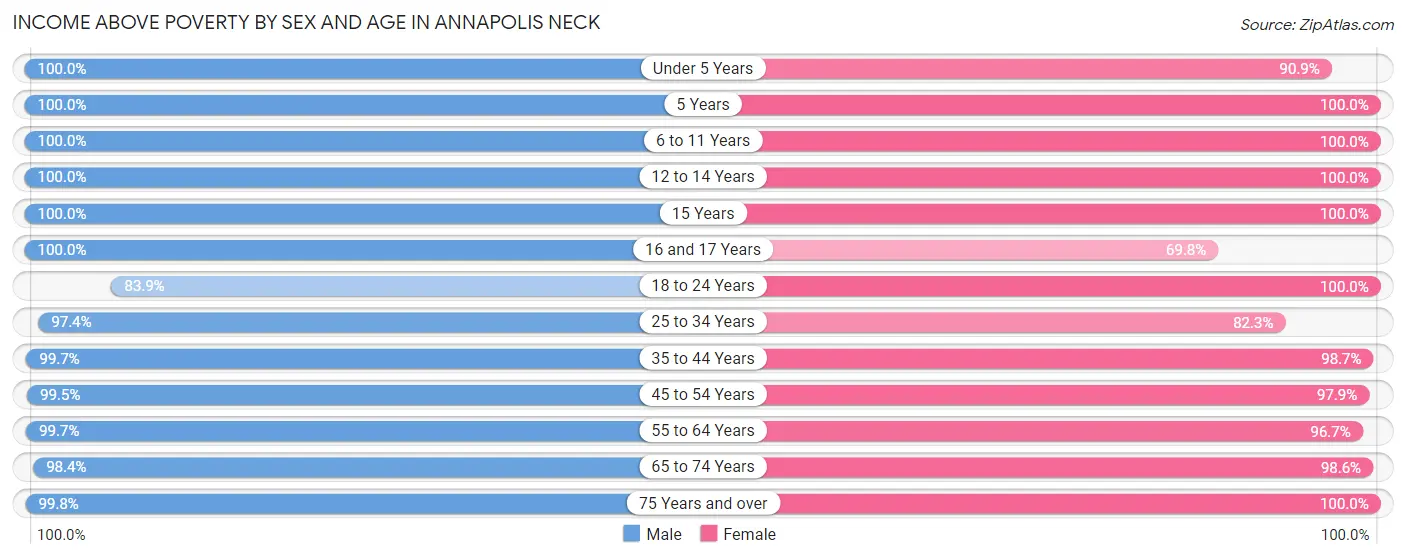
| Age Bracket | Male | Female |
| Under 5 Years | 404 (100.0%) | 210 (90.9%) |
| 5 Years | 14 (100.0%) | 77 (100.0%) |
| 6 to 11 Years | 498 (100.0%) | 316 (100.0%) |
| 12 to 14 Years | 310 (100.0%) | 126 (100.0%) |
| 15 Years | 57 (100.0%) | 93 (100.0%) |
| 16 and 17 Years | 211 (100.0%) | 88 (69.8%) |
| 18 to 24 Years | 281 (83.9%) | 368 (100.0%) |
| 25 to 34 Years | 381 (97.4%) | 265 (82.3%) |
| 35 to 44 Years | 873 (99.7%) | 736 (98.7%) |
| 45 to 54 Years | 866 (99.5%) | 868 (97.9%) |
| 55 to 64 Years | 1,029 (99.7%) | 1,182 (96.7%) |
| 65 to 74 Years | 863 (98.4%) | 902 (98.6%) |
| 75 Years and over | 630 (99.8%) | 645 (100.0%) |
| Total | 6,417 (98.6%) | 5,876 (96.7%) |
Income Below Poverty Among Married-Couple Families in Annapolis Neck
The poverty statistics for married-couple families in Annapolis Neck show that 0.4% or 12 of the total 3,379 families live below the poverty line. Families with no children have the highest poverty rate of 0.5%, comprising of 12 families. On the other hand, families with 1 or 2 children have the lowest poverty rate of 0.0%, which includes 0 families.
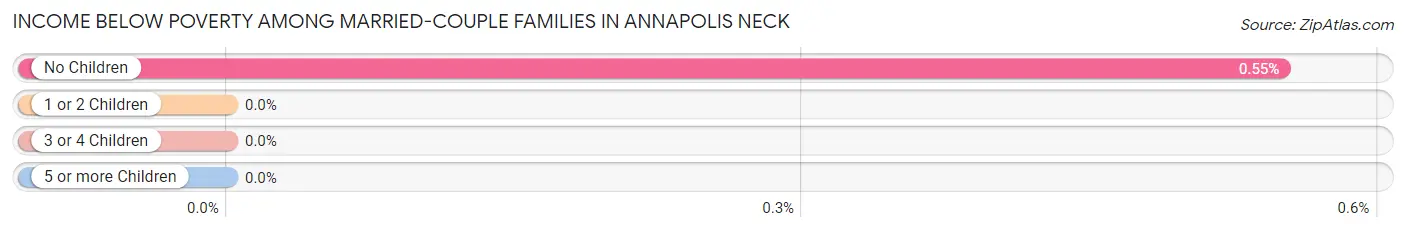
| Children | Above Poverty | Below Poverty |
| No Children | 2,171 (99.5%) | 12 (0.5%) |
| 1 or 2 Children | 1,019 (100.0%) | 0 (0.0%) |
| 3 or 4 Children | 165 (100.0%) | 0 (0.0%) |
| 5 or more Children | 12 (100.0%) | 0 (0.0%) |
| Total | 3,367 (99.6%) | 12 (0.4%) |
Income Below Poverty Among Single-Parent Households in Annapolis Neck
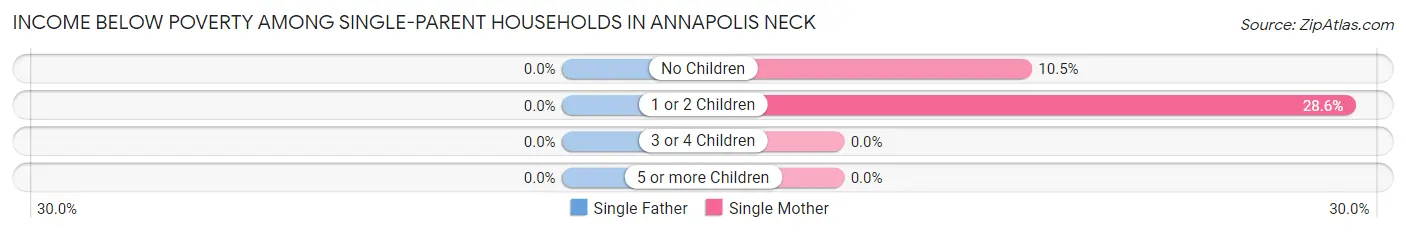
| Children | Single Father | Single Mother |
| No Children | 0 (0.0%) | 17 (10.5%) |
| 1 or 2 Children | 0 (0.0%) | 20 (28.6%) |
| 3 or 4 Children | 0 (0.0%) | 0 (0.0%) |
| 5 or more Children | 0 (0.0%) | 0 (0.0%) |
| Total | 0 (0.0%) | 37 (16.0%) |
Income Below Poverty Among Married-Couple vs Single-Parent Households in Annapolis Neck
The poverty data for Annapolis Neck shows that 12 of the married-couple family households (0.4%) and 37 of the single-parent households (11.6%) are living below the poverty level. Within the married-couple family households, those with no children have the highest poverty rate, with 12 households (0.5%) falling below the poverty line. Among the single-parent households, those with 1 or 2 children have the highest poverty rate, with 20 household (14.4%) living below poverty.
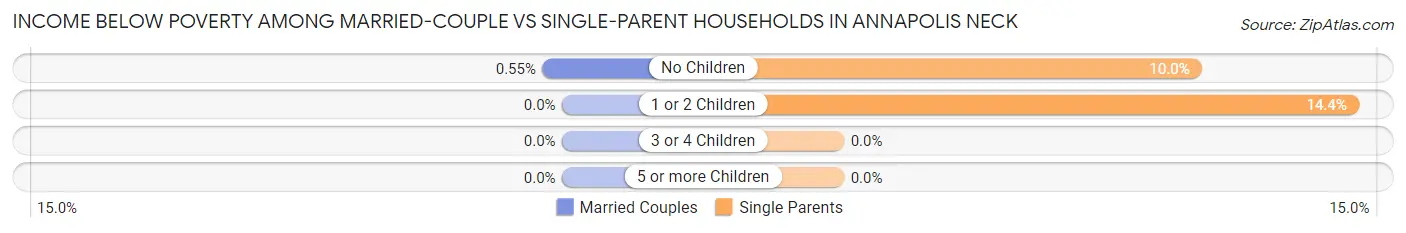
| Children | Married-Couple Families | Single-Parent Households |
| No Children | 12 (0.5%) | 17 (10.0%) |
| 1 or 2 Children | 0 (0.0%) | 20 (14.4%) |
| 3 or 4 Children | 0 (0.0%) | 0 (0.0%) |
| 5 or more Children | 0 (0.0%) | 0 (0.0%) |
| Total | 12 (0.4%) | 37 (11.6%) |
Race in Annapolis Neck
The most populous races in Annapolis Neck are White / Caucasian (11,038 | 86.8%), Black / African American (868 | 6.8%), and Two or more Races (412 | 3.2%).
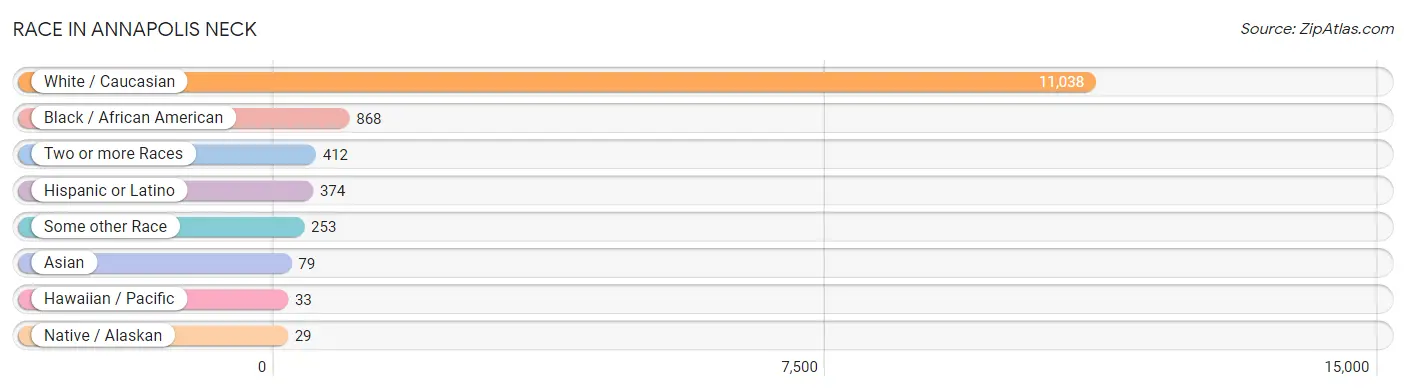
| Race | # Population | % Population |
| Asian | 79 | 0.6% |
| Black / African American | 868 | 6.8% |
| Hawaiian / Pacific | 33 | 0.3% |
| Hispanic or Latino | 374 | 2.9% |
| Native / Alaskan | 29 | 0.2% |
| White / Caucasian | 11,038 | 86.8% |
| Two or more Races | 412 | 3.2% |
| Some other Race | 253 | 2.0% |
| Total | 12,712 | 100.0% |
Ancestry in Annapolis Neck
The most populous ancestries reported in Annapolis Neck are German (2,728 | 21.5%), English (2,446 | 19.2%), Irish (2,248 | 17.7%), Polish (642 | 5.1%), and Italian (596 | 4.7%), together accounting for 68.1% of all Annapolis Neck residents.
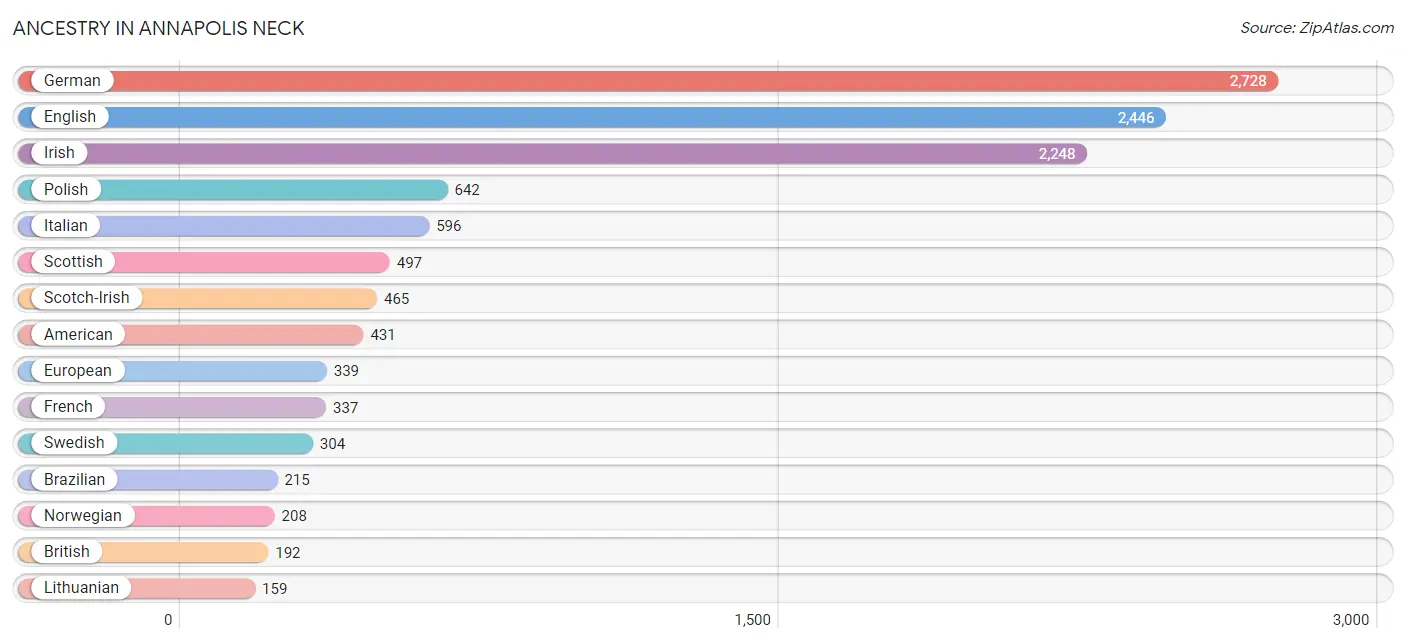
| Ancestry | # Population | % Population |
| African | 33 | 0.3% |
| American | 431 | 3.4% |
| Arab | 39 | 0.3% |
| Armenian | 21 | 0.2% |
| Austrian | 33 | 0.3% |
| Bahamian | 16 | 0.1% |
| Bhutanese | 37 | 0.3% |
| Brazilian | 215 | 1.7% |
| British | 192 | 1.5% |
| Burmese | 43 | 0.3% |
| Canadian | 15 | 0.1% |
| Central American | 10 | 0.1% |
| Chilean | 15 | 0.1% |
| Croatian | 54 | 0.4% |
| Cuban | 84 | 0.7% |
| Czech | 63 | 0.5% |
| Czechoslovakian | 26 | 0.2% |
| Danish | 66 | 0.5% |
| Dutch | 126 | 1.0% |
| Eastern European | 48 | 0.4% |
| Egyptian | 19 | 0.2% |
| English | 2,446 | 19.2% |
| European | 339 | 2.7% |
| Finnish | 66 | 0.5% |
| French | 337 | 2.6% |
| French Canadian | 36 | 0.3% |
| German | 2,728 | 21.5% |
| Greek | 37 | 0.3% |
| Honduran | 10 | 0.1% |
| Hungarian | 2 | 0.0% |
| Indian (Asian) | 24 | 0.2% |
| Iranian | 55 | 0.4% |
| Irish | 2,248 | 17.7% |
| Italian | 596 | 4.7% |
| Korean | 58 | 0.5% |
| Lithuanian | 159 | 1.3% |
| Mexican | 9 | 0.1% |
| Moroccan | 20 | 0.2% |
| Native Hawaiian | 3 | 0.0% |
| Nigerian | 11 | 0.1% |
| Northern European | 43 | 0.3% |
| Norwegian | 208 | 1.6% |
| Polish | 642 | 5.1% |
| Puerto Rican | 114 | 0.9% |
| Russian | 44 | 0.4% |
| Scandinavian | 49 | 0.4% |
| Scotch-Irish | 465 | 3.7% |
| Scottish | 497 | 3.9% |
| Slavic | 19 | 0.2% |
| Slovak | 24 | 0.2% |
| South American | 56 | 0.4% |
| Spaniard | 15 | 0.1% |
| Spanish | 44 | 0.4% |
| Sri Lankan | 2 | 0.0% |
| Subsaharan African | 44 | 0.4% |
| Swedish | 304 | 2.4% |
| Swiss | 54 | 0.4% |
| Turkish | 45 | 0.4% |
| Ukrainian | 46 | 0.4% |
| Venezuelan | 41 | 0.3% |
| Welsh | 111 | 0.9% | View All 61 Rows |
Immigrants in Annapolis Neck
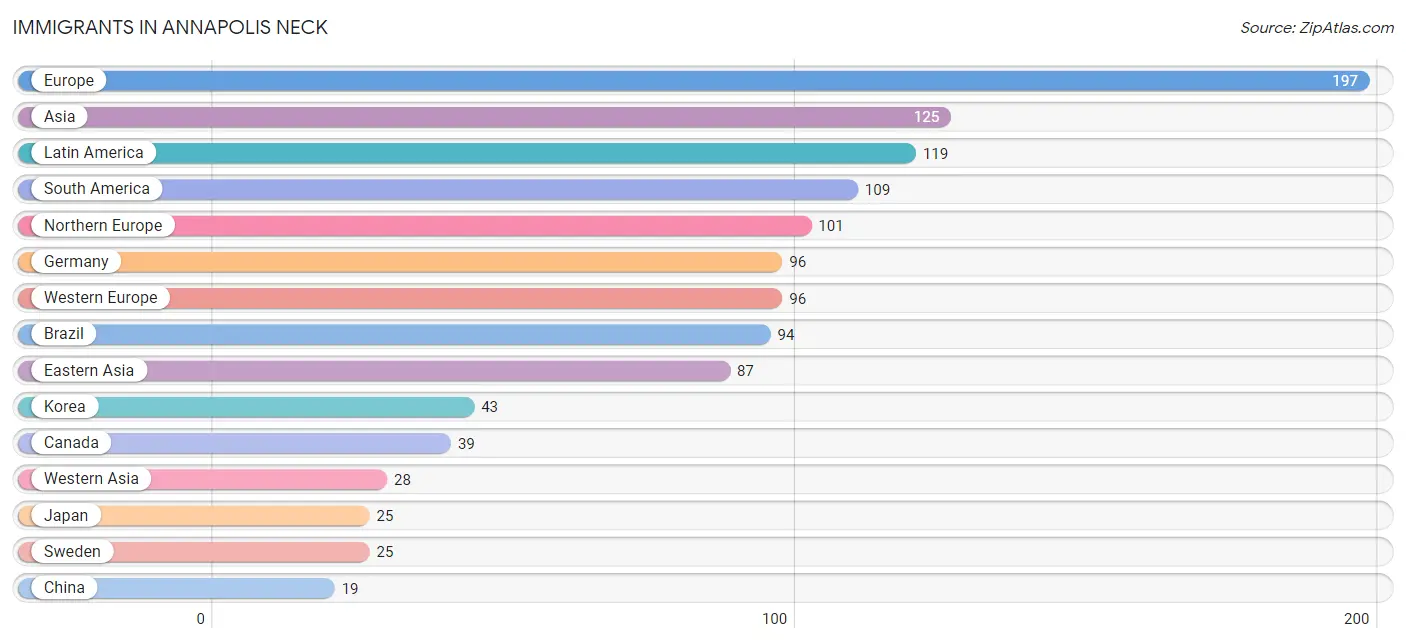
The most numerous immigrant groups reported in Annapolis Neck came from Europe (197 | 1.5%), Asia (125 | 1.0%), Latin America (119 | 0.9%), South America (109 | 0.9%), and Northern Europe (101 | 0.8%), together accounting for 5.1% of all Annapolis Neck residents.
| Immigration Origin | # Population | % Population |
| Asia | 125 | 1.0% |
| Brazil | 94 | 0.7% |
| Canada | 39 | 0.3% |
| Central America | 10 | 0.1% |
| Chile | 15 | 0.1% |
| China | 19 | 0.2% |
| Eastern Asia | 87 | 0.7% |
| England | 17 | 0.1% |
| Europe | 197 | 1.5% |
| Germany | 96 | 0.8% |
| Honduras | 10 | 0.1% |
| Ireland | 17 | 0.1% |
| Japan | 25 | 0.2% |
| Jordan | 14 | 0.1% |
| Korea | 43 | 0.3% |
| Latin America | 119 | 0.9% |
| Northern Europe | 101 | 0.8% |
| Philippines | 10 | 0.1% |
| South America | 109 | 0.9% |
| South Eastern Asia | 10 | 0.1% |
| Sweden | 25 | 0.2% |
| Taiwan | 19 | 0.2% |
| Turkey | 14 | 0.1% |
| Western Asia | 28 | 0.2% |
| Western Europe | 96 | 0.8% | View All 25 Rows |
Sex and Age in Annapolis Neck
Sex and Age in Annapolis Neck
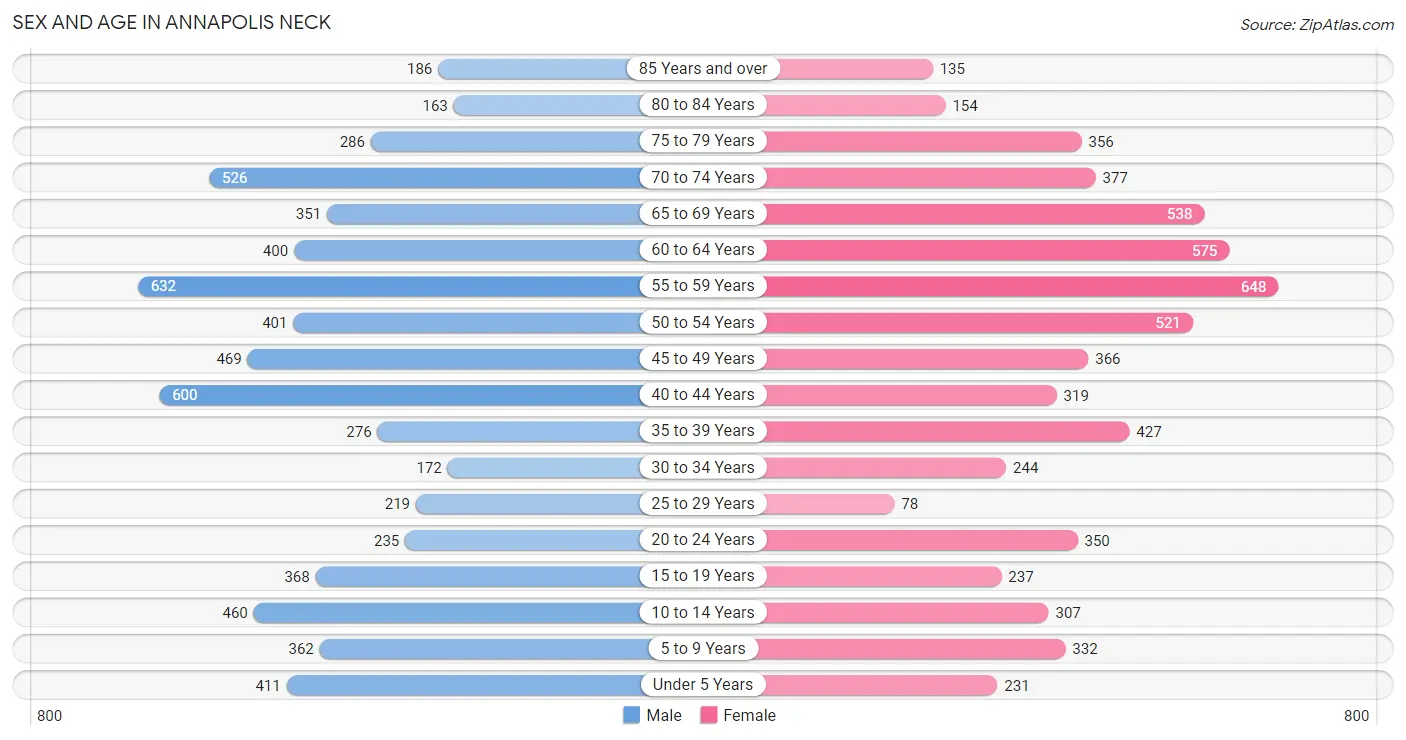
The most populous age groups in Annapolis Neck are 55 to 59 Years (632 | 9.7%) for men and 55 to 59 Years (648 | 10.5%) for women.
| Age Bracket | Male | Female |
| Under 5 Years | 411 (6.3%) | 231 (3.7%) |
| 5 to 9 Years | 362 (5.6%) | 332 (5.4%) |
| 10 to 14 Years | 460 (7.1%) | 307 (5.0%) |
| 15 to 19 Years | 368 (5.7%) | 237 (3.8%) |
| 20 to 24 Years | 235 (3.6%) | 350 (5.7%) |
| 25 to 29 Years | 219 (3.4%) | 78 (1.3%) |
| 30 to 34 Years | 172 (2.6%) | 244 (3.9%) |
| 35 to 39 Years | 276 (4.2%) | 427 (6.9%) |
| 40 to 44 Years | 600 (9.2%) | 319 (5.1%) |
| 45 to 49 Years | 469 (7.2%) | 366 (5.9%) |
| 50 to 54 Years | 401 (6.1%) | 521 (8.4%) |
| 55 to 59 Years | 632 (9.7%) | 648 (10.5%) |
| 60 to 64 Years | 400 (6.1%) | 575 (9.3%) |
| 65 to 69 Years | 351 (5.4%) | 538 (8.7%) |
| 70 to 74 Years | 526 (8.1%) | 377 (6.1%) |
| 75 to 79 Years | 286 (4.4%) | 356 (5.8%) |
| 80 to 84 Years | 163 (2.5%) | 154 (2.5%) |
| 85 Years and over | 186 (2.9%) | 135 (2.2%) |
| Total | 6,517 (100.0%) | 6,195 (100.0%) |
Families and Households in Annapolis Neck
Median Family Size in Annapolis Neck
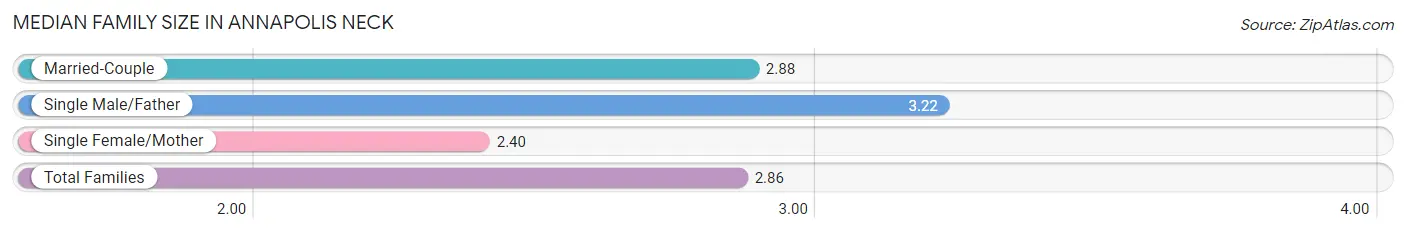
The median family size in Annapolis Neck is 2.86 persons per family, with single male/father families (86 | 2.3%) accounting for the largest median family size of 3.22 persons per family. On the other hand, single female/mother families (232 | 6.3%) represent the smallest median family size with 2.40 persons per family.
| Family Type | # Families | Family Size |
| Married-Couple | 3,379 (91.4%) | 2.88 |
| Single Male/Father | 86 (2.3%) | 3.22 |
| Single Female/Mother | 232 (6.3%) | 2.40 |
| Total Families | 3,697 (100.0%) | 2.86 |
Median Household Size in Annapolis Neck
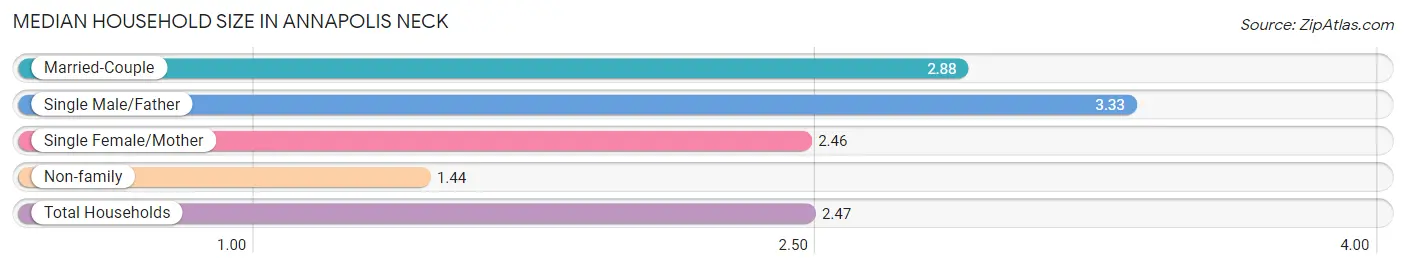
The median household size in Annapolis Neck is 2.47 persons per household, with single male/father households (86 | 1.7%) accounting for the largest median household size of 3.33 persons per household. non-family households (1,429 | 27.9%) represent the smallest median household size with 1.44 persons per household.
| Household Type | # Households | Household Size |
| Married-Couple | 3,379 (65.9%) | 2.88 |
| Single Male/Father | 86 (1.7%) | 3.33 |
| Single Female/Mother | 232 (4.5%) | 2.46 |
| Non-family | 1,429 (27.9%) | 1.44 |
| Total Households | 5,126 (100.0%) | 2.47 |
Household Size by Marriage Status in Annapolis Neck
Out of a total of 5,126 households in Annapolis Neck, 3,697 (72.1%) are family households, while 1,429 (27.9%) are nonfamily households. The most numerous type of family households are 2-person households, comprising 2,055, and the most common type of nonfamily households are 1-person households, comprising 1,177.
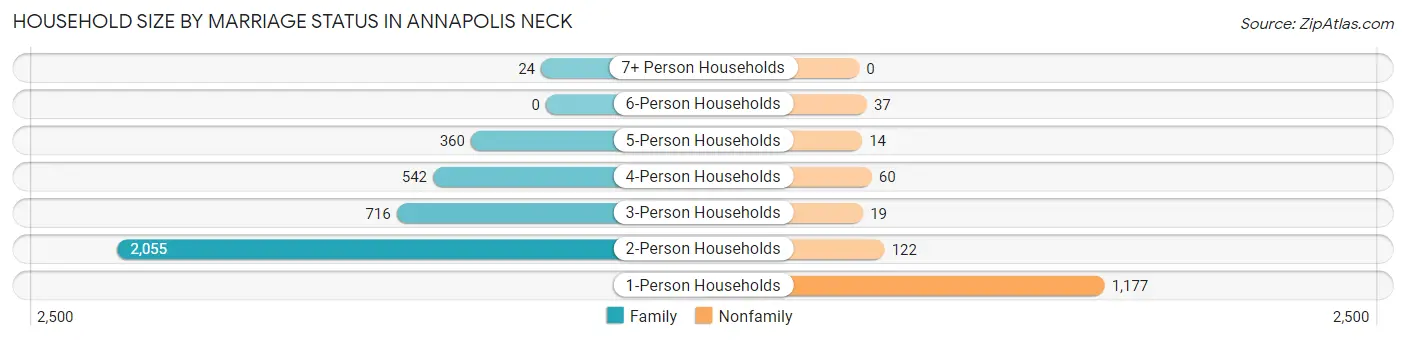
| Household Size | Family Households | Nonfamily Households |
| 1-Person Households | - | 1,177 (23.0%) |
| 2-Person Households | 2,055 (40.1%) | 122 (2.4%) |
| 3-Person Households | 716 (14.0%) | 19 (0.4%) |
| 4-Person Households | 542 (10.6%) | 60 (1.2%) |
| 5-Person Households | 360 (7.0%) | 14 (0.3%) |
| 6-Person Households | 0 (0.0%) | 37 (0.7%) |
| 7+ Person Households | 24 (0.5%) | 0 (0.0%) |
| Total | 3,697 (72.1%) | 1,429 (27.9%) |
Female Fertility in Annapolis Neck
Fertility by Age in Annapolis Neck
Average fertility rate in Annapolis Neck is 46.0 births per 1,000 women. Women in the age bracket of 20 to 34 years have the highest fertility rate with 103.0 births per 1,000 women. Women in the age bracket of 20 to 34 years acount for 72.6% of all women with births.
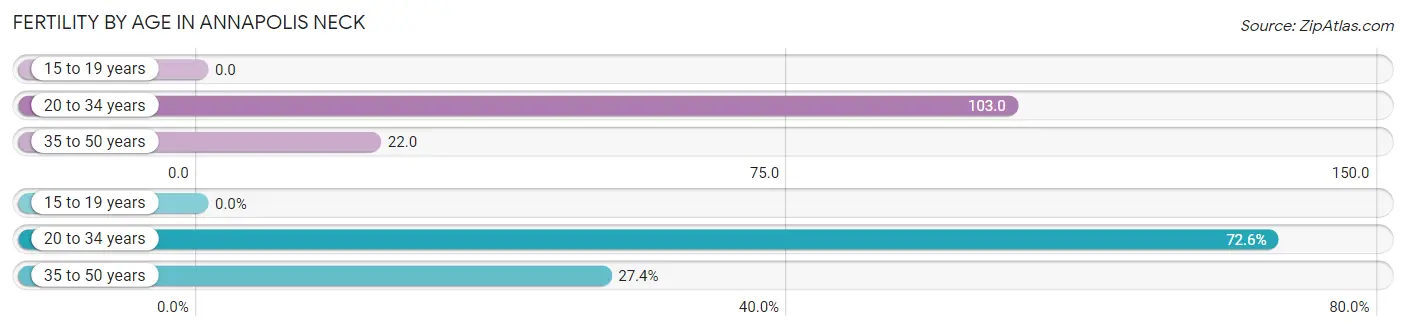
| Age Bracket | Women with Births | Births / 1,000 Women |
| 15 to 19 years | 0 (0.0%) | 0.0 |
| 20 to 34 years | 69 (72.6%) | 103.0 |
| 35 to 50 years | 26 (27.4%) | 22.0 |
| Total | 95 (100.0%) | 46.0 |
Fertility by Age by Marriage Status in Annapolis Neck
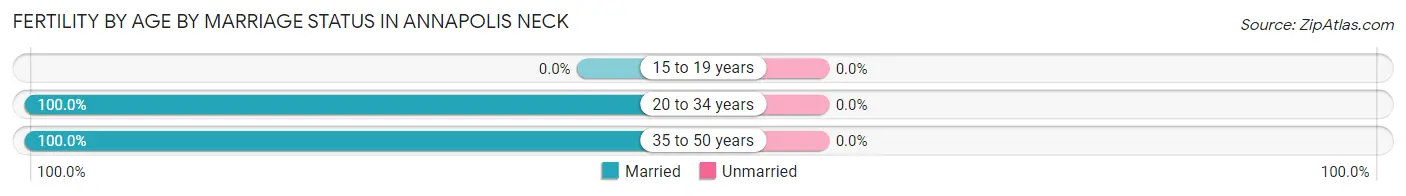
| Age Bracket | Married | Unmarried |
| 15 to 19 years | 0 (0.0%) | 0 (0.0%) |
| 20 to 34 years | 69 (100.0%) | 0 (0.0%) |
| 35 to 50 years | 26 (100.0%) | 0 (0.0%) |
| Total | 95 (100.0%) | 0 (0.0%) |
Fertility by Education in Annapolis Neck
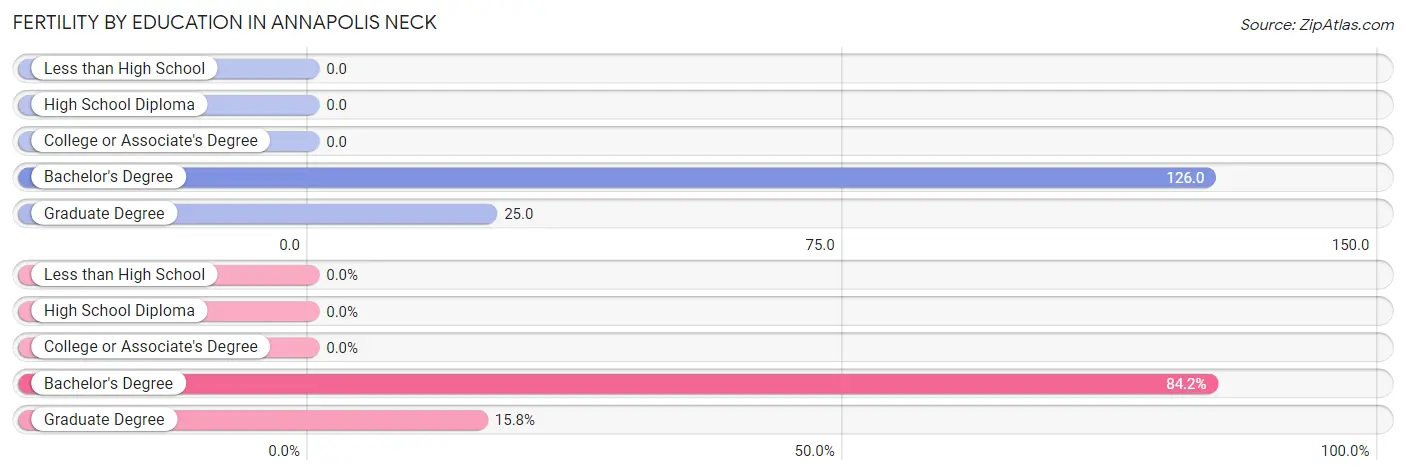
| Educational Attainment | Women with Births | Births / 1,000 Women |
| Less than High School | 0 (0.0%) | 0.0 |
| High School Diploma | 0 (0.0%) | 0.0 |
| College or Associate's Degree | 0 (0.0%) | 0.0 |
| Bachelor's Degree | 80 (84.2%) | 126.0 |
| Graduate Degree | 15 (15.8%) | 25.0 |
| Total | 95 (100.0%) | 46.0 |
Fertility by Education by Marriage Status in Annapolis Neck
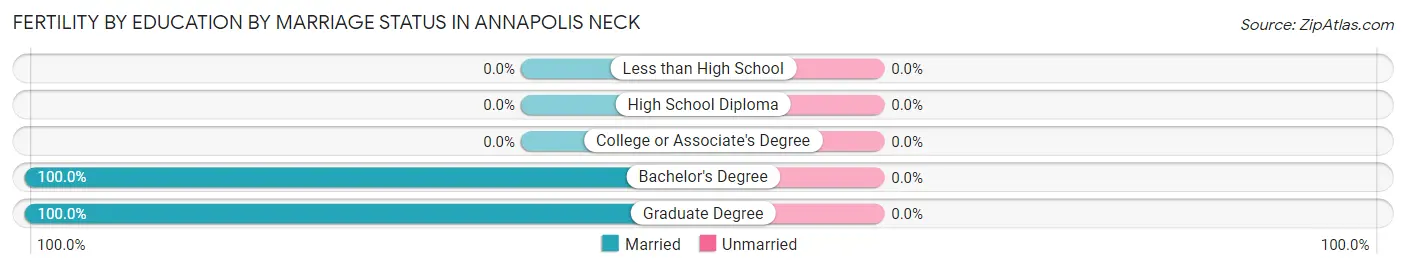
| Educational Attainment | Married | Unmarried |
| Less than High School | 0 (0.0%) | 0 (0.0%) |
| High School Diploma | 0 (0.0%) | 0 (0.0%) |
| College or Associate's Degree | 0 (0.0%) | 0 (0.0%) |
| Bachelor's Degree | 80 (100.0%) | 0 (0.0%) |
| Graduate Degree | 15 (100.0%) | 0 (0.0%) |
| Total | 95 (100.0%) | 0 (0.0%) |
Employment Characteristics in Annapolis Neck
Employment by Class of Employer in Annapolis Neck
Among the 6,375 employed individuals in Annapolis Neck, private company employees (3,498 | 54.9%), self-employed (not incorporated) (598 | 9.4%), and federal government employees (563 | 8.8%) make up the most common classes of employment.
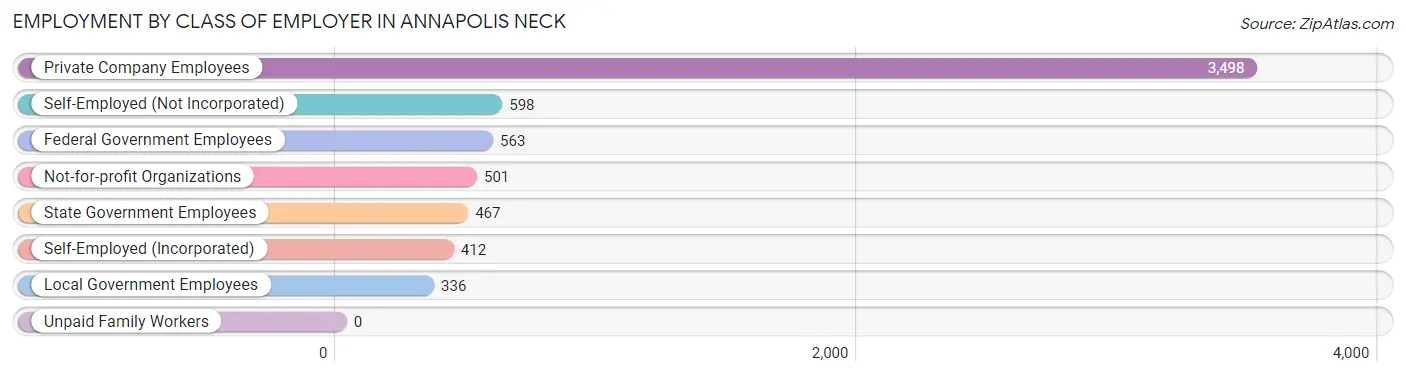
| Employer Class | # Employees | % Employees |
| Private Company Employees | 3,498 | 54.9% |
| Self-Employed (Incorporated) | 412 | 6.5% |
| Self-Employed (Not Incorporated) | 598 | 9.4% |
| Not-for-profit Organizations | 501 | 7.9% |
| Local Government Employees | 336 | 5.3% |
| State Government Employees | 467 | 7.3% |
| Federal Government Employees | 563 | 8.8% |
| Unpaid Family Workers | 0 | 0.0% |
| Total | 6,375 | 100.0% |
Employment Status by Age in Annapolis Neck
According to the labor force statistics for Annapolis Neck, out of the total population over 16 years of age (10,459), 63.1% or 6,600 individuals are in the labor force, with 1.9% or 125 of them unemployed. The age group with the highest labor force participation rate is 25 to 29 years, with 92.9% or 276 individuals in the labor force. Within the labor force, the 16 to 19 years age range has the highest percentage of unemployed individuals, with 10.4% or 18 of them being unemployed.
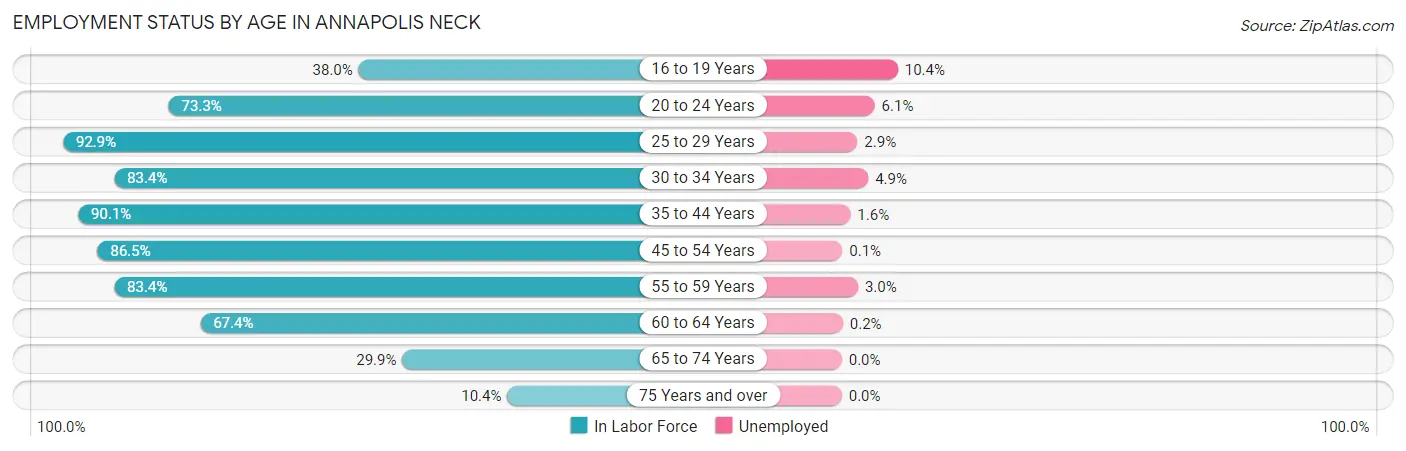
| Age Bracket | In Labor Force | Unemployed |
| 16 to 19 Years | 173 (38.0%) | 18 (10.4%) |
| 20 to 24 Years | 429 (73.3%) | 26 (6.1%) |
| 25 to 29 Years | 276 (92.9%) | 8 (2.9%) |
| 30 to 34 Years | 347 (83.4%) | 17 (4.9%) |
| 35 to 44 Years | 1,461 (90.1%) | 23 (1.6%) |
| 45 to 54 Years | 1,520 (86.5%) | 2 (0.1%) |
| 55 to 59 Years | 1,068 (83.4%) | 32 (3.0%) |
| 60 to 64 Years | 657 (67.4%) | 1 (0.2%) |
| 65 to 74 Years | 536 (29.9%) | 0 (0.0%) |
| 75 Years and over | 133 (10.4%) | 0 (0.0%) |
| Total | 6,600 (63.1%) | 125 (1.9%) |
Employment Status by Educational Attainment in Annapolis Neck
According to labor force statistics for Annapolis Neck, 83.9% of individuals (5,325) out of the total population between 25 and 64 years of age (6,347) are in the labor force, with 1.6% or 85 of them being unemployed. The group with the highest labor force participation rate are those with the educational attainment of bachelor's degree or higher, with 88.5% or 4,168 individuals in the labor force. Within the labor force, individuals with high school diploma education have the highest percentage of unemployment, with 6.4% or 25 of them being unemployed.

| Educational Attainment | In Labor Force | Unemployed |
| Less than High School | 62 (86.1%) | 2 (3.2%) |
| High School Diploma | 393 (68.6%) | 37 (6.4%) |
| College / Associate Degree | 704 (71.0%) | 27 (2.7%) |
| Bachelor's Degree or higher | 4,168 (88.5%) | 42 (0.9%) |
| Total | 5,325 (83.9%) | 102 (1.6%) |
Employment Occupations by Sex in Annapolis Neck
Management, Business, Science and Arts Occupations
The most common Management, Business, Science and Arts occupations in Annapolis Neck are Community & Social Service (1,502 | 23.4%), Management (1,022 | 15.9%), Education Instruction & Library (883 | 13.8%), Computers, Engineering & Science (706 | 11.0%), and Business & Financial (458 | 7.1%).
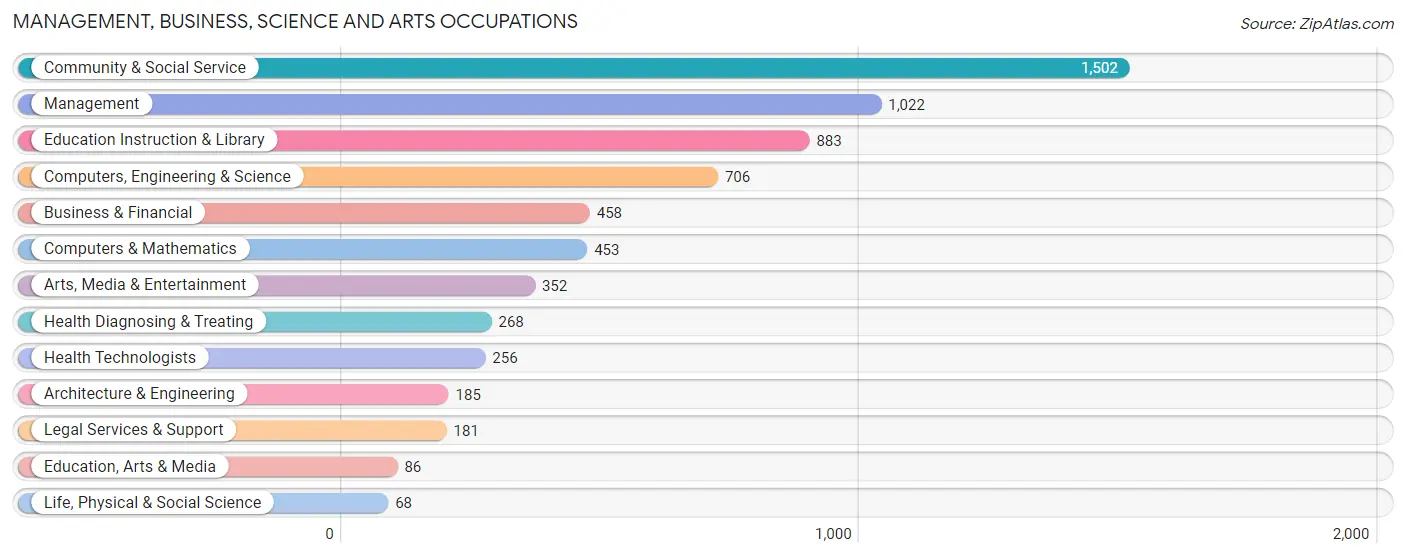
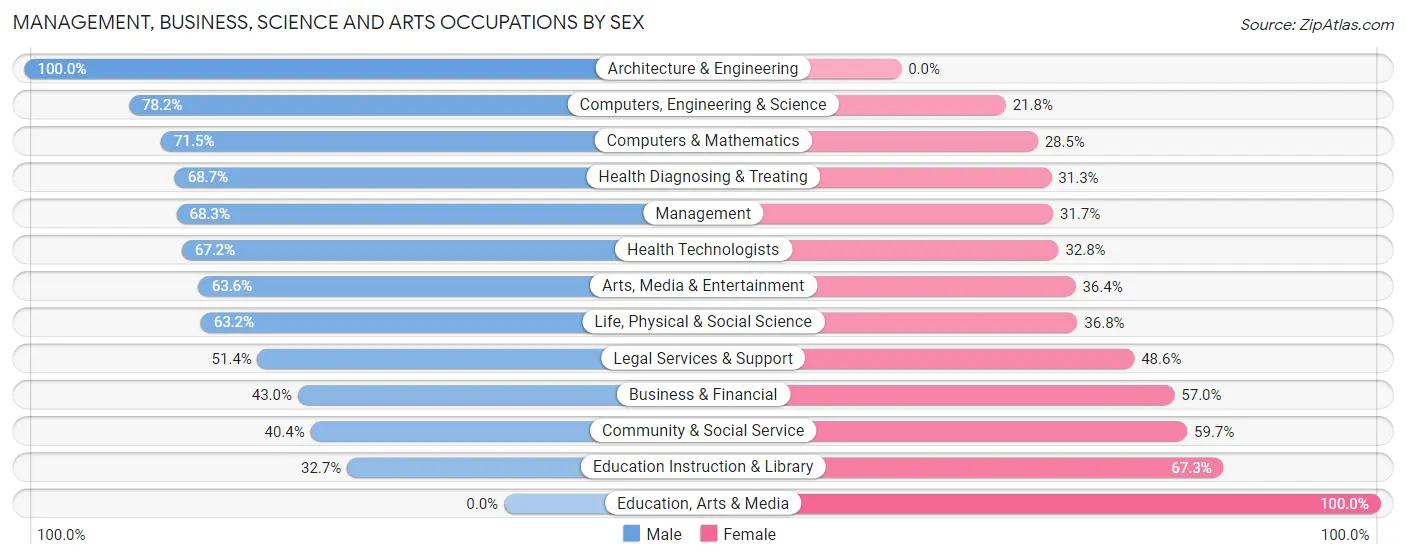
Management, Business, Science and Arts Occupations by Sex
Within the Management, Business, Science and Arts occupations in Annapolis Neck, the most male-oriented occupations are Architecture & Engineering (100.0%), Computers, Engineering & Science (78.2%), and Computers & Mathematics (71.5%), while the most female-oriented occupations are Education, Arts & Media (100.0%), Education Instruction & Library (67.3%), and Community & Social Service (59.7%).
| Occupation | Male | Female |
| Management | 698 (68.3%) | 324 (31.7%) |
| Business & Financial | 197 (43.0%) | 261 (57.0%) |
| Computers, Engineering & Science | 552 (78.2%) | 154 (21.8%) |
| Computers & Mathematics | 324 (71.5%) | 129 (28.5%) |
| Architecture & Engineering | 185 (100.0%) | 0 (0.0%) |
| Life, Physical & Social Science | 43 (63.2%) | 25 (36.8%) |
| Community & Social Service | 606 (40.4%) | 896 (59.7%) |
| Education, Arts & Media | 0 (0.0%) | 86 (100.0%) |
| Legal Services & Support | 93 (51.4%) | 88 (48.6%) |
| Education Instruction & Library | 289 (32.7%) | 594 (67.3%) |
| Arts, Media & Entertainment | 224 (63.6%) | 128 (36.4%) |
| Health Diagnosing & Treating | 184 (68.7%) | 84 (31.3%) |
| Health Technologists | 172 (67.2%) | 84 (32.8%) |
| Total (Category) | 2,237 (56.6%) | 1,719 (43.4%) |
| Total (Overall) | 3,621 (56.5%) | 2,791 (43.5%) |
Services Occupations
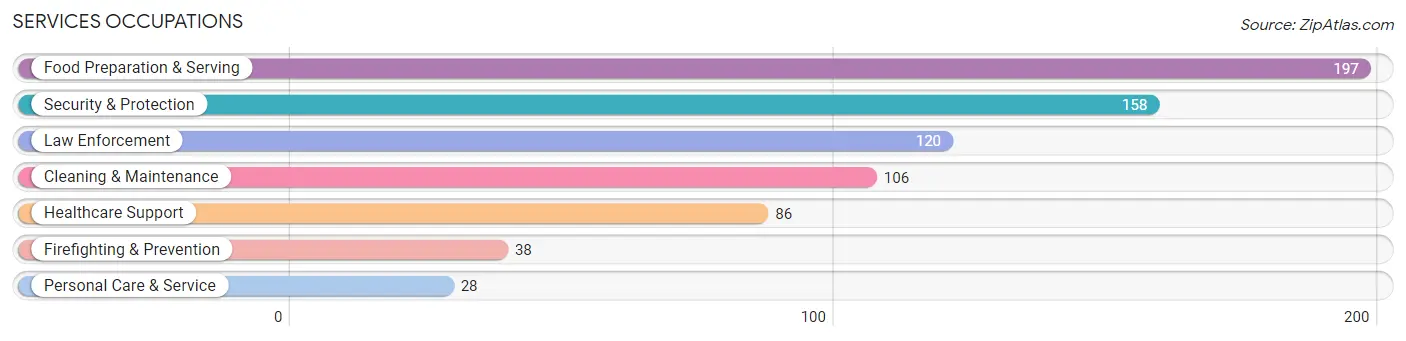
The most common Services occupations in Annapolis Neck are Food Preparation & Serving (197 | 3.1%), Security & Protection (158 | 2.5%), Law Enforcement (120 | 1.9%), Cleaning & Maintenance (106 | 1.7%), and Healthcare Support (86 | 1.3%).
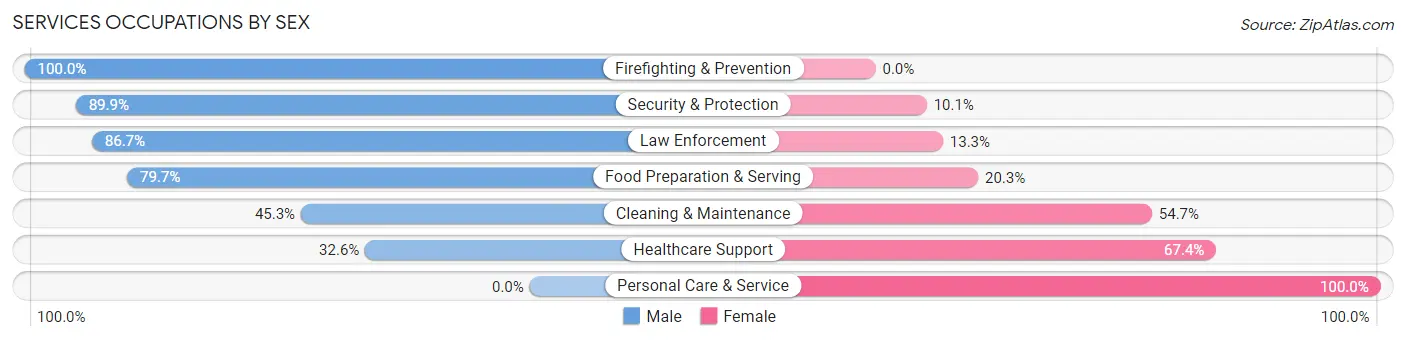
Services Occupations by Sex
Within the Services occupations in Annapolis Neck, the most male-oriented occupations are Firefighting & Prevention (100.0%), Security & Protection (89.9%), and Law Enforcement (86.7%), while the most female-oriented occupations are Personal Care & Service (100.0%), Healthcare Support (67.4%), and Cleaning & Maintenance (54.7%).
| Occupation | Male | Female |
| Healthcare Support | 28 (32.6%) | 58 (67.4%) |
| Security & Protection | 142 (89.9%) | 16 (10.1%) |
| Firefighting & Prevention | 38 (100.0%) | 0 (0.0%) |
| Law Enforcement | 104 (86.7%) | 16 (13.3%) |
| Food Preparation & Serving | 157 (79.7%) | 40 (20.3%) |
| Cleaning & Maintenance | 48 (45.3%) | 58 (54.7%) |
| Personal Care & Service | 0 (0.0%) | 28 (100.0%) |
| Total (Category) | 375 (65.2%) | 200 (34.8%) |
| Total (Overall) | 3,621 (56.5%) | 2,791 (43.5%) |
Sales and Office Occupations
The most common Sales and Office occupations in Annapolis Neck are Sales & Related (944 | 14.7%), and Office & Administration (456 | 7.1%).

Sales and Office Occupations by Sex

| Occupation | Male | Female |
| Sales & Related | 509 (53.9%) | 435 (46.1%) |
| Office & Administration | 143 (31.4%) | 313 (68.6%) |
| Total (Category) | 652 (46.6%) | 748 (53.4%) |
| Total (Overall) | 3,621 (56.5%) | 2,791 (43.5%) |
Natural Resources, Construction and Maintenance Occupations
The most common Natural Resources, Construction and Maintenance occupations in Annapolis Neck are Farming, Fishing & Forestry (42 | 0.7%), Construction & Extraction (42 | 0.7%), and Installation, Maintenance & Repair (34 | 0.5%).

Natural Resources, Construction and Maintenance Occupations by Sex

| Occupation | Male | Female |
| Farming, Fishing & Forestry | 42 (100.0%) | 0 (0.0%) |
| Construction & Extraction | 42 (100.0%) | 0 (0.0%) |
| Installation, Maintenance & Repair | 34 (100.0%) | 0 (0.0%) |
| Total (Category) | 118 (100.0%) | 0 (0.0%) |
| Total (Overall) | 3,621 (56.5%) | 2,791 (43.5%) |
Production, Transportation and Moving Occupations
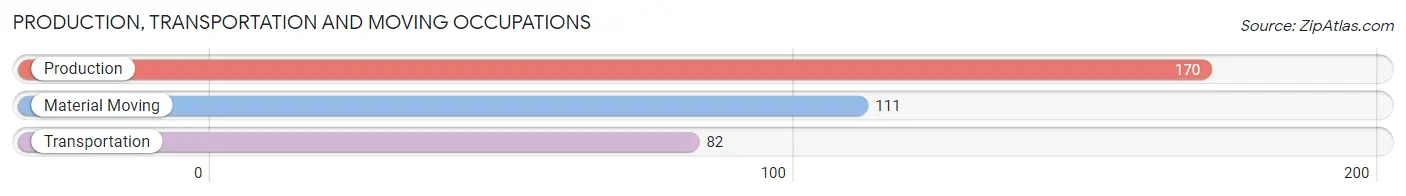
The most common Production, Transportation and Moving occupations in Annapolis Neck are Production (170 | 2.6%), Material Moving (111 | 1.7%), and Transportation (82 | 1.3%).
Production, Transportation and Moving Occupations by Sex

| Occupation | Male | Female |
| Production | 113 (66.5%) | 57 (33.5%) |
| Transportation | 67 (81.7%) | 15 (18.3%) |
| Material Moving | 59 (53.1%) | 52 (46.9%) |
| Total (Category) | 239 (65.8%) | 124 (34.2%) |
| Total (Overall) | 3,621 (56.5%) | 2,791 (43.5%) |
Employment Industries by Sex in Annapolis Neck
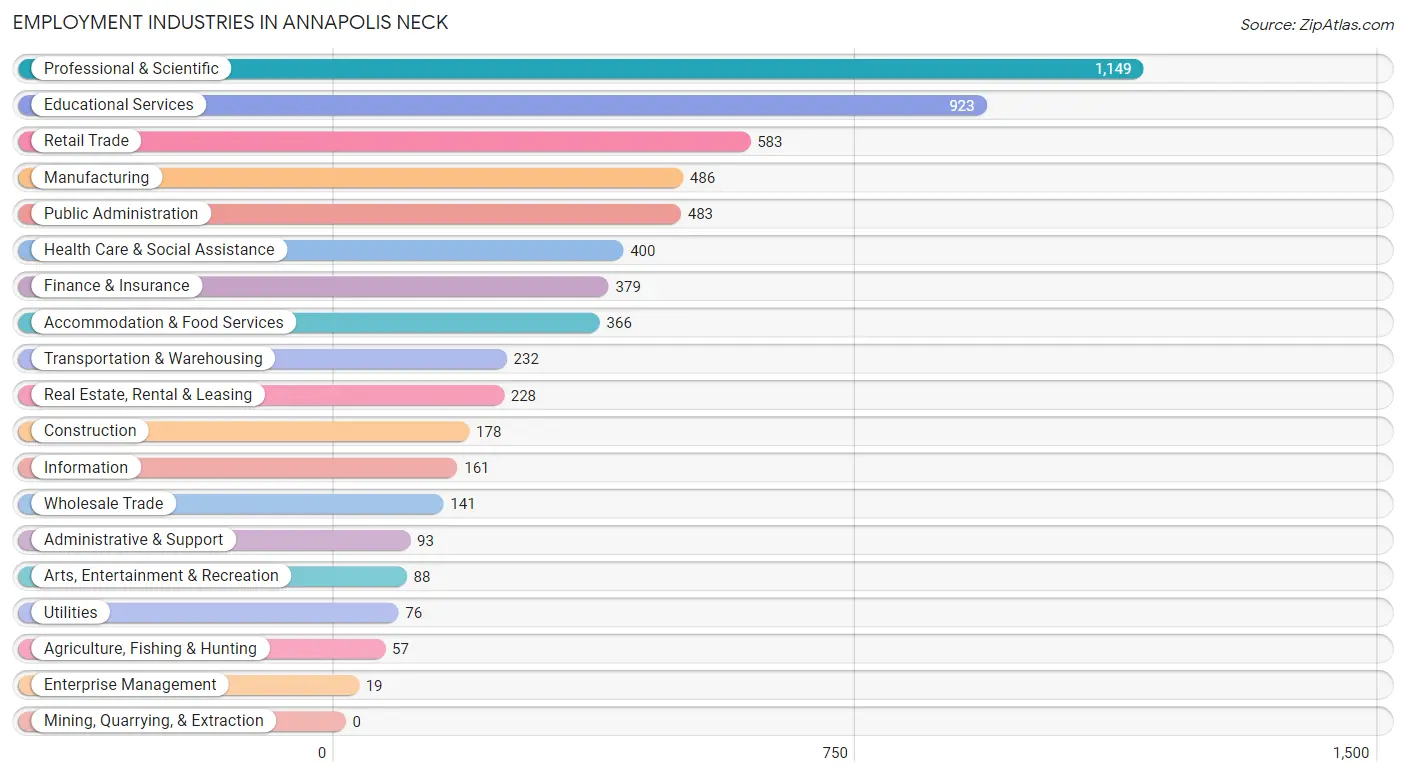
Employment Industries in Annapolis Neck
The major employment industries in Annapolis Neck include Professional & Scientific (1,149 | 17.9%), Educational Services (923 | 14.4%), Retail Trade (583 | 9.1%), Manufacturing (486 | 7.6%), and Public Administration (483 | 7.5%).
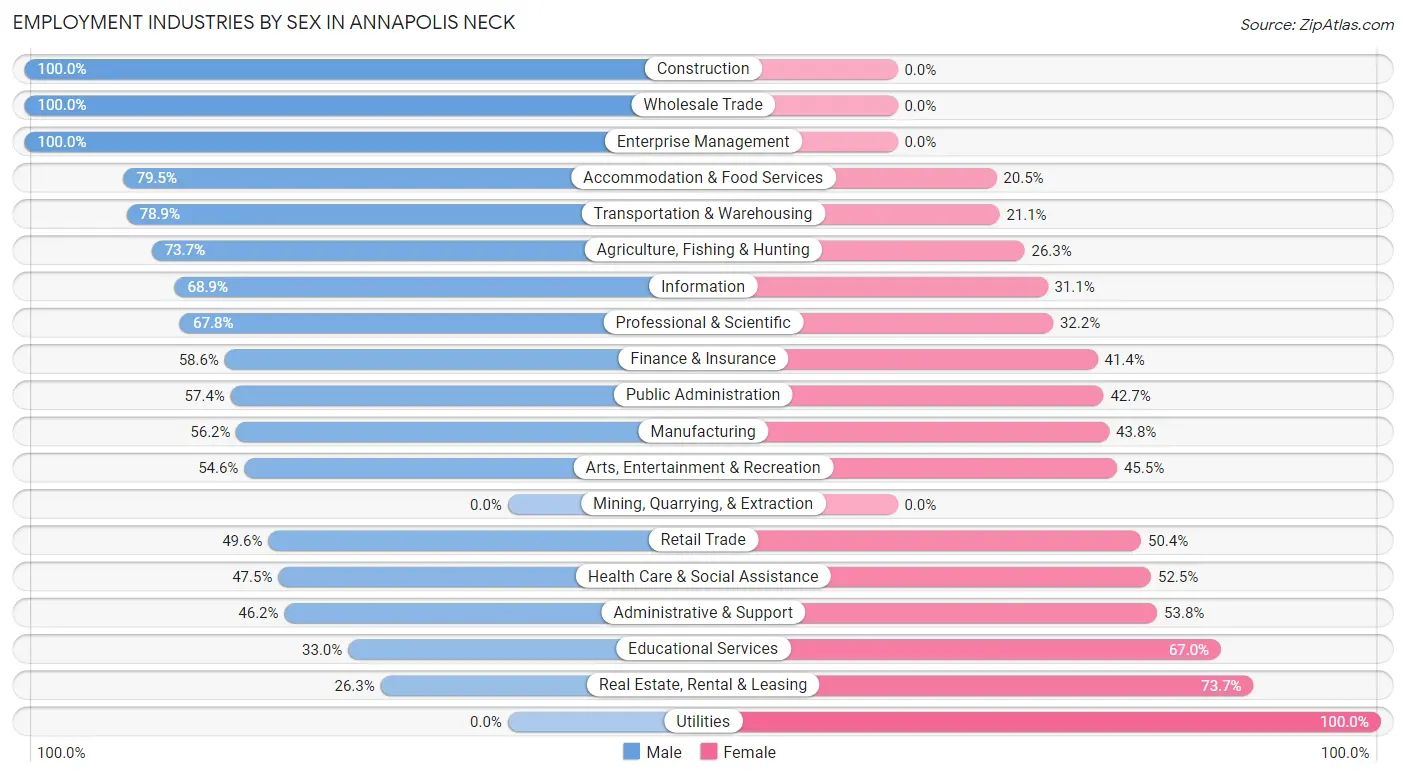
Employment Industries by Sex in Annapolis Neck
The Annapolis Neck industries that see more men than women are Construction (100.0%), Wholesale Trade (100.0%), and Enterprise Management (100.0%), whereas the industries that tend to have a higher number of women are Utilities (100.0%), Real Estate, Rental & Leasing (73.7%), and Educational Services (67.0%).
| Industry | Male | Female |
| Agriculture, Fishing & Hunting | 42 (73.7%) | 15 (26.3%) |
| Mining, Quarrying, & Extraction | 0 (0.0%) | 0 (0.0%) |
| Construction | 178 (100.0%) | 0 (0.0%) |
| Manufacturing | 273 (56.2%) | 213 (43.8%) |
| Wholesale Trade | 141 (100.0%) | 0 (0.0%) |
| Retail Trade | 289 (49.6%) | 294 (50.4%) |
| Transportation & Warehousing | 183 (78.9%) | 49 (21.1%) |
| Utilities | 0 (0.0%) | 76 (100.0%) |
| Information | 111 (68.9%) | 50 (31.1%) |
| Finance & Insurance | 222 (58.6%) | 157 (41.4%) |
| Real Estate, Rental & Leasing | 60 (26.3%) | 168 (73.7%) |
| Professional & Scientific | 779 (67.8%) | 370 (32.2%) |
| Enterprise Management | 19 (100.0%) | 0 (0.0%) |
| Administrative & Support | 43 (46.2%) | 50 (53.8%) |
| Educational Services | 305 (33.0%) | 618 (67.0%) |
| Health Care & Social Assistance | 190 (47.5%) | 210 (52.5%) |
| Arts, Entertainment & Recreation | 48 (54.5%) | 40 (45.5%) |
| Accommodation & Food Services | 291 (79.5%) | 75 (20.5%) |
| Public Administration | 277 (57.4%) | 206 (42.6%) |
| Total | 3,621 (56.5%) | 2,791 (43.5%) |
Education in Annapolis Neck
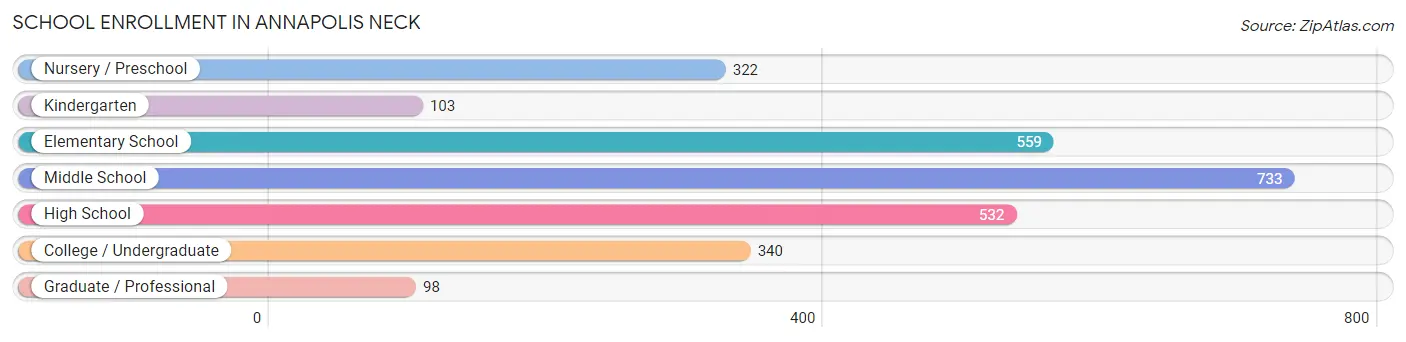
School Enrollment in Annapolis Neck
The most common levels of schooling among the 2,687 students in Annapolis Neck are middle school (733 | 27.3%), elementary school (559 | 20.8%), and high school (532 | 19.8%).
| School Level | # Students | % Students |
| Nursery / Preschool | 322 | 12.0% |
| Kindergarten | 103 | 3.8% |
| Elementary School | 559 | 20.8% |
| Middle School | 733 | 27.3% |
| High School | 532 | 19.8% |
| College / Undergraduate | 340 | 12.7% |
| Graduate / Professional | 98 | 3.6% |
| Total | 2,687 | 100.0% |
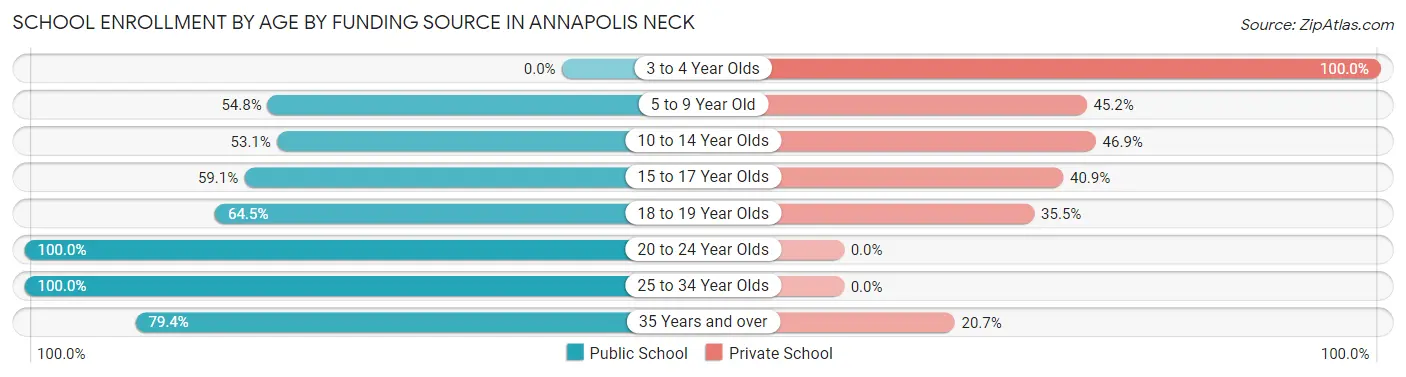
School Enrollment by Age by Funding Source in Annapolis Neck
Out of a total of 2,687 students who are enrolled in schools in Annapolis Neck, 1,212 (45.1%) attend a private institution, while the remaining 1,475 (54.9%) are enrolled in public schools. The age group of 3 to 4 year olds has the highest likelihood of being enrolled in private schools, with 256 (100.0% in the age bracket) enrolled. Conversely, the age group of 20 to 24 year olds has the lowest likelihood of being enrolled in a private school, with 100 (100.0% in the age bracket) attending a public institution.
| Age Bracket | Public School | Private School |
| 3 to 4 Year Olds | 0 (0.0%) | 256 (100.0%) |
| 5 to 9 Year Old | 380 (54.8%) | 314 (45.2%) |
| 10 to 14 Year Olds | 407 (53.1%) | 360 (46.9%) |
| 15 to 17 Year Olds | 288 (59.1%) | 199 (40.9%) |
| 18 to 19 Year Olds | 60 (64.5%) | 33 (35.5%) |
| 20 to 24 Year Olds | 100 (100.0%) | 0 (0.0%) |
| 25 to 34 Year Olds | 43 (100.0%) | 0 (0.0%) |
| 35 Years and over | 196 (79.3%) | 51 (20.6%) |
| Total | 1,475 (54.9%) | 1,212 (45.1%) |
Educational Attainment by Field of Study in Annapolis Neck
Business (1,168 | 15.8%), social sciences (995 | 13.5%), bio, nature & agricultural (707 | 9.6%), education (669 | 9.1%), and liberal arts & history (613 | 8.3%) are the most common fields of study among 7,375 individuals in Annapolis Neck who have obtained a bachelor's degree or higher.
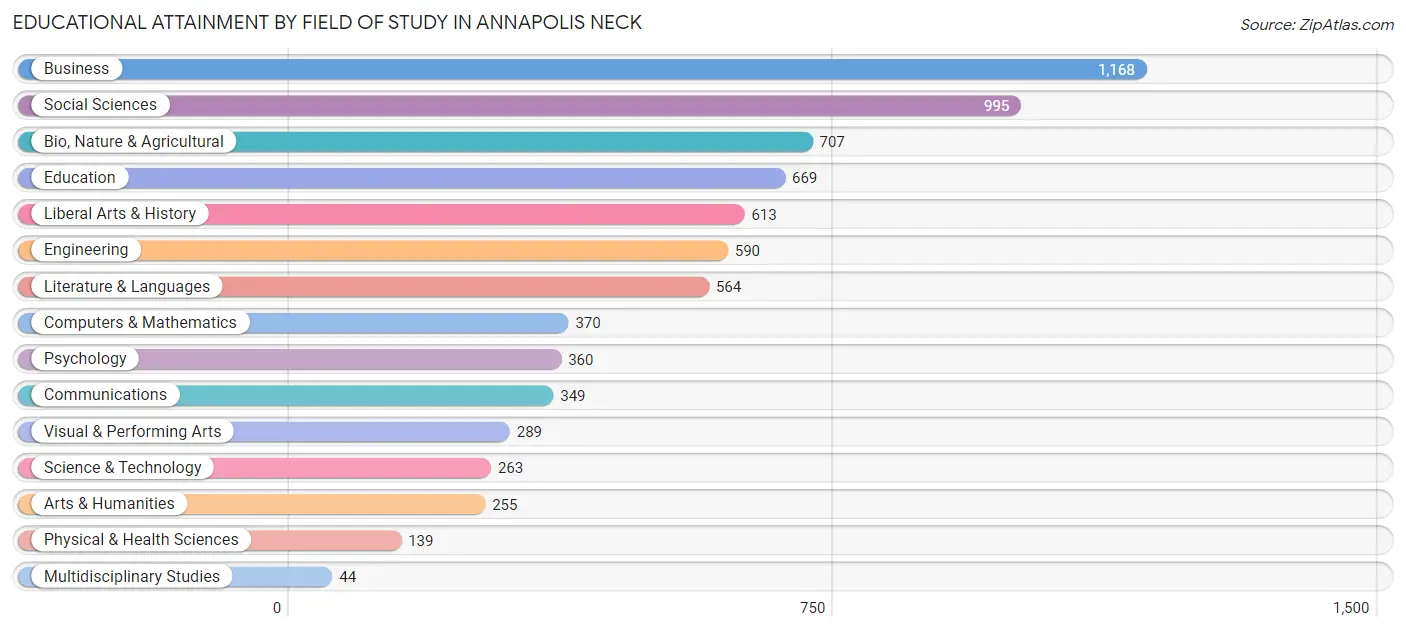
| Field of Study | # Graduates | % Graduates |
| Computers & Mathematics | 370 | 5.0% |
| Bio, Nature & Agricultural | 707 | 9.6% |
| Physical & Health Sciences | 139 | 1.9% |
| Psychology | 360 | 4.9% |
| Social Sciences | 995 | 13.5% |
| Engineering | 590 | 8.0% |
| Multidisciplinary Studies | 44 | 0.6% |
| Science & Technology | 263 | 3.6% |
| Business | 1,168 | 15.8% |
| Education | 669 | 9.1% |
| Literature & Languages | 564 | 7.6% |
| Liberal Arts & History | 613 | 8.3% |
| Visual & Performing Arts | 289 | 3.9% |
| Communications | 349 | 4.7% |
| Arts & Humanities | 255 | 3.5% |
| Total | 7,375 | 100.0% |
Transportation & Commute in Annapolis Neck
Vehicle Availability by Sex in Annapolis Neck
The most prevalent vehicle ownership categories in Annapolis Neck are males with 2 vehicles (1,682, accounting for 45.9%) and females with 2 vehicles (1,277, making up 62.1%).
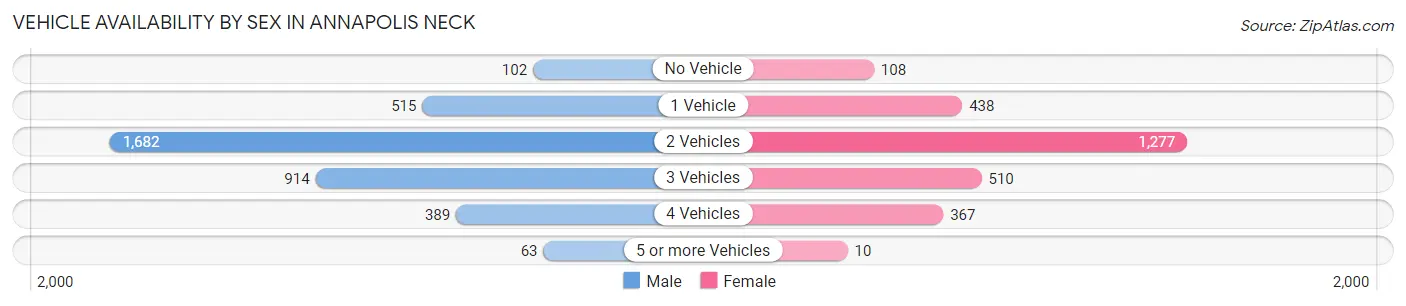
| Vehicles Available | Male | Female |
| No Vehicle | 102 (2.8%) | 108 (4.0%) |
| 1 Vehicle | 515 (14.1%) | 438 (16.2%) |
| 2 Vehicles | 1,682 (45.9%) | 1,277 (47.1%) |
| 3 Vehicles | 914 (24.9%) | 510 (18.8%) |
| 4 Vehicles | 389 (10.6%) | 367 (13.5%) |
| 5 or more Vehicles | 63 (1.7%) | 10 (0.4%) |
| Total | 3,665 (100.0%) | 2,710 (100.0%) |
Commute Time in Annapolis Neck
The most frequently occuring commute durations in Annapolis Neck are 15 to 19 minutes (889 commuters, 18.2%), 45 to 59 minutes (686 commuters, 14.1%), and 60 to 89 minutes (612 commuters, 12.6%).
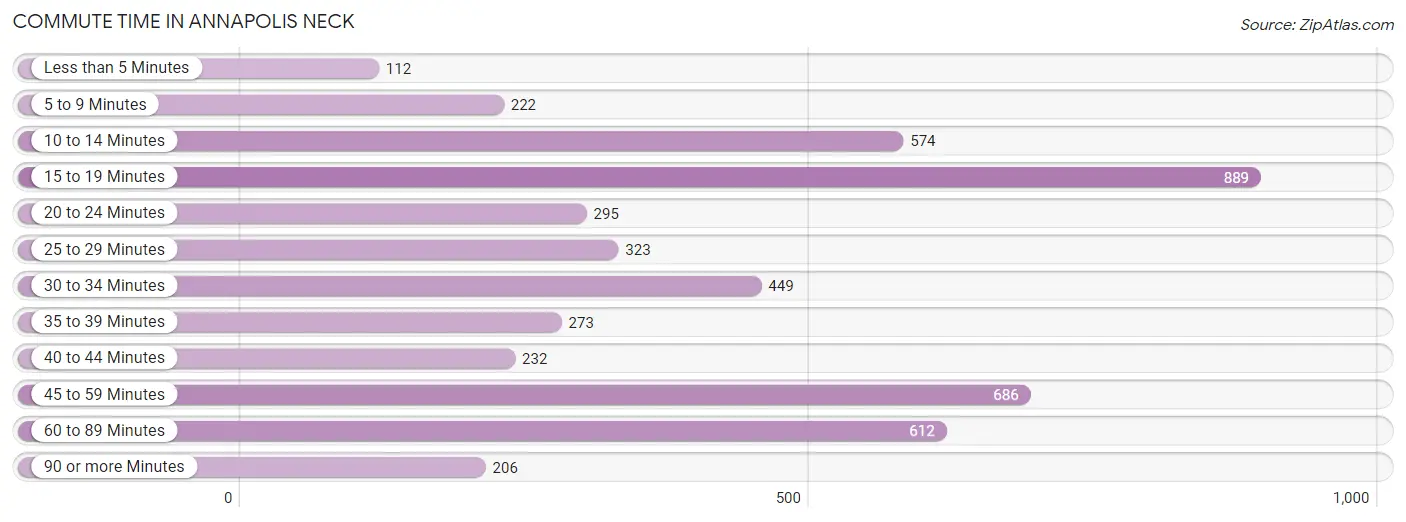
| Commute Time | # Commuters | % Commuters |
| Less than 5 Minutes | 112 | 2.3% |
| 5 to 9 Minutes | 222 | 4.6% |
| 10 to 14 Minutes | 574 | 11.8% |
| 15 to 19 Minutes | 889 | 18.2% |
| 20 to 24 Minutes | 295 | 6.0% |
| 25 to 29 Minutes | 323 | 6.6% |
| 30 to 34 Minutes | 449 | 9.2% |
| 35 to 39 Minutes | 273 | 5.6% |
| 40 to 44 Minutes | 232 | 4.8% |
| 45 to 59 Minutes | 686 | 14.1% |
| 60 to 89 Minutes | 612 | 12.6% |
| 90 or more Minutes | 206 | 4.2% |
Commute Time by Sex in Annapolis Neck
The most common commute times in Annapolis Neck are 10 to 14 minutes (441 commuters, 15.0%) for males and 15 to 19 minutes (629 commuters, 32.5%) for females.
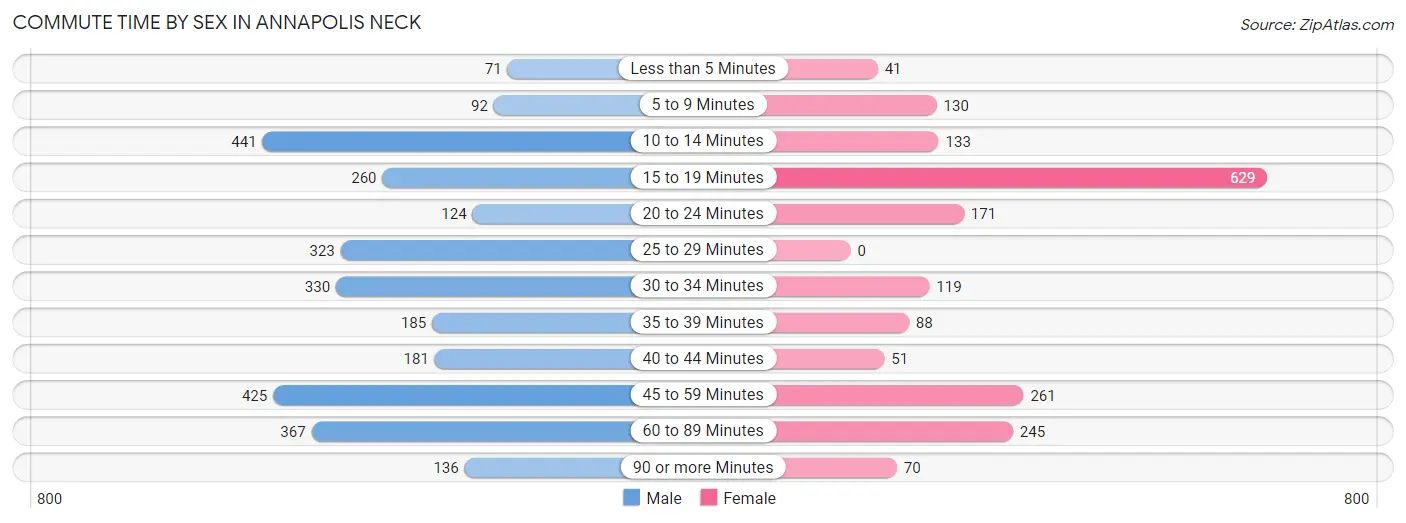
| Commute Time | Male | Female |
| Less than 5 Minutes | 71 (2.4%) | 41 (2.1%) |
| 5 to 9 Minutes | 92 (3.1%) | 130 (6.7%) |
| 10 to 14 Minutes | 441 (15.0%) | 133 (6.9%) |
| 15 to 19 Minutes | 260 (8.9%) | 629 (32.5%) |
| 20 to 24 Minutes | 124 (4.2%) | 171 (8.8%) |
| 25 to 29 Minutes | 323 (11.0%) | 0 (0.0%) |
| 30 to 34 Minutes | 330 (11.2%) | 119 (6.1%) |
| 35 to 39 Minutes | 185 (6.3%) | 88 (4.5%) |
| 40 to 44 Minutes | 181 (6.2%) | 51 (2.6%) |
| 45 to 59 Minutes | 425 (14.5%) | 261 (13.5%) |
| 60 to 89 Minutes | 367 (12.5%) | 245 (12.6%) |
| 90 or more Minutes | 136 (4.6%) | 70 (3.6%) |
Time of Departure to Work by Sex in Annapolis Neck
The most frequent times of departure to work in Annapolis Neck are 7:00 AM to 7:29 AM (455, 15.5%) for males and 7:30 AM to 7:59 AM (437, 22.6%) for females.
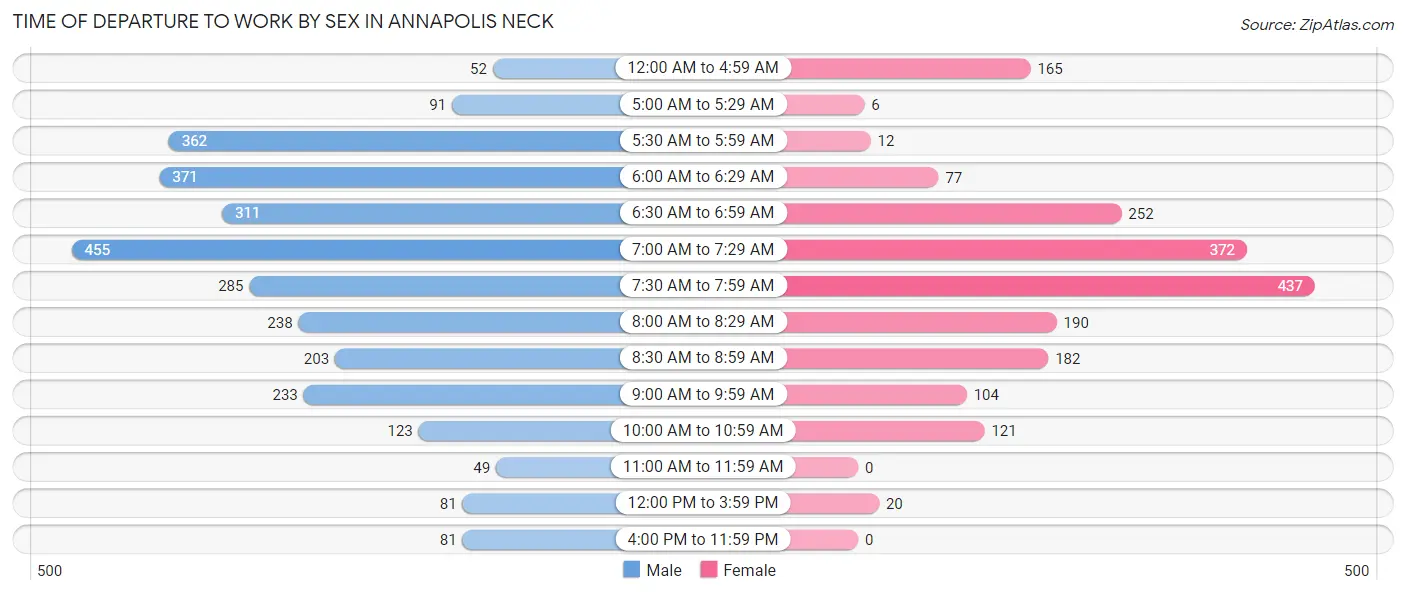
| Time of Departure | Male | Female |
| 12:00 AM to 4:59 AM | 52 (1.8%) | 165 (8.5%) |
| 5:00 AM to 5:29 AM | 91 (3.1%) | 6 (0.3%) |
| 5:30 AM to 5:59 AM | 362 (12.3%) | 12 (0.6%) |
| 6:00 AM to 6:29 AM | 371 (12.6%) | 77 (4.0%) |
| 6:30 AM to 6:59 AM | 311 (10.6%) | 252 (13.0%) |
| 7:00 AM to 7:29 AM | 455 (15.5%) | 372 (19.2%) |
| 7:30 AM to 7:59 AM | 285 (9.7%) | 437 (22.6%) |
| 8:00 AM to 8:29 AM | 238 (8.1%) | 190 (9.8%) |
| 8:30 AM to 8:59 AM | 203 (6.9%) | 182 (9.4%) |
| 9:00 AM to 9:59 AM | 233 (7.9%) | 104 (5.4%) |
| 10:00 AM to 10:59 AM | 123 (4.2%) | 121 (6.2%) |
| 11:00 AM to 11:59 AM | 49 (1.7%) | 0 (0.0%) |
| 12:00 PM to 3:59 PM | 81 (2.8%) | 20 (1.0%) |
| 4:00 PM to 11:59 PM | 81 (2.8%) | 0 (0.0%) |
| Total | 2,935 (100.0%) | 1,938 (100.0%) |
Housing Occupancy in Annapolis Neck
Occupancy by Ownership in Annapolis Neck
Of the total 5,126 dwellings in Annapolis Neck, owner-occupied units account for 4,678 (91.3%), while renter-occupied units make up 448 (8.7%).
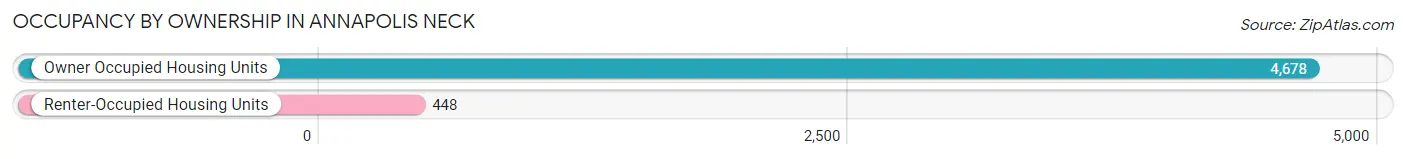
| Occupancy | # Housing Units | % Housing Units |
| Owner Occupied Housing Units | 4,678 | 91.3% |
| Renter-Occupied Housing Units | 448 | 8.7% |
| Total Occupied Housing Units | 5,126 | 100.0% |
Occupancy by Household Size in Annapolis Neck
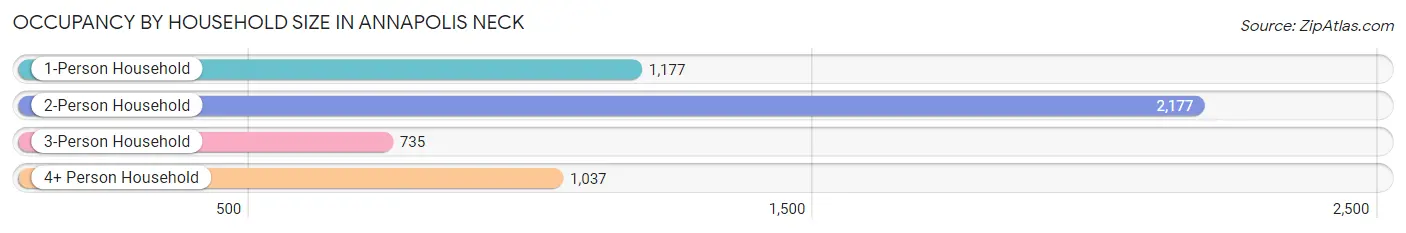
| Household Size | # Housing Units | % Housing Units |
| 1-Person Household | 1,177 | 23.0% |
| 2-Person Household | 2,177 | 42.5% |
| 3-Person Household | 735 | 14.3% |
| 4+ Person Household | 1,037 | 20.2% |
| Total Housing Units | 5,126 | 100.0% |
Occupancy by Ownership by Household Size in Annapolis Neck
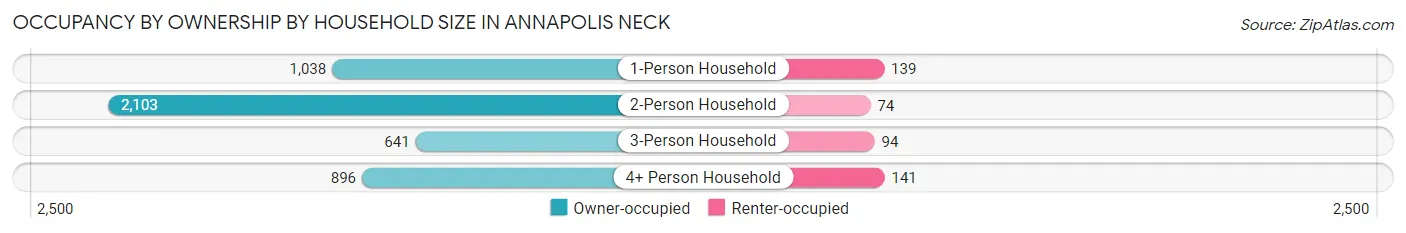
| Household Size | Owner-occupied | Renter-occupied |
| 1-Person Household | 1,038 (88.2%) | 139 (11.8%) |
| 2-Person Household | 2,103 (96.6%) | 74 (3.4%) |
| 3-Person Household | 641 (87.2%) | 94 (12.8%) |
| 4+ Person Household | 896 (86.4%) | 141 (13.6%) |
| Total Housing Units | 4,678 (91.3%) | 448 (8.7%) |
Occupancy by Educational Attainment in Annapolis Neck
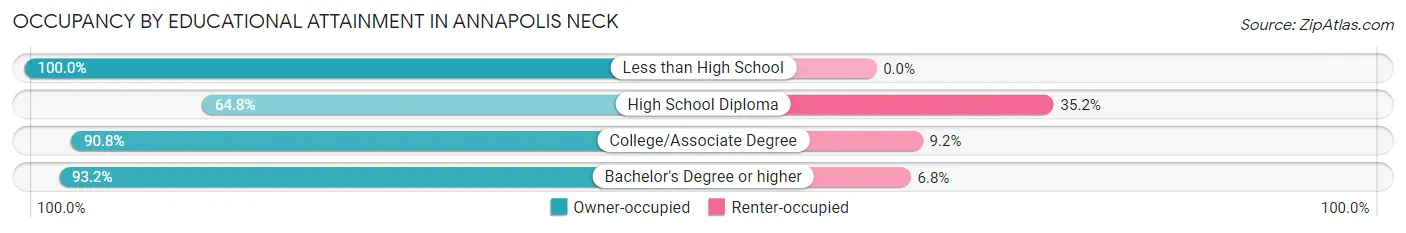
| Household Size | Owner-occupied | Renter-occupied |
| Less than High School | 97 (100.0%) | 0 (0.0%) |
| High School Diploma | 186 (64.8%) | 101 (35.2%) |
| College/Associate Degree | 876 (90.8%) | 89 (9.2%) |
| Bachelor's Degree or higher | 3,519 (93.2%) | 258 (6.8%) |
Occupancy by Age of Householder in Annapolis Neck
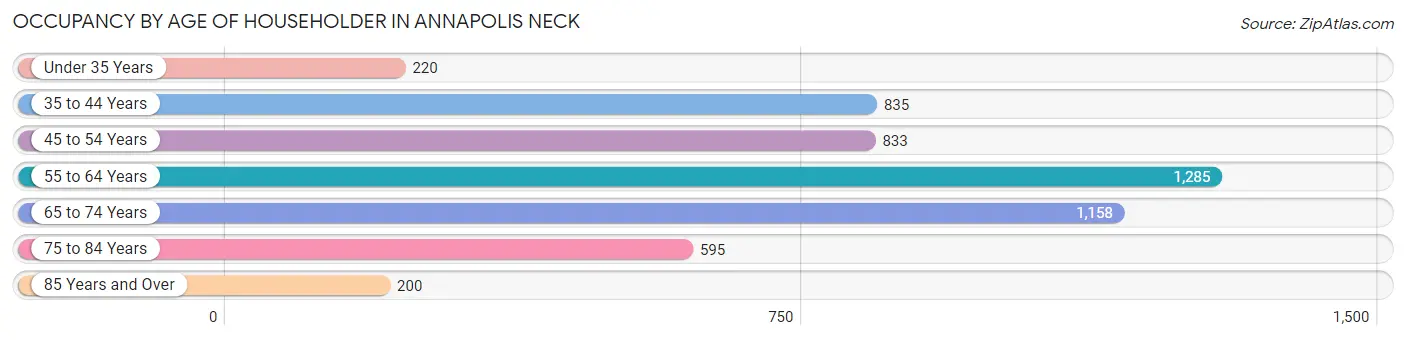
| Age Bracket | # Households | % Households |
| Under 35 Years | 220 | 4.3% |
| 35 to 44 Years | 835 | 16.3% |
| 45 to 54 Years | 833 | 16.3% |
| 55 to 64 Years | 1,285 | 25.1% |
| 65 to 74 Years | 1,158 | 22.6% |
| 75 to 84 Years | 595 | 11.6% |
| 85 Years and Over | 200 | 3.9% |
| Total | 5,126 | 100.0% |
Housing Finances in Annapolis Neck
Median Income by Occupancy in Annapolis Neck
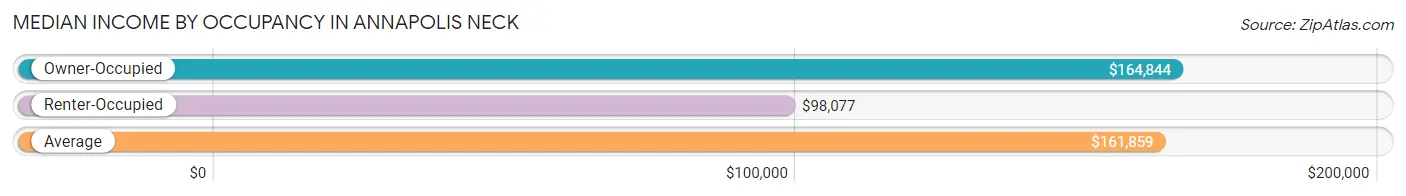
| Occupancy Type | # Households | Median Income |
| Owner-Occupied | 4,678 (91.3%) | $164,844 |
| Renter-Occupied | 448 (8.7%) | $98,077 |
| Average | 5,126 (100.0%) | $161,859 |
Occupancy by Householder Income Bracket in Annapolis Neck
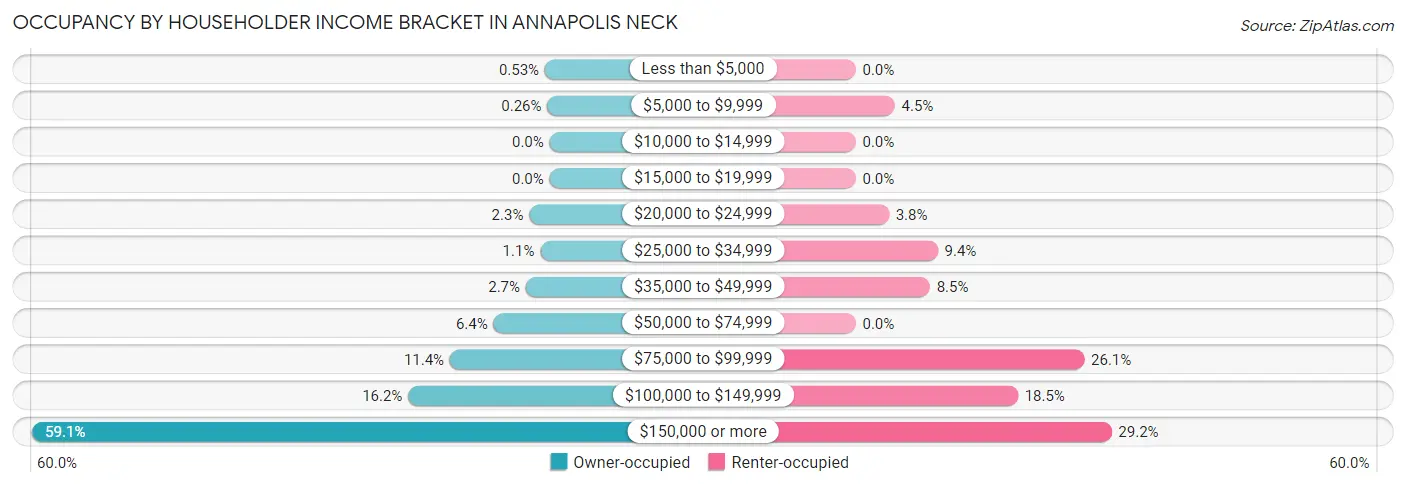
| Income Bracket | Owner-occupied | Renter-occupied |
| Less than $5,000 | 25 (0.5%) | 0 (0.0%) |
| $5,000 to $9,999 | 12 (0.3%) | 20 (4.5%) |
| $10,000 to $14,999 | 0 (0.0%) | 0 (0.0%) |
| $15,000 to $19,999 | 0 (0.0%) | 0 (0.0%) |
| $20,000 to $24,999 | 109 (2.3%) | 17 (3.8%) |
| $25,000 to $34,999 | 50 (1.1%) | 42 (9.4%) |
| $35,000 to $49,999 | 127 (2.7%) | 38 (8.5%) |
| $50,000 to $74,999 | 300 (6.4%) | 0 (0.0%) |
| $75,000 to $99,999 | 533 (11.4%) | 117 (26.1%) |
| $100,000 to $149,999 | 756 (16.2%) | 83 (18.5%) |
| $150,000 or more | 2,766 (59.1%) | 131 (29.2%) |
| Total | 4,678 (100.0%) | 448 (100.0%) |
Monthly Housing Cost Tiers in Annapolis Neck
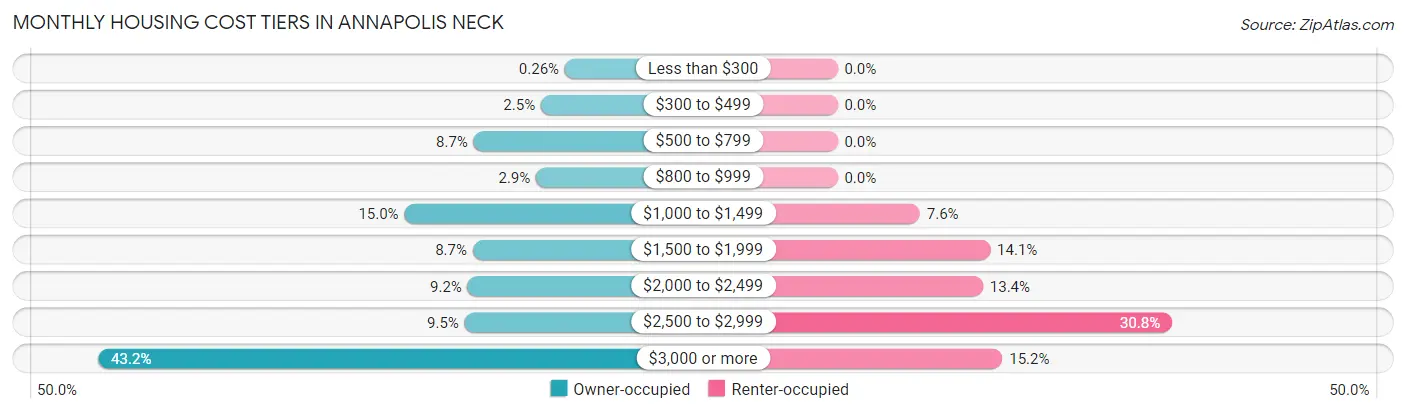
| Monthly Cost | Owner-occupied | Renter-occupied |
| Less than $300 | 12 (0.3%) | 0 (0.0%) |
| $300 to $499 | 115 (2.5%) | 0 (0.0%) |
| $500 to $799 | 405 (8.7%) | 0 (0.0%) |
| $800 to $999 | 136 (2.9%) | 0 (0.0%) |
| $1,000 to $1,499 | 703 (15.0%) | 34 (7.6%) |
| $1,500 to $1,999 | 409 (8.7%) | 63 (14.1%) |
| $2,000 to $2,499 | 431 (9.2%) | 60 (13.4%) |
| $2,500 to $2,999 | 444 (9.5%) | 138 (30.8%) |
| $3,000 or more | 2,023 (43.2%) | 68 (15.2%) |
| Total | 4,678 (100.0%) | 448 (100.0%) |
Physical Housing Characteristics in Annapolis Neck
Housing Structures in Annapolis Neck
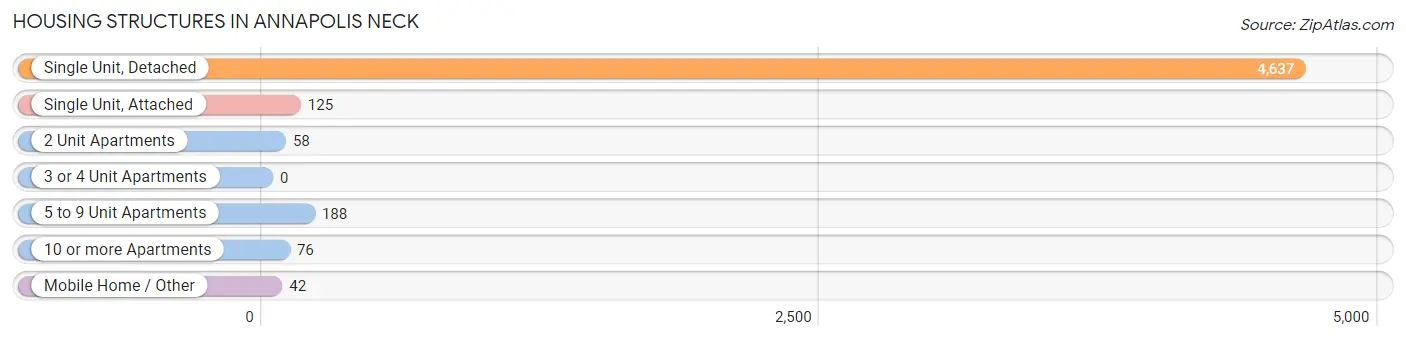
| Structure Type | # Housing Units | % Housing Units |
| Single Unit, Detached | 4,637 | 90.5% |
| Single Unit, Attached | 125 | 2.4% |
| 2 Unit Apartments | 58 | 1.1% |
| 3 or 4 Unit Apartments | 0 | 0.0% |
| 5 to 9 Unit Apartments | 188 | 3.7% |
| 10 or more Apartments | 76 | 1.5% |
| Mobile Home / Other | 42 | 0.8% |
| Total | 5,126 | 100.0% |
Housing Structures by Occupancy in Annapolis Neck
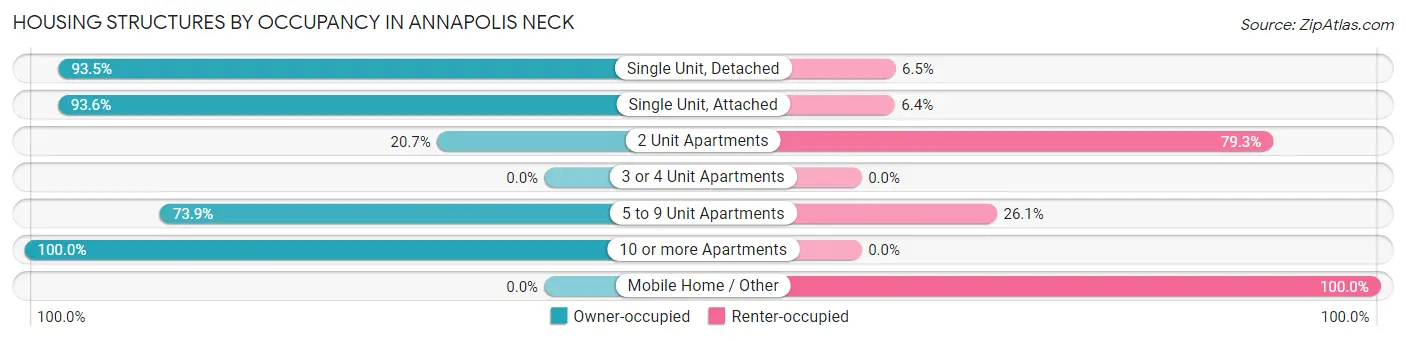
| Structure Type | Owner-occupied | Renter-occupied |
| Single Unit, Detached | 4,334 (93.5%) | 303 (6.5%) |
| Single Unit, Attached | 117 (93.6%) | 8 (6.4%) |
| 2 Unit Apartments | 12 (20.7%) | 46 (79.3%) |
| 3 or 4 Unit Apartments | 0 (0.0%) | 0 (0.0%) |
| 5 to 9 Unit Apartments | 139 (73.9%) | 49 (26.1%) |
| 10 or more Apartments | 76 (100.0%) | 0 (0.0%) |
| Mobile Home / Other | 0 (0.0%) | 42 (100.0%) |
| Total | 4,678 (91.3%) | 448 (8.7%) |
Housing Structures by Number of Rooms in Annapolis Neck
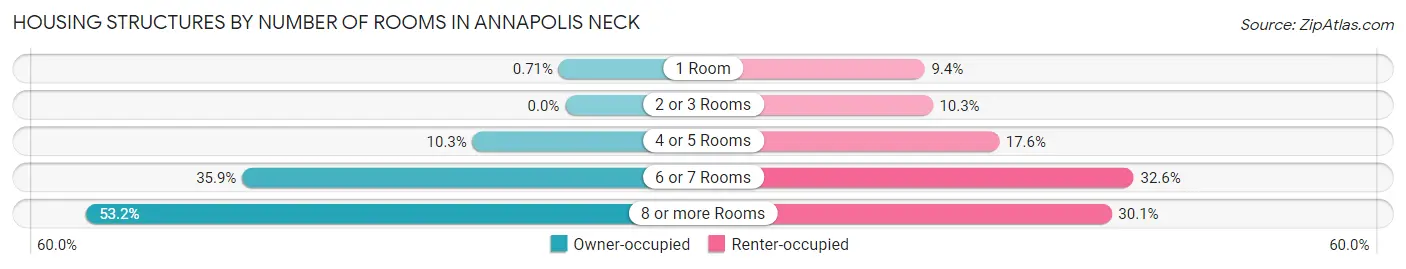
| Number of Rooms | Owner-occupied | Renter-occupied |
| 1 Room | 33 (0.7%) | 42 (9.4%) |
| 2 or 3 Rooms | 0 (0.0%) | 46 (10.3%) |
| 4 or 5 Rooms | 481 (10.3%) | 79 (17.6%) |
| 6 or 7 Rooms | 1,677 (35.8%) | 146 (32.6%) |
| 8 or more Rooms | 2,487 (53.2%) | 135 (30.1%) |
| Total | 4,678 (100.0%) | 448 (100.0%) |
Housing Structure by Heating Type in Annapolis Neck
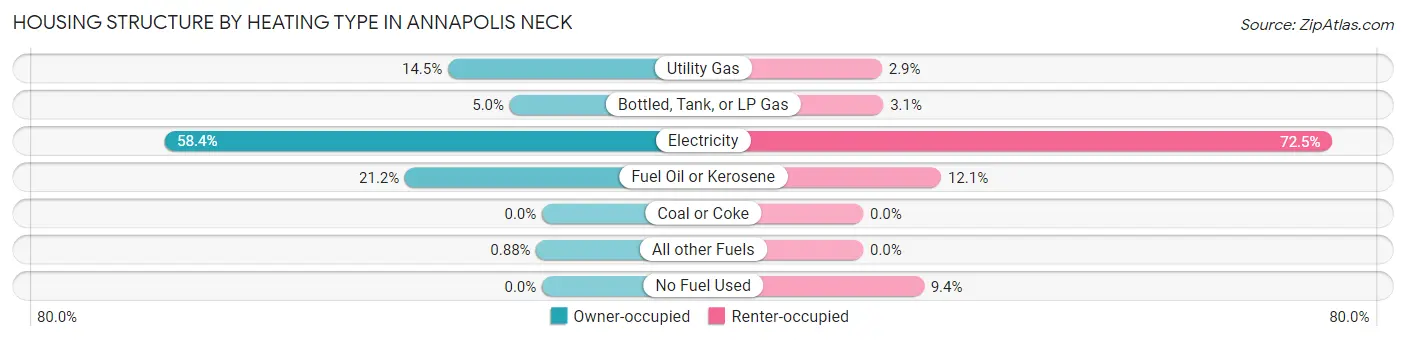
| Heating Type | Owner-occupied | Renter-occupied |
| Utility Gas | 680 (14.5%) | 13 (2.9%) |
| Bottled, Tank, or LP Gas | 233 (5.0%) | 14 (3.1%) |
| Electricity | 2,733 (58.4%) | 325 (72.5%) |
| Fuel Oil or Kerosene | 991 (21.2%) | 54 (12.0%) |
| Coal or Coke | 0 (0.0%) | 0 (0.0%) |
| All other Fuels | 41 (0.9%) | 0 (0.0%) |
| No Fuel Used | 0 (0.0%) | 42 (9.4%) |
| Total | 4,678 (100.0%) | 448 (100.0%) |
Household Vehicle Usage in Annapolis Neck
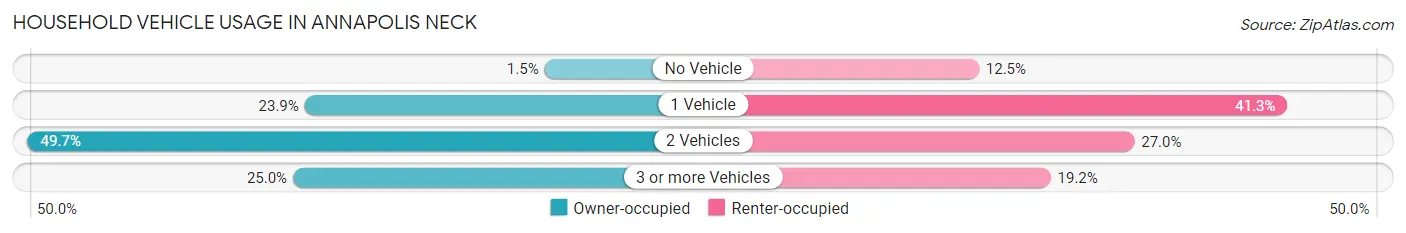
| Vehicles per Household | Owner-occupied | Renter-occupied |
| No Vehicle | 69 (1.5%) | 56 (12.5%) |
| 1 Vehicle | 1,116 (23.9%) | 185 (41.3%) |
| 2 Vehicles | 2,326 (49.7%) | 121 (27.0%) |
| 3 or more Vehicles | 1,167 (24.9%) | 86 (19.2%) |
| Total | 4,678 (100.0%) | 448 (100.0%) |
Real Estate & Mortgages in Annapolis Neck
Real Estate and Mortgage Overview in Annapolis Neck
| Characteristic | Without Mortgage | With Mortgage |
| Housing Units | 1,276 | 3,402 |
| Median Property Value | $669,500 | $718,100 |
| Median Household Income | $110,455 | $2,288 |
| Monthly Housing Costs | $996 | $2,023 |
| Real Estate Taxes | $4,773 | $9 |
Property Value by Mortgage Status in Annapolis Neck
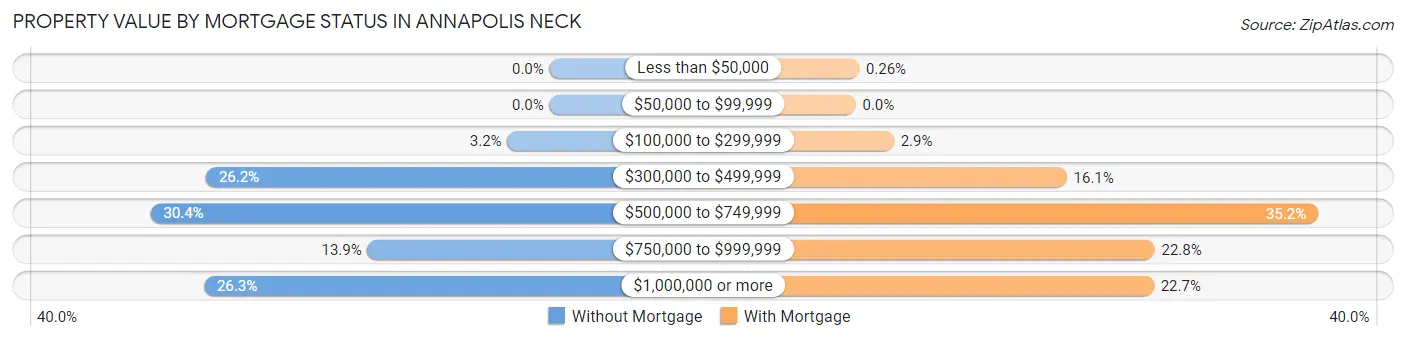
| Property Value | Without Mortgage | With Mortgage |
| Less than $50,000 | 0 (0.0%) | 9 (0.3%) |
| $50,000 to $99,999 | 0 (0.0%) | 0 (0.0%) |
| $100,000 to $299,999 | 41 (3.2%) | 99 (2.9%) |
| $300,000 to $499,999 | 334 (26.2%) | 547 (16.1%) |
| $500,000 to $749,999 | 388 (30.4%) | 1,199 (35.2%) |
| $750,000 to $999,999 | 177 (13.9%) | 775 (22.8%) |
| $1,000,000 or more | 336 (26.3%) | 773 (22.7%) |
| Total | 1,276 (100.0%) | 3,402 (100.0%) |
Household Income by Mortgage Status in Annapolis Neck
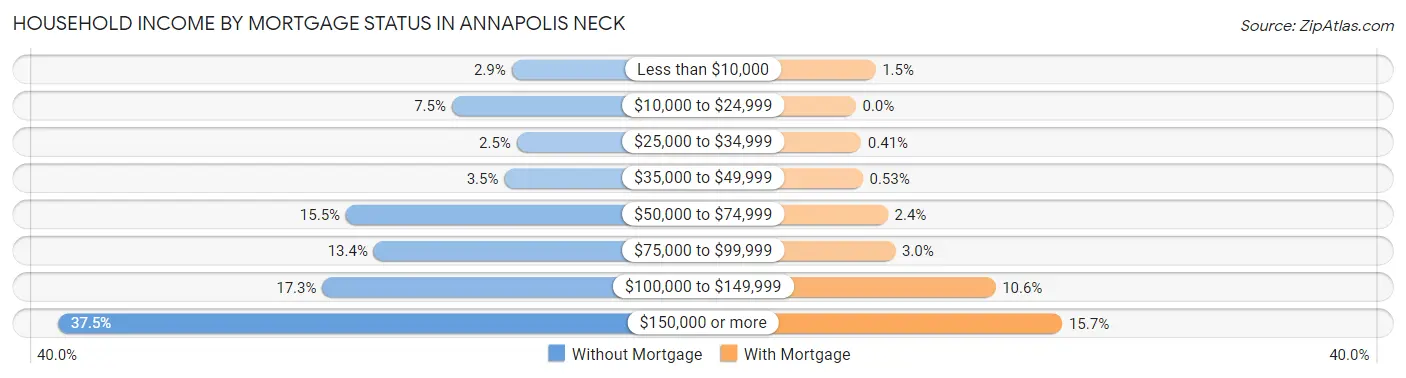
| Household Income | Without Mortgage | With Mortgage |
| Less than $10,000 | 37 (2.9%) | 51 (1.5%) |
| $10,000 to $24,999 | 95 (7.4%) | 0 (0.0%) |
| $25,000 to $34,999 | 32 (2.5%) | 14 (0.4%) |
| $35,000 to $49,999 | 44 (3.5%) | 18 (0.5%) |
| $50,000 to $74,999 | 198 (15.5%) | 83 (2.4%) |
| $75,000 to $99,999 | 171 (13.4%) | 102 (3.0%) |
| $100,000 to $149,999 | 221 (17.3%) | 362 (10.6%) |
| $150,000 or more | 478 (37.5%) | 535 (15.7%) |
| Total | 1,276 (100.0%) | 3,402 (100.0%) |
Property Value to Household Income Ratio in Annapolis Neck
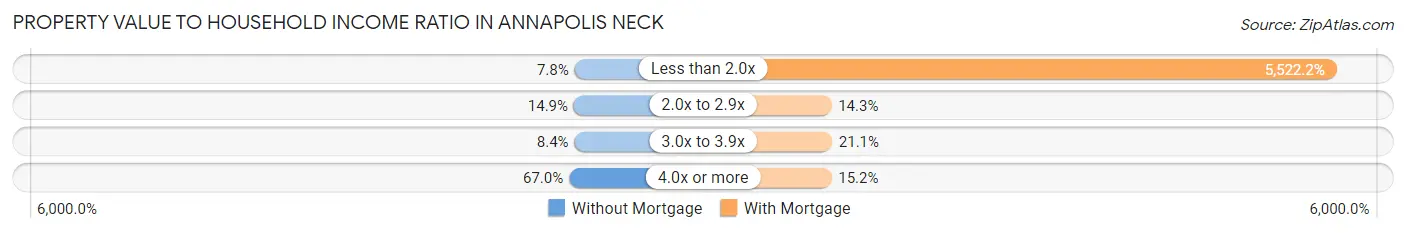
| Value-to-Income Ratio | Without Mortgage | With Mortgage |
| Less than 2.0x | 99 (7.8%) | 187,865 (5,522.2%) |
| 2.0x to 2.9x | 190 (14.9%) | 488 (14.3%) |
| 3.0x to 3.9x | 107 (8.4%) | 718 (21.1%) |
| 4.0x or more | 855 (67.0%) | 518 (15.2%) |
| Total | 1,276 (100.0%) | 3,402 (100.0%) |
Real Estate Taxes by Mortgage Status in Annapolis Neck

| Property Taxes | Without Mortgage | With Mortgage |
| Less than $800 | 0 (0.0%) | 0 (0.0%) |
| $800 to $1,499 | 12 (0.9%) | 0 (0.0%) |
| $800 to $1,499 | 1,246 (97.7%) | 41 (1.2%) |
| Total | 1,276 (100.0%) | 3,402 (100.0%) |
Health & Disability in Annapolis Neck
Health Insurance Coverage by Age in Annapolis Neck
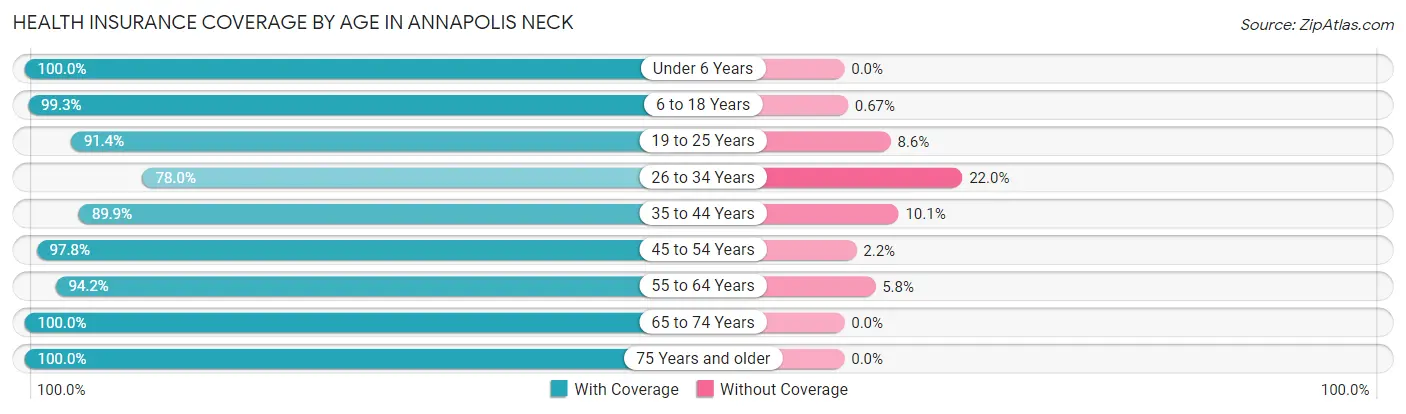
| Age Bracket | With Coverage | Without Coverage |
| Under 6 Years | 733 (100.0%) | 0 (0.0%) |
| 6 to 18 Years | 1,937 (99.3%) | 13 (0.7%) |
| 19 to 25 Years | 594 (91.4%) | 56 (8.6%) |
| 26 to 34 Years | 525 (78.0%) | 148 (22.0%) |
| 35 to 44 Years | 1,458 (89.9%) | 164 (10.1%) |
| 45 to 54 Years | 1,659 (97.8%) | 38 (2.2%) |
| 55 to 64 Years | 2,125 (94.2%) | 130 (5.8%) |
| 65 to 74 Years | 1,792 (100.0%) | 0 (0.0%) |
| 75 Years and older | 1,276 (100.0%) | 0 (0.0%) |
| Total | 12,099 (95.7%) | 549 (4.3%) |
Health Insurance Coverage by Citizenship Status in Annapolis Neck

| Citizenship Status | With Coverage | Without Coverage |
| Native Born | 733 (100.0%) | 0 (0.0%) |
| Foreign Born, Citizen | 1,937 (99.3%) | 13 (0.7%) |
| Foreign Born, not a Citizen | 594 (91.4%) | 56 (8.6%) |
Health Insurance Coverage by Household Income in Annapolis Neck
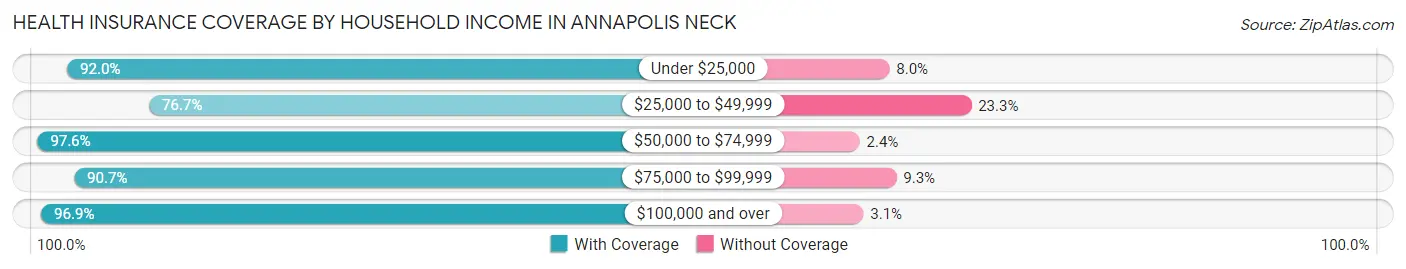
| Household Income | With Coverage | Without Coverage |
| Under $25,000 | 300 (92.0%) | 26 (8.0%) |
| $25,000 to $49,999 | 273 (76.7%) | 83 (23.3%) |
| $50,000 to $74,999 | 406 (97.6%) | 10 (2.4%) |
| $75,000 to $99,999 | 1,055 (90.7%) | 108 (9.3%) |
| $100,000 and over | 10,016 (96.9%) | 320 (3.1%) |
Public vs Private Health Insurance Coverage by Age in Annapolis Neck
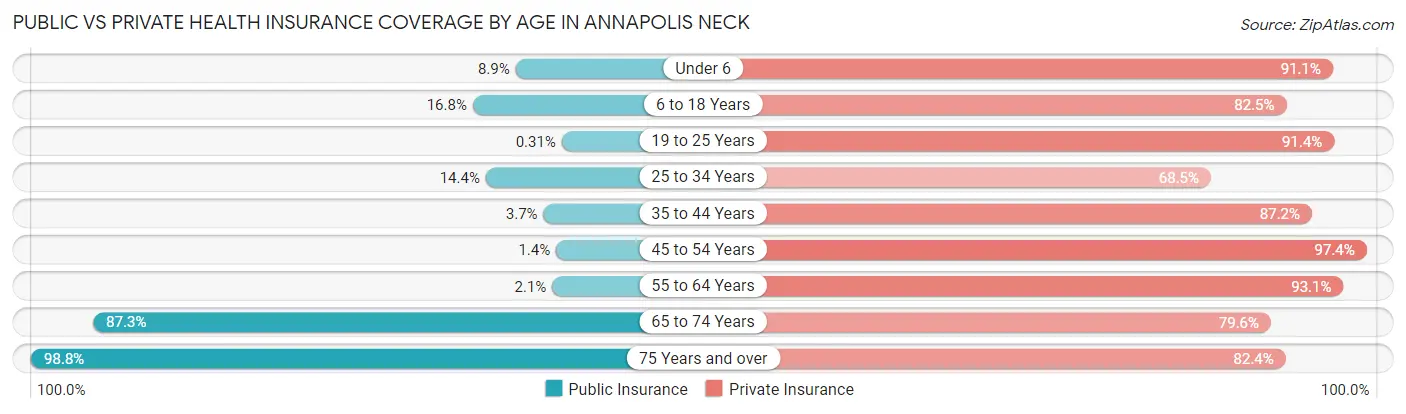
| Age Bracket | Public Insurance | Private Insurance |
| Under 6 | 65 (8.9%) | 668 (91.1%) |
| 6 to 18 Years | 328 (16.8%) | 1,609 (82.5%) |
| 19 to 25 Years | 2 (0.3%) | 594 (91.4%) |
| 25 to 34 Years | 97 (14.4%) | 461 (68.5%) |
| 35 to 44 Years | 60 (3.7%) | 1,415 (87.2%) |
| 45 to 54 Years | 23 (1.4%) | 1,653 (97.4%) |
| 55 to 64 Years | 47 (2.1%) | 2,099 (93.1%) |
| 65 to 74 Years | 1,564 (87.3%) | 1,427 (79.6%) |
| 75 Years and over | 1,261 (98.8%) | 1,051 (82.4%) |
| Total | 3,447 (27.3%) | 10,977 (86.8%) |
Disability Status by Sex by Age in Annapolis Neck
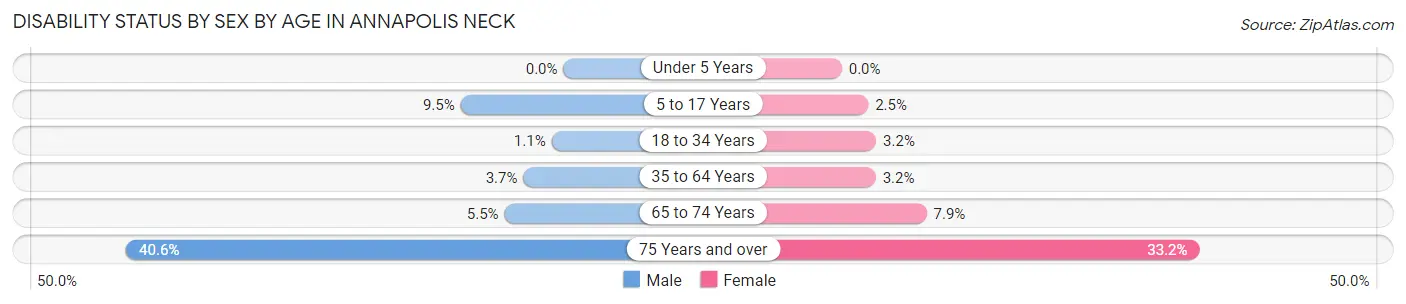
| Age Bracket | Male | Female |
| Under 5 Years | 0 (0.0%) | 0 (0.0%) |
| 5 to 17 Years | 104 (9.5%) | 21 (2.5%) |
| 18 to 34 Years | 8 (1.1%) | 22 (3.2%) |
| 35 to 64 Years | 101 (3.7%) | 90 (3.2%) |
| 65 to 74 Years | 48 (5.5%) | 72 (7.9%) |
| 75 Years and over | 256 (40.6%) | 214 (33.2%) |
Disability Class by Sex by Age in Annapolis Neck
Disability Class: Hearing Difficulty
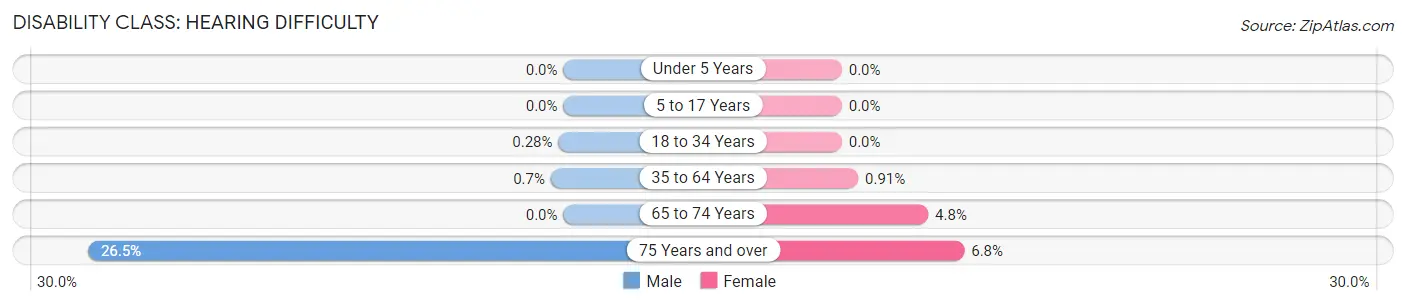
| Age Bracket | Male | Female |
| Under 5 Years | 0 (0.0%) | 0 (0.0%) |
| 5 to 17 Years | 0 (0.0%) | 0 (0.0%) |
| 18 to 34 Years | 2 (0.3%) | 0 (0.0%) |
| 35 to 64 Years | 19 (0.7%) | 26 (0.9%) |
| 65 to 74 Years | 0 (0.0%) | 44 (4.8%) |
| 75 Years and over | 167 (26.5%) | 44 (6.8%) |
Disability Class: Vision Difficulty
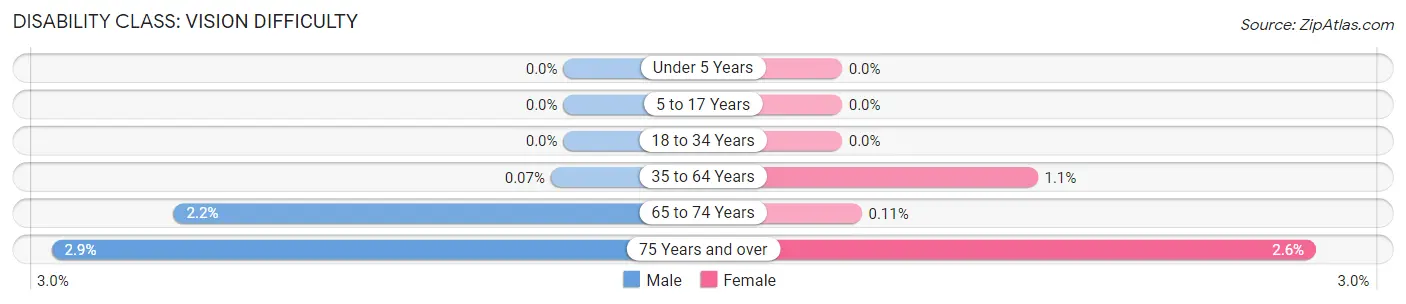
| Age Bracket | Male | Female |
| Under 5 Years | 0 (0.0%) | 0 (0.0%) |
| 5 to 17 Years | 0 (0.0%) | 0 (0.0%) |
| 18 to 34 Years | 0 (0.0%) | 0 (0.0%) |
| 35 to 64 Years | 2 (0.1%) | 31 (1.1%) |
| 65 to 74 Years | 19 (2.2%) | 1 (0.1%) |
| 75 Years and over | 18 (2.9%) | 17 (2.6%) |
Disability Class: Cognitive Difficulty
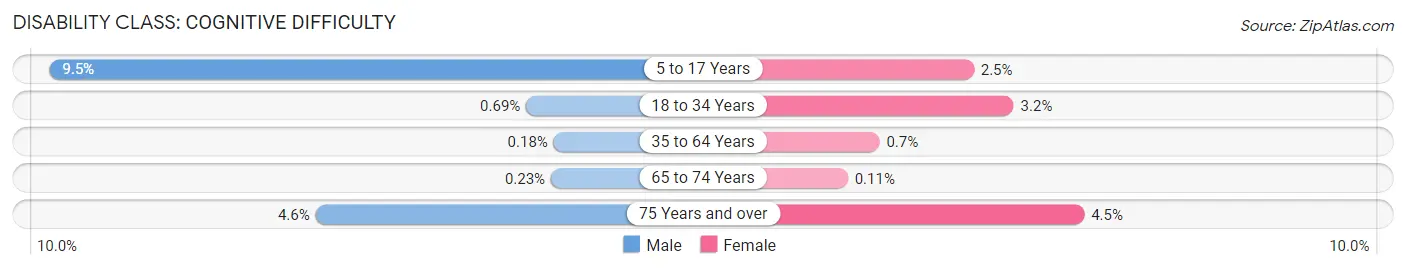
| Age Bracket | Male | Female |
| 5 to 17 Years | 104 (9.5%) | 21 (2.5%) |
| 18 to 34 Years | 5 (0.7%) | 22 (3.2%) |
| 35 to 64 Years | 5 (0.2%) | 20 (0.7%) |
| 65 to 74 Years | 2 (0.2%) | 1 (0.1%) |
| 75 Years and over | 29 (4.6%) | 29 (4.5%) |
Disability Class: Ambulatory Difficulty
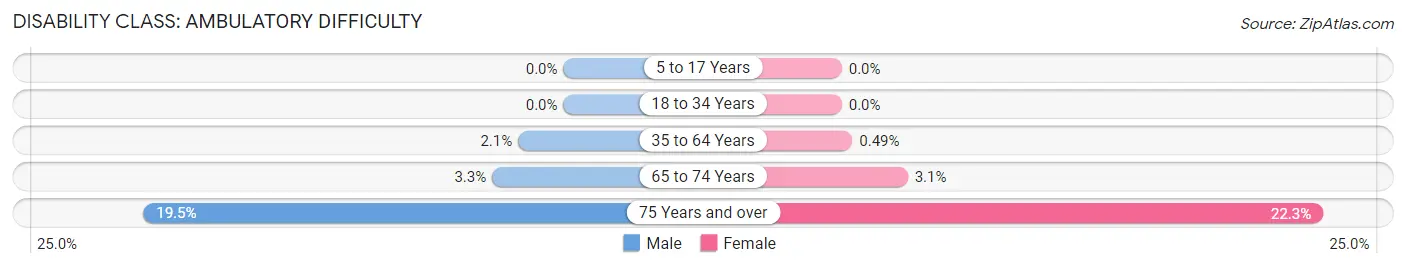
| Age Bracket | Male | Female |
| 5 to 17 Years | 0 (0.0%) | 0 (0.0%) |
| 18 to 34 Years | 0 (0.0%) | 0 (0.0%) |
| 35 to 64 Years | 57 (2.1%) | 14 (0.5%) |
| 65 to 74 Years | 29 (3.3%) | 28 (3.1%) |
| 75 Years and over | 123 (19.5%) | 144 (22.3%) |
Disability Class: Self-Care Difficulty

| Age Bracket | Male | Female |
| 5 to 17 Years | 10 (0.9%) | 0 (0.0%) |
| 18 to 34 Years | 2 (0.3%) | 2 (0.3%) |
| 35 to 64 Years | 2 (0.1%) | 4 (0.1%) |
| 65 to 74 Years | 10 (1.1%) | 10 (1.1%) |
| 75 Years and over | 16 (2.5%) | 67 (10.4%) |
Technology Access in Annapolis Neck
Computing Device Access in Annapolis Neck
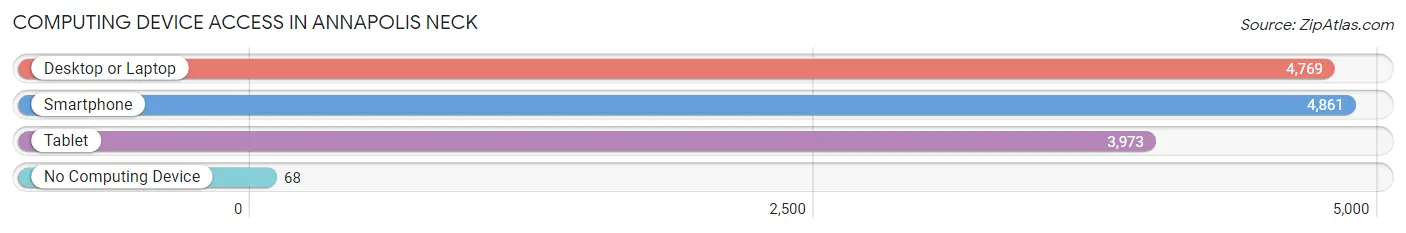
| Device Type | # Households | % Households |
| Desktop or Laptop | 4,769 | 93.0% |
| Smartphone | 4,861 | 94.8% |
| Tablet | 3,973 | 77.5% |
| No Computing Device | 68 | 1.3% |
| Total | 5,126 | 100.0% |
Internet Access in Annapolis Neck
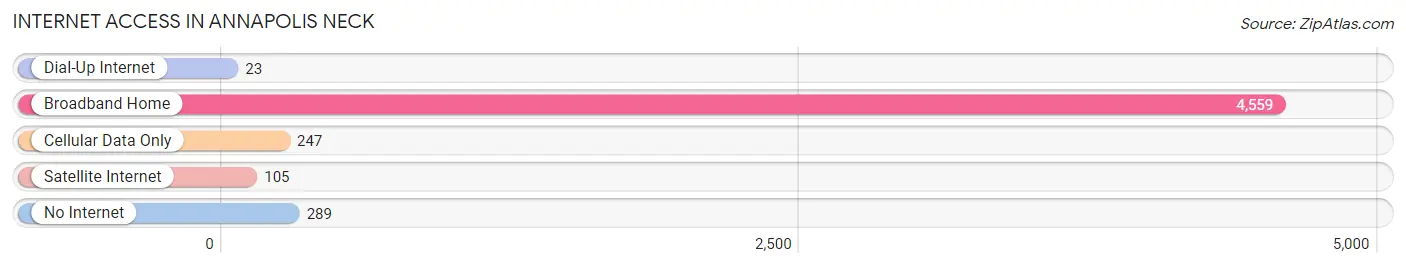
| Internet Type | # Households | % Households |
| Dial-Up Internet | 23 | 0.4% |
| Broadband Home | 4,559 | 88.9% |
| Cellular Data Only | 247 | 4.8% |
| Satellite Internet | 105 | 2.1% |
| No Internet | 289 | 5.6% |
| Total | 5,126 | 100.0% |
Annapolis Neck Summary
Annapolis Neck is a peninsula located in Anne Arundel County, Maryland, United States. It is bordered by the Severn River to the north, the South River to the east, and the Chesapeake Bay to the south and west. The peninsula is approximately 8 miles long and 2 miles wide, and is home to a population of approximately 10,000 people.
History
The area now known as Annapolis Neck has a long and varied history. The first inhabitants of the area were Native Americans, who lived in the area for thousands of years before the arrival of European settlers. The first Europeans to settle in the area were the English, who established a trading post in 1649. The area was then known as “Providence” and was part of the Province of Maryland.
In 1695, the area was renamed “Annapolis Neck” after Queen Anne of England. The area was then divided into two counties, Anne Arundel and Queen Anne’s. In 1708, the two counties were merged into one, and the area was officially named Anne Arundel County.
In the late 1700s, the area was home to a large number of tobacco plantations, which were the main source of income for the area. In the early 1800s, the area began to transition to a more industrial economy, with the construction of a number of factories and mills.
In the late 1800s, the area began to transition to a more residential economy, with the construction of a number of homes and businesses. The area was also home to a number of resorts, which attracted visitors from all over the country.
Geography
Annapolis Neck is located in Anne Arundel County, Maryland, United States. It is bordered by the Severn River to the north, the South River to the east, and the Chesapeake Bay to the south and west. The peninsula is approximately 8 miles long and 2 miles wide.
The area is mostly flat, with some rolling hills. The highest point on the peninsula is located at the intersection of Severn Road and Bay Ridge Road, which is approximately 40 feet above sea level.
The area is home to a number of parks and recreational areas, including Quiet Waters Park, Sandy Point State Park, and Fort Smallwood Park.
Economy
The economy of Annapolis Neck is largely based on tourism and service industries. The area is home to a number of resorts, hotels, restaurants, and other tourist attractions. The area is also home to a number of government and military installations, including the United States Naval Academy and the National Security Agency.
The area is also home to a number of businesses, including a number of technology companies, as well as a number of retail stores and restaurants.
Demographics
As of the 2010 census, the population of Annapolis Neck was 10,000. The population is largely white (83.3%), with a small African American population (7.3%) and a small Hispanic population (3.3%). The median household income is $77,000, and the median home value is $400,000.
The area is home to a number of educational institutions, including the United States Naval Academy, Anne Arundel Community College, and the University of Maryland, Baltimore County.
Conclusion
Annapolis Neck is a peninsula located in Anne Arundel County, Maryland, United States. It is bordered by the Severn River to the north, the South River to the east, and the Chesapeake Bay to the south and west. The peninsula is approximately 8 miles long and 2 miles wide, and is home to a population of approximately 10,000 people. The area has a long and varied history, and is home to a number of parks and recreational areas. The economy of the area is largely based on tourism and service industries, and the population is largely white. The area is home to a number of educational institutions, including the United States Naval Academy, Anne Arundel Community College, and the University of Maryland, Baltimore County.
Common Questions
What is Per Capita Income in Annapolis Neck?
Per Capita income in Annapolis Neck is $87,155.
What is the Median Family Income in Annapolis Neck?
Median Family Income in Annapolis Neck is $188,798.
What is the Median Household income in Annapolis Neck?
Median Household Income in Annapolis Neck is $161,859.
What is Income or Wage Gap in Annapolis Neck?
Income or Wage Gap in Annapolis Neck is 28.9%.
Women in Annapolis Neck earn 71.1 cents for every dollar earned by a man.
What is Inequality or Gini Index in Annapolis Neck?
Inequality or Gini Index in Annapolis Neck is 0.43.
What is the Total Population of Annapolis Neck?
Total Population of Annapolis Neck is 12,712.
What is the Total Male Population of Annapolis Neck?
Total Male Population of Annapolis Neck is 6,517.
What is the Total Female Population of Annapolis Neck?
Total Female Population of Annapolis Neck is 6,195.
What is the Ratio of Males per 100 Females in Annapolis Neck?
There are 105.20 Males per 100 Females in Annapolis Neck.
What is the Ratio of Females per 100 Males in Annapolis Neck?
There are 95.06 Females per 100 Males in Annapolis Neck.
What is the Median Population Age in Annapolis Neck?
Median Population Age in Annapolis Neck is 49.7 Years.
What is the Average Family Size in Annapolis Neck
Average Family Size in Annapolis Neck is 2.9 People.
What is the Average Household Size in Annapolis Neck
Average Household Size in Annapolis Neck is 2.5 People.
How Large is the Labor Force in Annapolis Neck?
There are 6,600 People in the Labor Forcein in Annapolis Neck.
What is the Percentage of People in the Labor Force in Annapolis Neck?
63.1% of People are in the Labor Force in Annapolis Neck.
What is the Unemployment Rate in Annapolis Neck?
Unemployment Rate in Annapolis Neck is 1.9%.