Cities with the Highest Percentage of Population Enrolled in College in the United States
RELATED REPORTS & OPTIONS
College
United States
Compare Cities
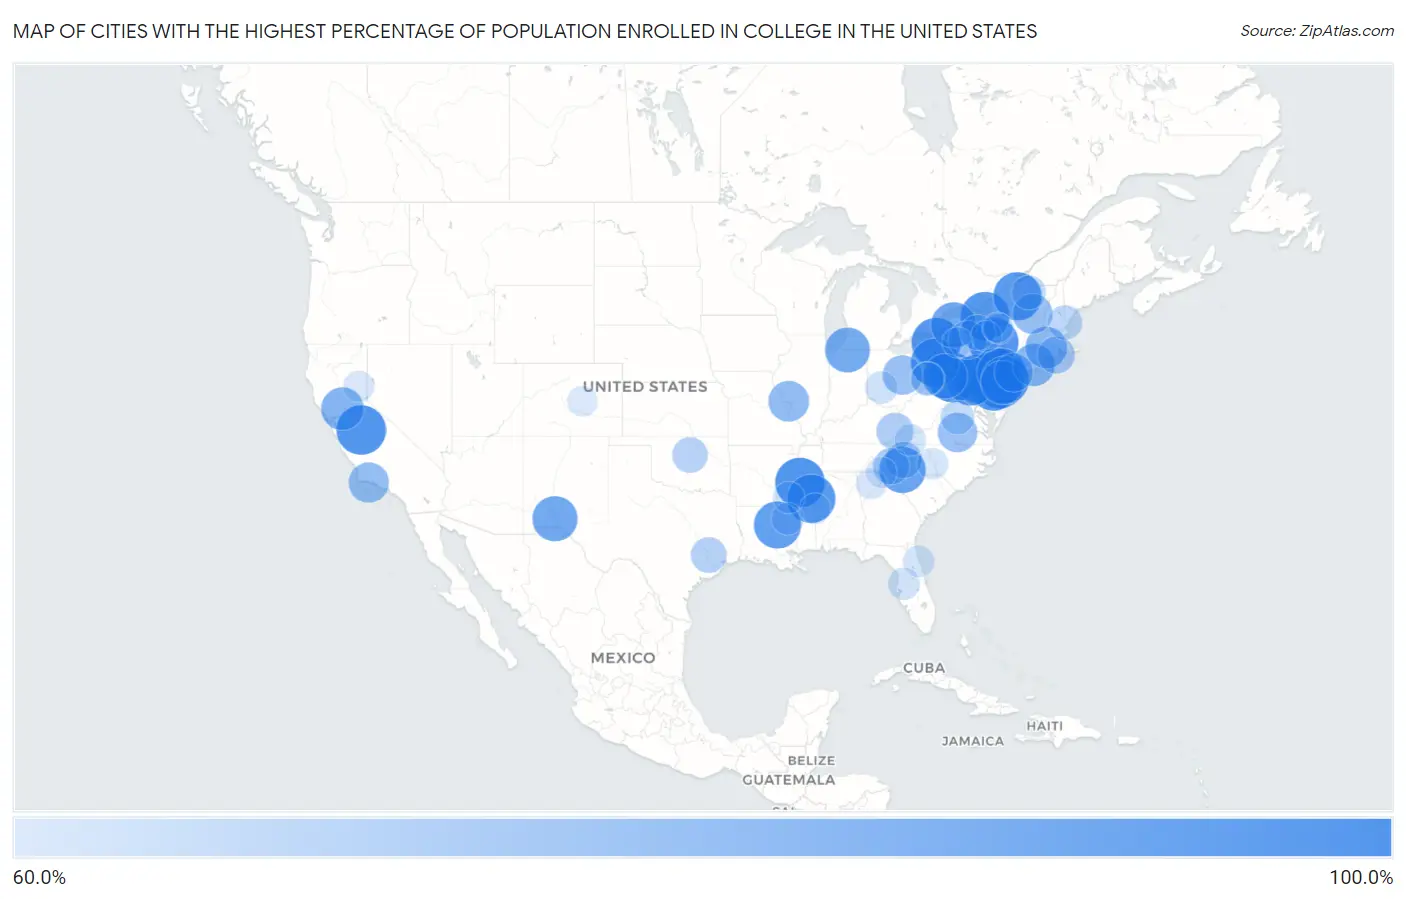
Map of Cities with the Highest Percentage of Population Enrolled in College in the United States
0.0%
100.0%
Cities with the Highest Percentage of Population Enrolled in College in the United States
| City | % in College | vs State | vs National | |
| 1. | Binghamton University | 100.0% | 5.7%(+94.3)#1 | 5.5%(+94.5)#1 |
| 2. | University | 100.0% | 5.5%(+94.5)#1 | 5.5%(+94.5)#2 |
| 3. | Marist College | 100.0% | 5.7%(+94.3)#2 | 5.5%(+94.5)#3 |
| 4. | University Of Pittsburgh Johnstown | 100.0% | 5.1%(+94.9)#1 | 5.5%(+94.5)#4 |
| 5. | University Of California Merced | 100.0% | 6.7%(+93.3)#1 | 5.5%(+94.5)#5 |
| 6. | University Of Pittsburgh Bradford | 100.0% | 5.1%(+94.9)#2 | 5.5%(+94.5)#6 |
| 7. | Kennesaw State University | 99.8% | 5.4%(+94.4)#1 | 5.5%(+94.3)#7 |
| 8. | Niagara University | 99.7% | 5.7%(+94.0)#3 | 5.5%(+94.2)#8 |
| 9. | St. John Fisher College | 99.5% | 5.7%(+93.8)#4 | 5.5%(+94.1)#9 |
| 10. | Penn State Erie Behrend | 99.5% | 5.1%(+94.4)#3 | 5.5%(+94.0)#10 |
| 11. | Cheyney University | 99.3% | 5.1%(+94.3)#4 | 5.5%(+93.9)#11 |
| 12. | Siena College | 99.1% | 5.7%(+93.4)#5 | 5.5%(+93.7)#12 |
| 13. | Messiah College | 99.1% | 5.1%(+94.0)#5 | 5.5%(+93.6)#13 |
| 14. | Fairfield University | 98.8% | 6.0%(+92.8)#1 | 5.5%(+93.4)#14 |
| 15. | William Paterson University Of New Jersey | 98.8% | 5.3%(+93.5)#1 | 5.5%(+93.3)#15 |
| 16. | Kutztown University | 98.7% | 5.1%(+93.6)#6 | 5.5%(+93.3)#16 |
| 17. | Lincoln University | 98.7% | 5.1%(+93.6)#7 | 5.5%(+93.2)#17 |
| 18. | Quinnipiac University | 98.7% | 6.0%(+92.7)#2 | 5.5%(+93.2)#18 |
| 19. | Hamilton College | 98.6% | 5.7%(+92.9)#6 | 5.5%(+93.1)#19 |
| 20. | Suny Oswego | 98.3% | 5.7%(+92.6)#7 | 5.5%(+92.9)#20 |
| 21. | Stockton University | 98.2% | 5.3%(+92.9)#2 | 5.5%(+92.8)#21 |
| 22. | Florida Gulf Coast University | 98.2% | 5.2%(+93.0)#1 | 5.5%(+92.7)#22 |
| 23. | Shippensburg University | 98.1% | 5.1%(+93.1)#8 | 5.5%(+92.7)#23 |
| 24. | Clemson University | 98.1% | 4.9%(+93.2)#1 | 5.5%(+92.6)#24 |
| 25. | Desales University | 98.0% | 5.1%(+92.9)#9 | 5.5%(+92.5)#25 |
| 26. | Penn State Berks | 98.0% | 5.1%(+92.9)#10 | 5.5%(+92.5)#26 |
| 27. | Mississippi State | 97.9% | 5.5%(+92.5)#2 | 5.5%(+92.5)#27 |
| 28. | Montclair State University | 97.7% | 5.3%(+92.4)#3 | 5.5%(+92.3)#28 |
| 29. | Paul Smiths | 97.6% | 5.7%(+91.9)#8 | 5.5%(+92.1)#29 |
| 30. | Slippery Rock University | 97.5% | 5.1%(+92.4)#11 | 5.5%(+92.0)#30 |
| 31. | California Polytechnic State University | 97.4% | 6.7%(+90.7)#2 | 5.5%(+92.0)#31 |
| 32. | Nazareth College | 97.3% | 5.7%(+91.6)#9 | 5.5%(+91.9)#32 |
| 33. | Arcadia University | 97.0% | 5.1%(+92.0)#12 | 5.5%(+91.6)#33 |
| 34. | Ramapo College Of New Jersey | 96.4% | 5.3%(+91.1)#4 | 5.5%(+91.0)#34 |
| 35. | Berry College | 96.4% | 5.4%(+91.0)#2 | 5.5%(+90.9)#35 |
| 36. | Crown College | 96.1% | 5.0%(+91.1)#1 | 5.5%(+90.6)#36 |
| 37. | The University Of Virginia's College At Wise | 95.8% | 5.7%(+90.2)#1 | 5.5%(+90.4)#37 |
| 38. | Alcorn State University | 95.6% | 5.5%(+90.2)#3 | 5.5%(+90.2)#38 |
| 39. | Rutgers University-Livingston Campus | 94.9% | 5.3%(+89.6)#5 | 5.5%(+89.5)#39 |
| 40. | Kean University | 94.8% | 5.3%(+89.5)#6 | 5.5%(+89.4)#40 |
| 41. | Tigerville | 93.9% | 4.9%(+89.0)#2 | 5.5%(+88.4)#41 |
| 42. | Sonoma State University | 93.4% | 6.7%(+86.7)#3 | 5.5%(+87.9)#42 |
| 43. | University At Buffalo | 92.5% | 5.7%(+86.8)#10 | 5.5%(+87.0)#43 |
| 44. | The College Of New Jersey | 91.9% | 5.3%(+86.6)#7 | 5.5%(+86.4)#44 |
| 45. | University Park | 91.8% | 5.4%(+86.4)#1 | 5.5%(+86.3)#45 |
| 46. | Sacred Heart University | 91.3% | 6.0%(+85.2)#3 | 5.5%(+85.8)#46 |
| 47. | Notre Dame | 91.2% | 5.0%(+86.1)#1 | 5.5%(+85.7)#47 |
| 48. | St Vincent College | 91.1% | 5.1%(+86.1)#13 | 5.5%(+85.7)#48 |
| 49. | Rochester Institute Of Technology | 90.7% | 5.7%(+85.0)#11 | 5.5%(+85.2)#49 |
| 50. | Bard College | 89.9% | 5.7%(+84.2)#12 | 5.5%(+84.4)#50 |
| 51. | Haverford College | 89.1% | 5.1%(+84.0)#14 | 5.5%(+83.6)#51 |
| 52. | Rutgers University-Busch Campus | 88.1% | 5.3%(+82.8)#8 | 5.5%(+82.7)#52 |
| 53. | University Of California Davis | 87.1% | 6.7%(+80.5)#4 | 5.5%(+81.7)#53 |
| 54. | Stony Brook University | 86.3% | 5.7%(+80.6)#13 | 5.5%(+80.9)#54 |
| 55. | Storrs | 85.1% | 6.0%(+79.0)#4 | 5.5%(+79.6)#55 |
| 56. | St. John's University | 84.7% | 5.0%(+79.8)#2 | 5.5%(+79.3)#56 |
| 57. | Vassar College | 84.7% | 5.7%(+79.0)#14 | 5.5%(+79.3)#57 |
| 58. | Elsah | 83.5% | 5.1%(+78.4)#1 | 5.5%(+78.0)#58 |
| 59. | Isla Vista | 82.7% | 6.7%(+76.0)#5 | 5.5%(+77.2)#59 |
| 60. | Castleton | 82.1% | 6.2%(+75.9)#1 | 5.5%(+76.6)#60 |
| 61. | Loretto Borough | 81.9% | 5.1%(+76.9)#15 | 5.5%(+76.5)#61 |
| 62. | Gambier | 81.5% | 4.9%(+76.6)#1 | 5.5%(+76.0)#62 |
| 63. | Misericordia University | 81.4% | 5.1%(+76.3)#16 | 5.5%(+75.9)#63 |
| 64. | Hampden Sydney | 81.2% | 5.7%(+75.5)#2 | 5.5%(+75.7)#64 |
| 65. | Zarephath | 79.7% | 5.3%(+74.4)#9 | 5.5%(+74.3)#65 |
| 66. | Pepperdine University | 79.1% | 6.7%(+72.4)#6 | 5.5%(+73.7)#66 |
| 67. | Alfred | 78.8% | 5.7%(+73.1)#15 | 5.5%(+73.4)#67 |
| 68. | Kingston | 77.0% | 7.1%(+69.9)#1 | 5.5%(+71.5)#68 |
| 69. | Pippa Passes | 76.6% | 4.6%(+72.0)#1 | 5.5%(+71.1)#69 |
| 70. | Montreat | 75.8% | 5.5%(+70.3)#1 | 5.5%(+70.3)#70 |
| 71. | Cullowhee | 75.6% | 5.5%(+70.1)#2 | 5.5%(+70.1)#71 |
| 72. | University Of California-Santa Barbara | 75.4% | 6.7%(+68.7)#7 | 5.5%(+69.9)#72 |
| 73. | Prairie View | 74.3% | 5.4%(+68.9)#1 | 5.5%(+68.8)#73 |
| 74. | Langston | 74.2% | 5.1%(+69.1)#1 | 5.5%(+68.8)#74 |
| 75. | Acala | 74.2% | 5.4%(+68.8)#2 | 5.5%(+68.7)#75 |
| 76. | Keuka Park | 73.4% | 5.7%(+67.7)#16 | 5.5%(+68.0)#76 |
| 77. | Durham | 72.1% | 4.9%(+67.1)#1 | 5.5%(+66.6)#77 |
| 78. | Floral | 72.0% | 4.7%(+67.3)#1 | 5.5%(+66.5)#78 |
| 79. | Parc | 71.3% | 5.7%(+65.7)#17 | 5.5%(+65.9)#79 |
| 80. | West Liberty | 71.1% | 4.3%(+66.8)#1 | 5.5%(+65.7)#80 |
| 81. | University Of Virginia | 70.7% | 5.7%(+65.0)#3 | 5.5%(+65.3)#81 |
| 82. | Bethany | 68.7% | 4.3%(+64.4)#2 | 5.5%(+63.3)#82 |
| 83. | Wilberforce | 68.2% | 4.9%(+63.3)#2 | 5.5%(+62.7)#83 |
| 84. | Janesville | 68.2% | 5.1%(+63.1)#2 | 5.5%(+62.7)#84 |
| 85. | Raymond | 67.5% | 5.5%(+62.1)#4 | 5.5%(+62.1)#85 |
| 86. | St Leo | 67.5% | 5.2%(+62.3)#2 | 5.5%(+62.1)#86 |
| 87. | Villanova | 67.1% | 5.1%(+62.1)#17 | 5.5%(+61.7)#87 |
| 88. | Emory | 66.7% | 5.7%(+61.0)#4 | 5.5%(+61.3)#88 |
| 89. | Mississippi Valley State University | 66.7% | 5.5%(+61.2)#5 | 5.5%(+61.2)#89 |
| 90. | Marineland | 66.7% | 5.2%(+61.4)#3 | 5.5%(+61.2)#90 |
| 91. | Misenheimer | 66.5% | 5.5%(+61.0)#3 | 5.5%(+61.0)#91 |
| 92. | Valley Ranch | 65.9% | 6.7%(+59.2)#8 | 5.5%(+60.4)#92 |
| 93. | Waleska | 65.7% | 5.4%(+60.3)#3 | 5.5%(+60.2)#93 |
| 94. | Scooba | 65.5% | 5.5%(+60.1)#6 | 5.5%(+60.1)#94 |
| 95. | Young Harris | 65.4% | 5.4%(+59.9)#4 | 5.5%(+59.9)#95 |
| 96. | South Hill | 65.3% | 5.7%(+59.7)#18 | 5.5%(+59.9)#96 |
| 97. | Air Force Academy | 64.9% | 5.3%(+59.6)#1 | 5.5%(+59.5)#97 |
| 98. | St Bonaventure | 64.6% | 5.7%(+58.9)#19 | 5.5%(+59.2)#98 |
| 99. | Hamilton | 64.6% | 5.7%(+58.9)#20 | 5.5%(+59.1)#99 |
| 100. | Morrisville | 64.5% | 5.7%(+58.8)#21 | 5.5%(+59.1)#100 |
Common Questions
What are the Top 10 Cities with the Highest Percentage of Population Enrolled in College in the United States?
Top 10 Cities with the Highest Percentage of Population Enrolled in College in the United States are:
#1
100.0%
#2
100.0%
#3
100.0%
#4
100.0%
#5
99.5%
#6
99.3%
#7
99.1%
#8
98.7%
#9
98.7%
#10
98.3%
What city has the Highest Percentage of Population Enrolled in College in the United States?
Binghamton University has the Highest Percentage of Population Enrolled in College in the United States with 100.0%.
What is the Percentage of Population Enrolled in College in the United States?
Percentage of Population Enrolled in College in the United States is 5.5%.