Cities with the Largest Bolivian Community in the United States
RELATED REPORTS & OPTIONS
Bolivian
United States
Compare Cities
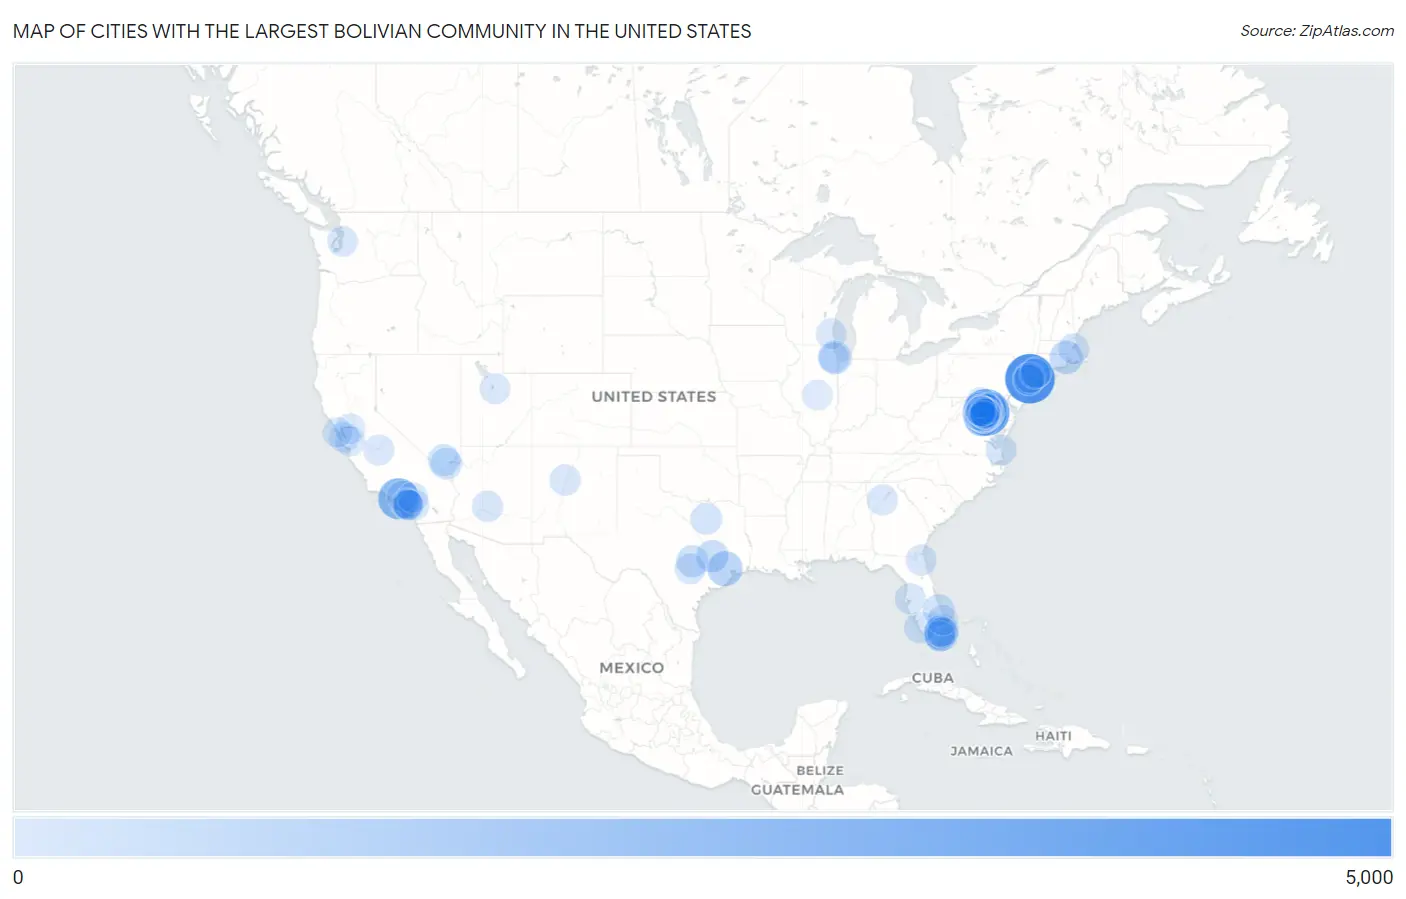
Map of Cities with the Largest Bolivian Community in the United States
0
5,000
Cities with the Largest Bolivian Community in the United States
| City | Bolivian | vs State | vs National | |
| 1. | New York | 4,113 | 7,994(51.45%)#1 | 128,584(3.20%)#1 |
| 2. | Arlington | 3,460 | 37,877(9.13%)#1 | 128,584(2.69%)#2 |
| 3. | West Falls Church | 2,968 | 37,877(7.84%)#2 | 128,584(2.31%)#3 |
| 4. | Los Angeles | 2,347 | 15,591(15.05%)#1 | 128,584(1.83%)#4 |
| 5. | Annandale | 1,865 | 37,877(4.92%)#3 | 128,584(1.45%)#5 |
| 6. | Dale City | 1,670 | 37,877(4.41%)#4 | 128,584(1.30%)#6 |
| 7. | Germantown | 1,401 | 10,899(12.85%)#1 | 128,584(1.09%)#7 |
| 8. | Burke | 1,310 | 37,877(3.46%)#5 | 128,584(1.02%)#8 |
| 9. | Centreville | 1,304 | 37,877(3.44%)#6 | 128,584(1.01%)#9 |
| 10. | Sterling | 1,260 | 37,877(3.33%)#7 | 128,584(0.98%)#10 |
| 11. | Houston | 1,136 | 6,872(16.53%)#1 | 128,584(0.88%)#11 |
| 12. | Miami | 1,080 | 15,621(6.91%)#1 | 128,584(0.84%)#12 |
| 13. | Alexandria | 995 | 37,877(2.63%)#8 | 128,584(0.77%)#13 |
| 14. | Chicago | 811 | 3,252(24.94%)#1 | 128,584(0.63%)#14 |
| 15. | Providence | 808 | 1,849(43.70%)#1 | 128,584(0.63%)#15 |
| 16. | Washington | 794 | 794(100.00%)#1 | 128,584(0.62%)#16 |
| 17. | Bailey S Crossroads | 756 | 37,877(2.00%)#9 | 128,584(0.59%)#17 |
| 18. | Lake Ridge | 753 | 37,877(1.99%)#10 | 128,584(0.59%)#18 |
| 19. | Lincolnia | 673 | 37,877(1.78%)#11 | 128,584(0.52%)#19 |
| 20. | Gaithersburg | 655 | 10,899(6.01%)#2 | 128,584(0.51%)#20 |
| 21. | College Station | 654 | 6,872(9.52%)#2 | 128,584(0.51%)#21 |
| 22. | Austin | 623 | 6,872(9.07%)#3 | 128,584(0.48%)#22 |
| 23. | Springfield | 600 | 37,877(1.58%)#12 | 128,584(0.47%)#23 |
| 24. | Leesburg | 580 | 37,877(1.53%)#13 | 128,584(0.45%)#24 |
| 25. | Sugarland Run | 579 | 37,877(1.53%)#14 | 128,584(0.45%)#25 |
| 26. | Aspen Hill | 577 | 10,899(5.29%)#3 | 128,584(0.45%)#26 |
| 27. | Hollywood | 559 | 15,621(3.58%)#2 | 128,584(0.43%)#27 |
| 28. | Fairfax | 524 | 37,877(1.38%)#15 | 128,584(0.41%)#28 |
| 29. | Doral | 523 | 15,621(3.35%)#3 | 128,584(0.41%)#29 |
| 30. | Las Vegas | 508 | 1,414(35.93%)#1 | 128,584(0.40%)#30 |
| 31. | Reston | 505 | 37,877(1.33%)#16 | 128,584(0.39%)#31 |
| 32. | Golden Gate | 498 | 15,621(3.19%)#4 | 128,584(0.39%)#32 |
| 33. | Port St Lucie | 497 | 15,621(3.18%)#5 | 128,584(0.39%)#33 |
| 34. | Wheaton | 492 | 10,899(4.51%)#4 | 128,584(0.38%)#34 |
| 35. | Idylwood | 492 | 37,877(1.30%)#17 | 128,584(0.38%)#35 |
| 36. | County Center | 482 | 37,877(1.27%)#18 | 128,584(0.37%)#36 |
| 37. | Henderson | 474 | 1,414(33.52%)#2 | 128,584(0.37%)#37 |
| 38. | Dallas | 465 | 6,872(6.77%)#4 | 128,584(0.36%)#38 |
| 39. | Redland | 465 | 10,899(4.27%)#5 | 128,584(0.36%)#39 |
| 40. | Silver Spring | 450 | 10,899(4.13%)#6 | 128,584(0.35%)#40 |
| 41. | Chantilly | 438 | 37,877(1.16%)#19 | 128,584(0.34%)#41 |
| 42. | Jersey City | 435 | 5,536(7.86%)#1 | 128,584(0.34%)#42 |
| 43. | West Springfield | 425 | 37,877(1.12%)#20 | 128,584(0.33%)#43 |
| 44. | Miramar | 423 | 15,621(2.71%)#6 | 128,584(0.33%)#44 |
| 45. | Manassas | 420 | 37,877(1.11%)#21 | 128,584(0.33%)#45 |
| 46. | Santa Ana | 418 | 15,591(2.68%)#2 | 128,584(0.33%)#46 |
| 47. | Pasadena | 415 | 15,591(2.66%)#3 | 128,584(0.32%)#47 |
| 48. | North Bethesda | 414 | 10,899(3.80%)#7 | 128,584(0.32%)#48 |
| 49. | South Riding | 405 | 37,877(1.07%)#22 | 128,584(0.31%)#49 |
| 50. | Rockville | 392 | 10,899(3.60%)#8 | 128,584(0.30%)#50 |
| 51. | Phoenix | 386 | 846(45.63%)#1 | 128,584(0.30%)#51 |
| 52. | Burke Centre | 381 | 37,877(1.01%)#23 | 128,584(0.30%)#52 |
| 53. | Albuquerque | 380 | 463(82.07%)#1 | 128,584(0.30%)#53 |
| 54. | Virginia Beach | 370 | 37,877(0.98%)#24 | 128,584(0.29%)#54 |
| 55. | Lake Elsinore | 367 | 15,591(2.35%)#4 | 128,584(0.29%)#55 |
| 56. | Tampa | 366 | 15,621(2.34%)#7 | 128,584(0.28%)#56 |
| 57. | Jacksonville | 357 | 15,621(2.29%)#8 | 128,584(0.28%)#57 |
| 58. | Irvine | 354 | 15,591(2.27%)#5 | 128,584(0.28%)#58 |
| 59. | San Marcos | 354 | 6,872(5.15%)#5 | 128,584(0.28%)#59 |
| 60. | Fair Oaks | 348 | 37,877(0.92%)#25 | 128,584(0.27%)#60 |
| 61. | Kendall | 346 | 15,621(2.21%)#9 | 128,584(0.27%)#61 |
| 62. | Loch Lomond | 345 | 37,877(0.91%)#26 | 128,584(0.27%)#62 |
| 63. | Boston | 343 | 1,671(20.53%)#1 | 128,584(0.27%)#63 |
| 64. | Potomac Mills | 339 | 37,877(0.90%)#27 | 128,584(0.26%)#64 |
| 65. | Pimmit Hills | 339 | 37,877(0.90%)#28 | 128,584(0.26%)#65 |
| 66. | Hybla Valley | 336 | 37,877(0.89%)#29 | 128,584(0.26%)#66 |
| 67. | Oakton | 326 | 37,877(0.86%)#30 | 128,584(0.25%)#67 |
| 68. | Bull Run | 325 | 37,877(0.86%)#31 | 128,584(0.25%)#68 |
| 69. | Glassmanor | 319 | 10,899(2.93%)#9 | 128,584(0.25%)#69 |
| 70. | Bayonne | 314 | 5,536(5.67%)#2 | 128,584(0.24%)#70 |
| 71. | Fresno | 313 | 15,591(2.01%)#6 | 128,584(0.24%)#71 |
| 72. | Milwaukee | 311 | 609(51.07%)#1 | 128,584(0.24%)#72 |
| 73. | Union City | 310 | 5,536(5.60%)#3 | 128,584(0.24%)#73 |
| 74. | Greenacres | 301 | 15,621(1.93%)#10 | 128,584(0.23%)#74 |
| 75. | Springville | 298 | 1,644(18.13%)#1 | 128,584(0.23%)#75 |
| 76. | North Bay Village | 293 | 15,621(1.88%)#11 | 128,584(0.23%)#76 |
| 77. | Stamford | 290 | 1,382(20.98%)#1 | 128,584(0.23%)#77 |
| 78. | Woodbridge | 290 | 37,877(0.77%)#32 | 128,584(0.23%)#78 |
| 79. | Leisure World | 290 | 10,899(2.66%)#10 | 128,584(0.23%)#79 |
| 80. | Seattle | 287 | 1,391(20.63%)#1 | 128,584(0.22%)#80 |
| 81. | Sandy Springs | 280 | 1,296(21.60%)#1 | 128,584(0.22%)#81 |
| 82. | Fontana | 275 | 15,591(1.76%)#7 | 128,584(0.21%)#82 |
| 83. | North Springfield | 269 | 37,877(0.71%)#33 | 128,584(0.21%)#83 |
| 84. | Decatur | 256 | 3,252(7.87%)#2 | 128,584(0.20%)#84 |
| 85. | Redwood City | 255 | 15,591(1.64%)#8 | 128,584(0.20%)#85 |
| 86. | Frederick | 252 | 10,899(2.31%)#11 | 128,584(0.20%)#86 |
| 87. | Severn | 252 | 10,899(2.31%)#12 | 128,584(0.20%)#87 |
| 88. | Ashburn | 251 | 37,877(0.66%)#34 | 128,584(0.20%)#88 |
| 89. | San Jose | 249 | 15,591(1.60%)#9 | 128,584(0.19%)#89 |
| 90. | Herndon | 249 | 37,877(0.66%)#35 | 128,584(0.19%)#90 |
| 91. | Lyons | 244 | 3,252(7.50%)#3 | 128,584(0.19%)#91 |
| 92. | Antioch | 241 | 15,591(1.55%)#10 | 128,584(0.19%)#92 |
| 93. | Seven Corners | 241 | 37,877(0.64%)#36 | 128,584(0.19%)#93 |
| 94. | Lorton | 237 | 37,877(0.63%)#37 | 128,584(0.18%)#94 |
| 95. | San Francisco | 233 | 15,591(1.49%)#11 | 128,584(0.18%)#95 |
| 96. | Tustin | 232 | 15,591(1.49%)#12 | 128,584(0.18%)#96 |
| 97. | Lake Forest | 230 | 15,591(1.48%)#13 | 128,584(0.18%)#97 |
| 98. | Port Chester | 230 | 7,994(2.88%)#2 | 128,584(0.18%)#98 |
| 99. | Lake Barcroft | 227 | 37,877(0.60%)#38 | 128,584(0.18%)#99 |
| 100. | Oak Grove | 226 | 37,877(0.60%)#39 | 128,584(0.18%)#100 |
Common Questions
What are the Top 10 Cities with the Largest Bolivian Community in the United States?
Top 10 Cities with the Largest Bolivian Community in the United States are:
#1
4,113
#2
3,460
#3
2,968
#4
2,347
#5
1,865
#6
1,670
#7
1,401
#8
1,310
#9
1,304
#10
1,260
What city has the Largest Bolivian Community in the United States?
New York has the Largest Bolivian Community in the United States with 4,113.
What is the Total Bolivian Population in the United States?
Total Bolivian Population in the United States is 128,584.