Cities with the Highest Percentage of Sierra Leonean Population in the United States
RELATED REPORTS & OPTIONS
Sierra Leonean
United States
Compare Cities
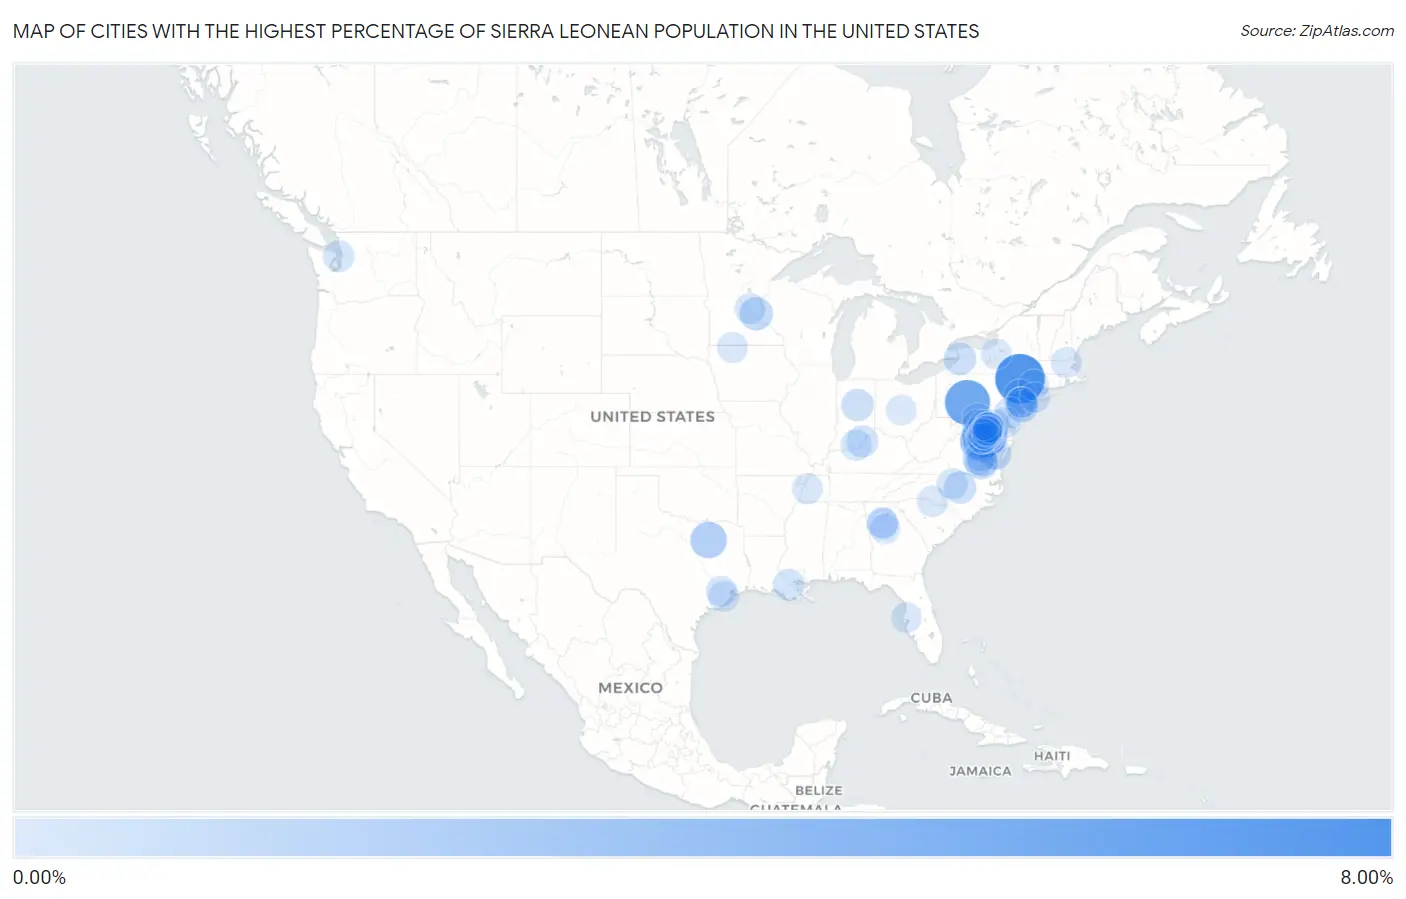
Map of Cities with the Highest Percentage of Sierra Leonean Population in the United States
0.00%
8.00%
Cities with the Highest Percentage of Sierra Leonean Population in the United States
| City | Sierra Leonean | vs State | vs National | |
| 1. | Loch Sheldrake | 7.52% | 0.011%(+7.51)#1 | 0.010%(+7.51)#1 |
| 2. | Greenwood | 5.81% | 0.022%(+5.79)#1 | 0.010%(+5.80)#2 |
| 3. | Hybla Valley | 5.54% | 0.068%(+5.47)#1 | 0.010%(+5.53)#3 |
| 4. | Sharon Hill Borough | 4.65% | 0.022%(+4.63)#2 | 0.010%(+4.64)#4 |
| 5. | Stafford Courthouse | 3.72% | 0.068%(+3.65)#2 | 0.010%(+3.71)#5 |
| 6. | Aldan Borough | 3.64% | 0.022%(+3.62)#3 | 0.010%(+3.63)#6 |
| 7. | Lake Arbor | 2.89% | 0.10%(+2.78)#1 | 0.010%(+2.88)#7 |
| 8. | Travis Ranch | 2.50% | 0.0082%(+2.49)#1 | 0.010%(+2.49)#8 |
| 9. | Seabrook | 2.01% | 0.10%(+1.91)#2 | 0.010%(+2.00)#9 |
| 10. | Woodlawn Cdp Prince George S County | 1.77% | 0.10%(+1.67)#3 | 0.010%(+1.76)#10 |
| 11. | Glenn Dale | 1.65% | 0.10%(+1.55)#4 | 0.010%(+1.64)#11 |
| 12. | Fort Lee | 1.45% | 0.068%(+1.38)#3 | 0.010%(+1.44)#12 |
| 13. | New Brighton | 1.44% | 0.016%(+1.42)#1 | 0.010%(+1.43)#13 |
| 14. | Succasunna | 1.42% | 0.023%(+1.40)#1 | 0.010%(+1.41)#14 |
| 15. | Travilah | 1.38% | 0.10%(+1.28)#5 | 0.010%(+1.37)#15 |
| 16. | Springdale | 1.33% | 0.10%(+1.23)#6 | 0.010%(+1.32)#16 |
| 17. | Lawnside Borough | 1.31% | 0.023%(+1.28)#2 | 0.010%(+1.30)#17 |
| 18. | Largo | 1.28% | 0.10%(+1.18)#7 | 0.010%(+1.27)#18 |
| 19. | Yeadon Borough | 1.27% | 0.022%(+1.25)#4 | 0.010%(+1.26)#19 |
| 20. | Franklin Park | 1.13% | 0.023%(+1.11)#3 | 0.010%(+1.12)#20 |
| 21. | Lackawanna | 1.11% | 0.011%(+1.10)#2 | 0.010%(+1.10)#21 |
| 22. | Kilmarnock | 1.09% | 0.068%(+1.02)#4 | 0.010%(+1.08)#22 |
| 23. | Morrisville | 1.05% | 0.010%(+1.04)#1 | 0.010%(+1.04)#23 |
| 24. | Fairmount Heights | 1.01% | 0.10%(+0.904)#8 | 0.010%(+0.996)#24 |
| 25. | Marlboro Village | 1.00% | 0.10%(+0.894)#9 | 0.010%(+0.987)#25 |
| 26. | Sharpsville | 1.00% | 0.0038%(+0.992)#1 | 0.010%(+0.985)#26 |
| 27. | Cheverly | 0.98% | 0.10%(+0.875)#10 | 0.010%(+0.968)#27 |
| 28. | Maryland City | 0.96% | 0.10%(+0.856)#11 | 0.010%(+0.949)#28 |
| 29. | Collingdale Borough | 0.96% | 0.022%(+0.937)#5 | 0.010%(+0.948)#29 |
| 30. | Whittingham | 0.95% | 0.023%(+0.926)#4 | 0.010%(+0.939)#30 |
| 31. | Fairland | 0.93% | 0.10%(+0.828)#12 | 0.010%(+0.921)#31 |
| 32. | Newington Forest | 0.93% | 0.068%(+0.857)#5 | 0.010%(+0.915)#32 |
| 33. | Lorton | 0.92% | 0.068%(+0.848)#6 | 0.010%(+0.906)#33 |
| 34. | Meadowbrook | 0.87% | 0.068%(+0.800)#7 | 0.010%(+0.858)#34 |
| 35. | Bowie | 0.81% | 0.10%(+0.703)#13 | 0.010%(+0.796)#35 |
| 36. | Clifton Heights Borough | 0.79% | 0.022%(+0.769)#6 | 0.010%(+0.780)#36 |
| 37. | Union | 0.78% | 0.00009%(+0.783)#1 | 0.010%(+0.772)#37 |
| 38. | Charlestown | 0.78% | 0.0038%(+0.773)#2 | 0.010%(+0.766)#38 |
| 39. | Rosaryville | 0.72% | 0.10%(+0.612)#14 | 0.010%(+0.705)#39 |
| 40. | Calverton | 0.71% | 0.10%(+0.612)#15 | 0.010%(+0.705)#40 |
| 41. | Port Gamble Tribal Community | 0.71% | 0.0023%(+0.704)#1 | 0.010%(+0.695)#41 |
| 42. | East Lansdowne Borough | 0.70% | 0.022%(+0.681)#7 | 0.010%(+0.693)#42 |
| 43. | Leesylvania | 0.68% | 0.068%(+0.610)#8 | 0.010%(+0.668)#43 |
| 44. | Corydon | 0.67% | 0.0038%(+0.662)#3 | 0.010%(+0.656)#44 |
| 45. | Temple Hills | 0.66% | 0.10%(+0.559)#16 | 0.010%(+0.651)#45 |
| 46. | Fredericksburg | 0.64% | 0.068%(+0.569)#9 | 0.010%(+0.627)#46 |
| 47. | Burnt Mills | 0.63% | 0.10%(+0.530)#17 | 0.010%(+0.622)#47 |
| 48. | Glenarden | 0.63% | 0.10%(+0.528)#18 | 0.010%(+0.621)#48 |
| 49. | Essex | 0.61% | 0.10%(+0.504)#19 | 0.010%(+0.597)#49 |
| 50. | Ten Mile Creek | 0.61% | 0.10%(+0.502)#20 | 0.010%(+0.595)#50 |
| 51. | Lovettsville | 0.60% | 0.068%(+0.532)#10 | 0.010%(+0.590)#51 |
| 52. | North Laurel | 0.58% | 0.10%(+0.479)#21 | 0.010%(+0.571)#52 |
| 53. | East Franklin | 0.57% | 0.023%(+0.546)#5 | 0.010%(+0.559)#53 |
| 54. | Alexandria | 0.57% | 0.068%(+0.498)#11 | 0.010%(+0.556)#54 |
| 55. | Woodbridge | 0.57% | 0.068%(+0.497)#12 | 0.010%(+0.555)#55 |
| 56. | Sandy Point | 0.56% | 0.0082%(+0.550)#2 | 0.010%(+0.548)#56 |
| 57. | Graham | 0.55% | 0.010%(+0.544)#2 | 0.010%(+0.544)#57 |
| 58. | Smithsburg | 0.53% | 0.10%(+0.425)#22 | 0.010%(+0.518)#58 |
| 59. | Weddington | 0.52% | 0.010%(+0.514)#3 | 0.010%(+0.513)#59 |
| 60. | Panthersville | 0.52% | 0.0091%(+0.513)#1 | 0.010%(+0.512)#60 |
| 61. | Lake Carmel | 0.52% | 0.011%(+0.508)#3 | 0.010%(+0.509)#61 |
| 62. | Elk River | 0.51% | 0.016%(+0.489)#2 | 0.010%(+0.495)#62 |
| 63. | Ripley | 0.50% | 0.0011%(+0.499)#1 | 0.010%(+0.490)#63 |
| 64. | Hightstown Borough | 0.49% | 0.023%(+0.471)#6 | 0.010%(+0.484)#64 |
| 65. | Estherville | 0.49% | 0.0020%(+0.491)#1 | 0.010%(+0.483)#65 |
| 66. | Drexel Hill | 0.47% | 0.022%(+0.451)#8 | 0.010%(+0.462)#66 |
| 67. | Highland Springs | 0.45% | 0.068%(+0.382)#13 | 0.010%(+0.440)#67 |
| 68. | Darby Borough | 0.45% | 0.022%(+0.428)#9 | 0.010%(+0.439)#68 |
| 69. | Dale City | 0.45% | 0.068%(+0.377)#14 | 0.010%(+0.435)#69 |
| 70. | Middletown | 0.44% | 0.025%(+0.412)#1 | 0.010%(+0.427)#70 |
| 71. | North Decatur | 0.44% | 0.0091%(+0.427)#2 | 0.010%(+0.426)#71 |
| 72. | Kettering | 0.43% | 0.10%(+0.329)#23 | 0.010%(+0.422)#72 |
| 73. | Landover | 0.43% | 0.10%(+0.327)#24 | 0.010%(+0.419)#73 |
| 74. | Mission Bend | 0.43% | 0.0082%(+0.420)#3 | 0.010%(+0.418)#74 |
| 75. | Reston | 0.42% | 0.068%(+0.355)#15 | 0.010%(+0.413)#75 |
| 76. | Fairmount | 0.42% | 0.011%(+0.410)#4 | 0.010%(+0.411)#76 |
| 77. | Lowell | 0.41% | 0.018%(+0.397)#1 | 0.010%(+0.404)#77 |
| 78. | Mcdonough | 0.41% | 0.0091%(+0.396)#3 | 0.010%(+0.395)#78 |
| 79. | Edmonston | 0.40% | 0.10%(+0.297)#25 | 0.010%(+0.389)#79 |
| 80. | Cherry Hill | 0.39% | 0.068%(+0.323)#16 | 0.010%(+0.381)#80 |
| 81. | District Heights | 0.39% | 0.10%(+0.286)#26 | 0.010%(+0.379)#81 |
| 82. | Lincolnia | 0.39% | 0.068%(+0.320)#17 | 0.010%(+0.378)#82 |
| 83. | Hopewell | 0.39% | 0.068%(+0.318)#18 | 0.010%(+0.376)#83 |
| 84. | Indian Head | 0.38% | 0.10%(+0.278)#27 | 0.010%(+0.371)#84 |
| 85. | Chester Heights Borough | 0.38% | 0.022%(+0.358)#10 | 0.010%(+0.369)#85 |
| 86. | Columbia | 0.38% | 0.10%(+0.275)#28 | 0.010%(+0.368)#86 |
| 87. | Westerville | 0.37% | 0.017%(+0.355)#1 | 0.010%(+0.362)#87 |
| 88. | Somerset | 0.37% | 0.023%(+0.348)#7 | 0.010%(+0.361)#88 |
| 89. | Brookville | 0.37% | 0.011%(+0.357)#5 | 0.010%(+0.358)#89 |
| 90. | New Carrollton | 0.36% | 0.10%(+0.258)#29 | 0.010%(+0.350)#90 |
| 91. | Triangle | 0.36% | 0.068%(+0.290)#19 | 0.010%(+0.348)#91 |
| 92. | Westchase | 0.36% | 0.0028%(+0.355)#1 | 0.010%(+0.347)#92 |
| 93. | Jessup | 0.34% | 0.10%(+0.241)#30 | 0.010%(+0.333)#93 |
| 94. | Waldorf | 0.33% | 0.10%(+0.230)#31 | 0.010%(+0.323)#94 |
| 95. | Fort Washington | 0.33% | 0.10%(+0.230)#32 | 0.010%(+0.323)#95 |
| 96. | Savage | 0.33% | 0.10%(+0.229)#33 | 0.010%(+0.322)#96 |
| 97. | Chillum | 0.32% | 0.10%(+0.217)#34 | 0.010%(+0.310)#97 |
| 98. | Damascus | 0.30% | 0.10%(+0.200)#35 | 0.010%(+0.292)#98 |
| 99. | Bailey S Crossroads | 0.29% | 0.068%(+0.222)#20 | 0.010%(+0.280)#99 |
| 100. | Beltsville | 0.28% | 0.10%(+0.181)#36 | 0.010%(+0.274)#100 |
Common Questions
What are the Top 10 Cities with the Highest Percentage of Sierra Leonean Population in the United States?
Top 10 Cities with the Highest Percentage of Sierra Leonean Population in the United States are:
#1
7.52%
#2
5.81%
#3
5.54%
#4
3.72%
#5
2.89%
#6
2.50%
#7
2.01%
#8
1.65%
#9
1.45%
#10
1.44%
What city has the Highest Percentage of Sierra Leonean Population in the United States?
Loch Sheldrake has the Highest Percentage of Sierra Leonean Population in the United States with 7.52%.
What is the Percentage of Sierra Leonean Population in the United States?
Percentage of Sierra Leonean Population in the United States is 0.010%.