St Augustine Beach, FL Map & Demographics
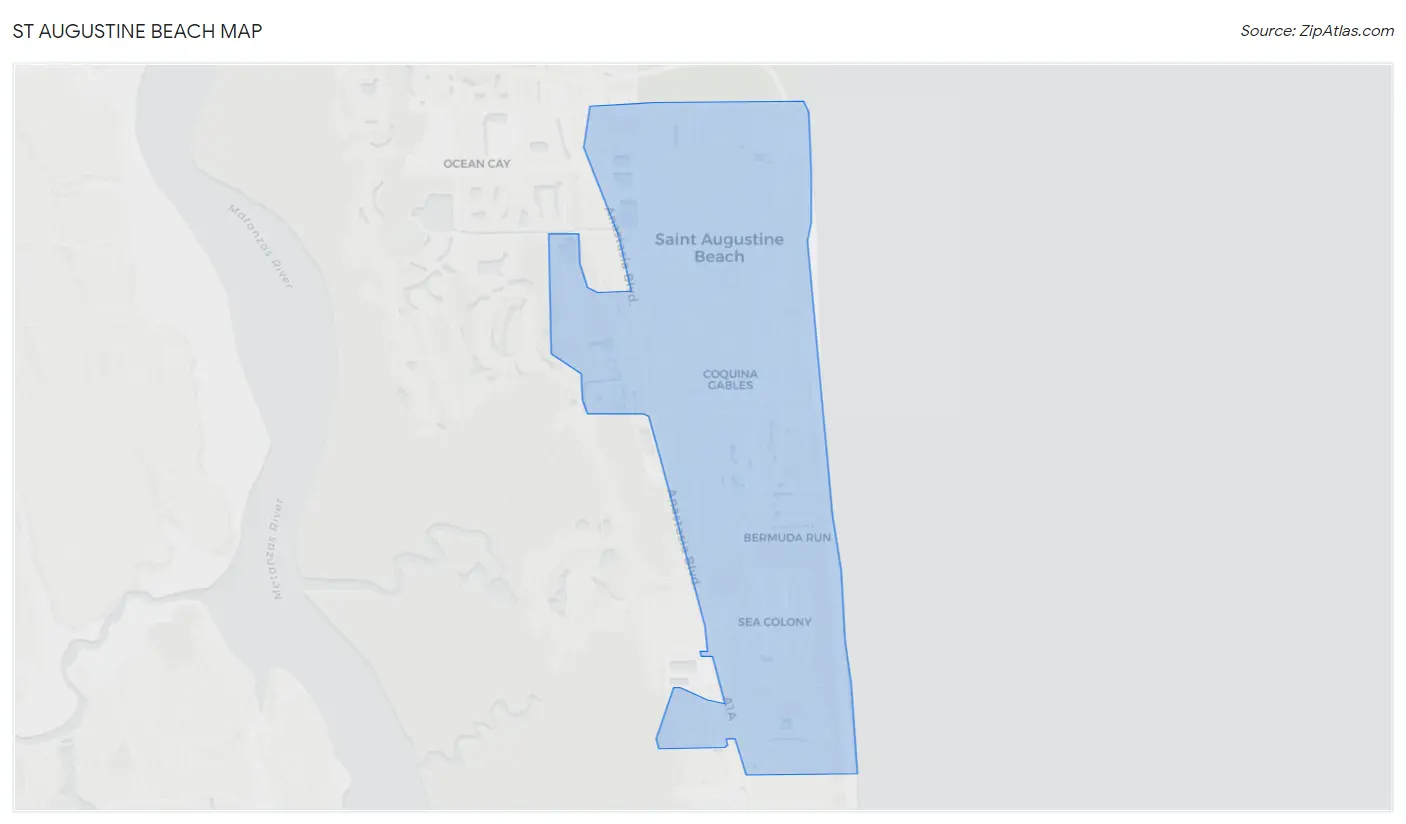
St Augustine Beach Map
St Augustine Beach Overview
$62,440
PER CAPITA INCOME
$125,208
AVG FAMILY INCOME
$87,019
AVG HOUSEHOLD INCOME
36.9%
WAGE / INCOME GAP [ % ]
63.1¢/ $1
WAGE / INCOME GAP [ $ ]
$12,578
FAMILY INCOME DEFICIT
0.50
INEQUALITY / GINI INDEX
6,774
TOTAL POPULATION
3,342
MALE POPULATION
3,432
FEMALE POPULATION
97.38
MALES / 100 FEMALES
102.69
FEMALES / 100 MALES
54.1
MEDIAN AGE
2.8
AVG FAMILY SIZE
2.2
AVG HOUSEHOLD SIZE
3,012
LABOR FORCE [ PEOPLE ]
51.6%
PERCENT IN LABOR FORCE
8.1%
UNEMPLOYMENT RATE
St Augustine Beach Area Codes
Income in St Augustine Beach
Income Overview in St Augustine Beach
Per Capita Income in St Augustine Beach is $62,440, while median incomes of families and households are $125,208 and $87,019 respectively.
| Characteristic | Number | Measure |
| Per Capita Income | 6,774 | $62,440 |
| Median Family Income | 1,857 | $125,208 |
| Mean Family Income | 1,857 | $161,039 |
| Median Household Income | 3,047 | $87,019 |
| Mean Household Income | 3,047 | $134,617 |
| Income Deficit | 1,857 | $12,578 |
| Wage / Income Gap (%) | 6,774 | 36.92% |
| Wage / Income Gap ($) | 6,774 | 63.08¢ per $1 |
| Gini / Inequality Index | 6,774 | 0.50 |
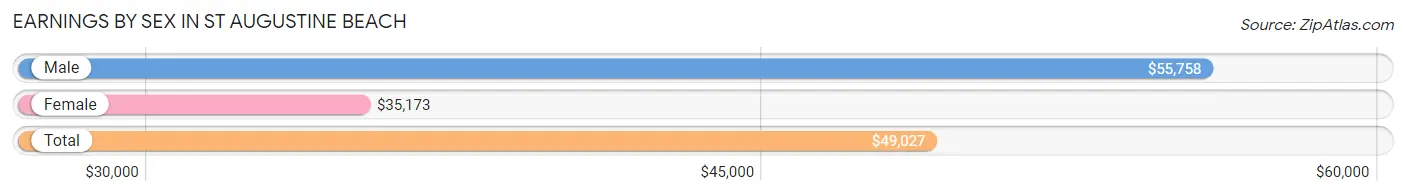
Earnings by Sex in St Augustine Beach
Average Earnings in St Augustine Beach are $49,027, $55,758 for men and $35,173 for women, a difference of 36.9%.
| Sex | Number | Average Earnings |
| Male | 1,896 (58.2%) | $55,758 |
| Female | 1,361 (41.8%) | $35,173 |
| Total | 3,257 (100.0%) | $49,027 |
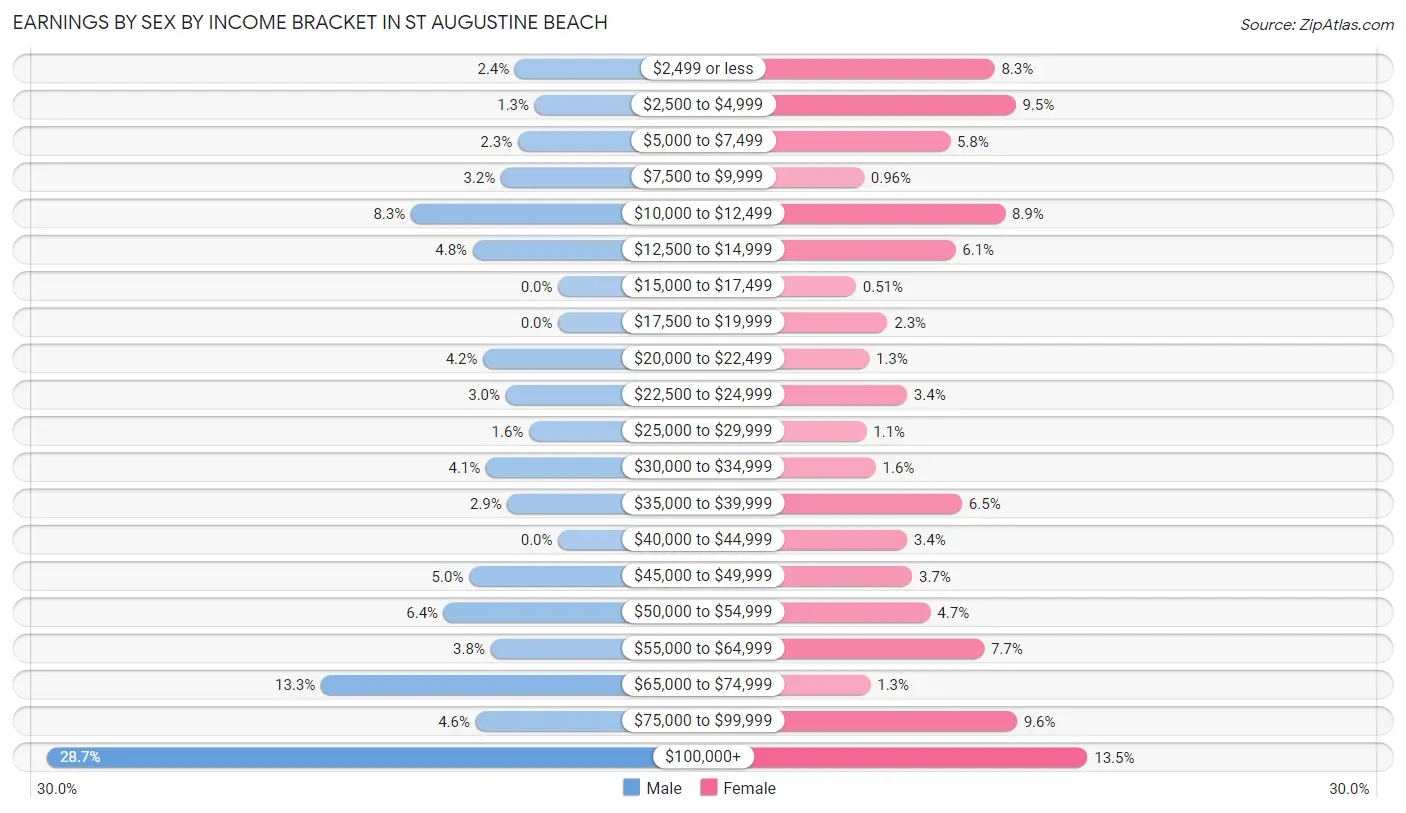
Earnings by Sex by Income Bracket in St Augustine Beach
The most common earnings brackets in St Augustine Beach are $100,000+ for men (545 | 28.7%) and $100,000+ for women (184 | 13.5%).
| Income | Male | Female |
| $2,499 or less | 46 (2.4%) | 113 (8.3%) |
| $2,500 to $4,999 | 25 (1.3%) | 129 (9.5%) |
| $5,000 to $7,499 | 43 (2.3%) | 79 (5.8%) |
| $7,500 to $9,999 | 61 (3.2%) | 13 (1.0%) |
| $10,000 to $12,499 | 157 (8.3%) | 121 (8.9%) |
| $12,500 to $14,999 | 91 (4.8%) | 83 (6.1%) |
| $15,000 to $17,499 | 0 (0.0%) | 7 (0.5%) |
| $17,500 to $19,999 | 0 (0.0%) | 31 (2.3%) |
| $20,000 to $22,499 | 80 (4.2%) | 17 (1.3%) |
| $22,500 to $24,999 | 56 (2.9%) | 46 (3.4%) |
| $25,000 to $29,999 | 31 (1.6%) | 15 (1.1%) |
| $30,000 to $34,999 | 77 (4.1%) | 22 (1.6%) |
| $35,000 to $39,999 | 54 (2.9%) | 88 (6.5%) |
| $40,000 to $44,999 | 0 (0.0%) | 46 (3.4%) |
| $45,000 to $49,999 | 95 (5.0%) | 50 (3.7%) |
| $50,000 to $54,999 | 122 (6.4%) | 64 (4.7%) |
| $55,000 to $64,999 | 72 (3.8%) | 105 (7.7%) |
| $65,000 to $74,999 | 253 (13.3%) | 18 (1.3%) |
| $75,000 to $99,999 | 88 (4.6%) | 130 (9.6%) |
| $100,000+ | 545 (28.7%) | 184 (13.5%) |
| Total | 1,896 (100.0%) | 1,361 (100.0%) |
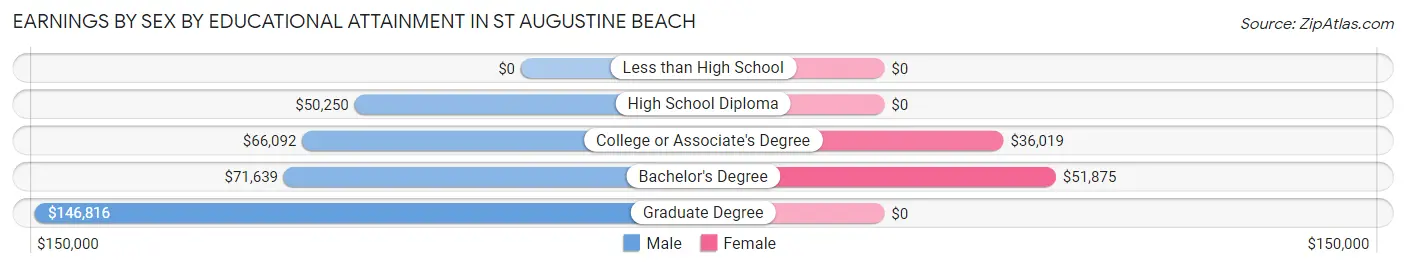
Earnings by Sex by Educational Attainment in St Augustine Beach
Average earnings in St Augustine Beach are $65,583 for men and $40,679 for women, a difference of 38.0%. Men with an educational attainment of graduate degree enjoy the highest average annual earnings of $146,816, while those with high school diploma education earn the least with $50,250. Women with an educational attainment of bachelor's degree earn the most with the average annual earnings of $51,875, while those with college or associate's degree education have the smallest earnings of $36,019.
| Educational Attainment | Male Income | Female Income |
| Less than High School | - | - |
| High School Diploma | $50,250 | $0 |
| College or Associate's Degree | $66,092 | $36,019 |
| Bachelor's Degree | $71,639 | $51,875 |
| Graduate Degree | $146,816 | $0 |
| Total | $65,583 | $40,679 |
Family Income in St Augustine Beach
Family Income Brackets in St Augustine Beach
According to the St Augustine Beach family income data, there are 461 families falling into the $200,000+ income range, which is the most common income bracket and makes up 24.8% of all families. Conversely, the $10,000 to $14,999 income bracket is the least frequent group with only 11 families (0.6%) belonging to this category.
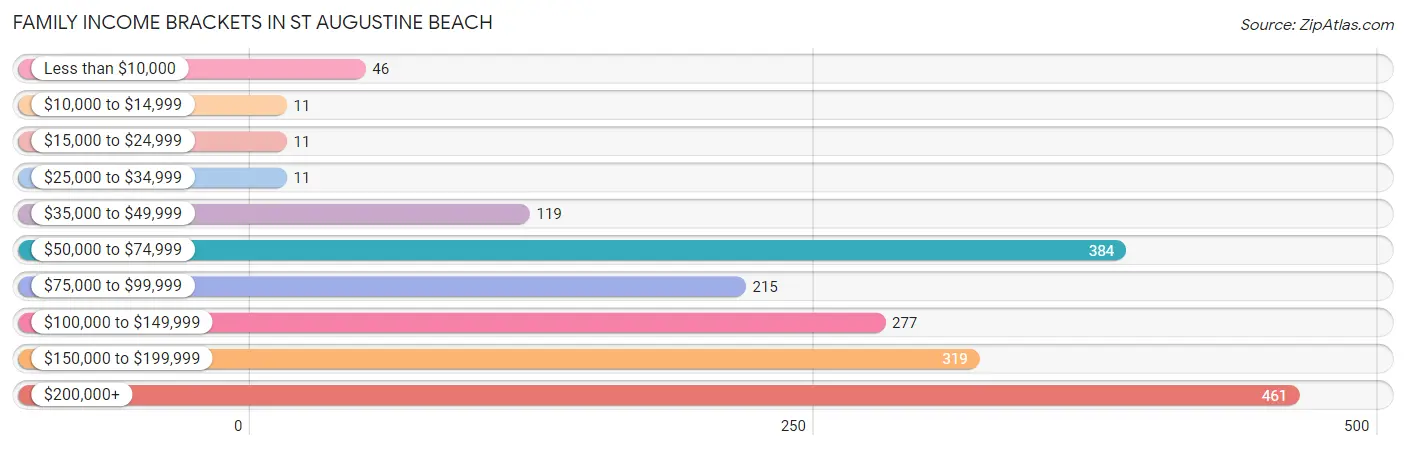
| Income Bracket | # Families | % Families |
| Less than $10,000 | 46 | 2.5% |
| $10,000 to $14,999 | 11 | 0.6% |
| $15,000 to $24,999 | 11 | 0.6% |
| $25,000 to $34,999 | 11 | 0.6% |
| $35,000 to $49,999 | 119 | 6.4% |
| $50,000 to $74,999 | 384 | 20.7% |
| $75,000 to $99,999 | 215 | 11.6% |
| $100,000 to $149,999 | 277 | 14.9% |
| $150,000 to $199,999 | 319 | 17.2% |
| $200,000+ | 461 | 24.8% |
Family Income by Famaliy Size in St Augustine Beach
5-person families (97 | 5.2%) account for the highest median family income in St Augustine Beach with $205,438 per family, while 2-person families (1,201 | 64.7%) have the highest median income of $56,106 per family member.
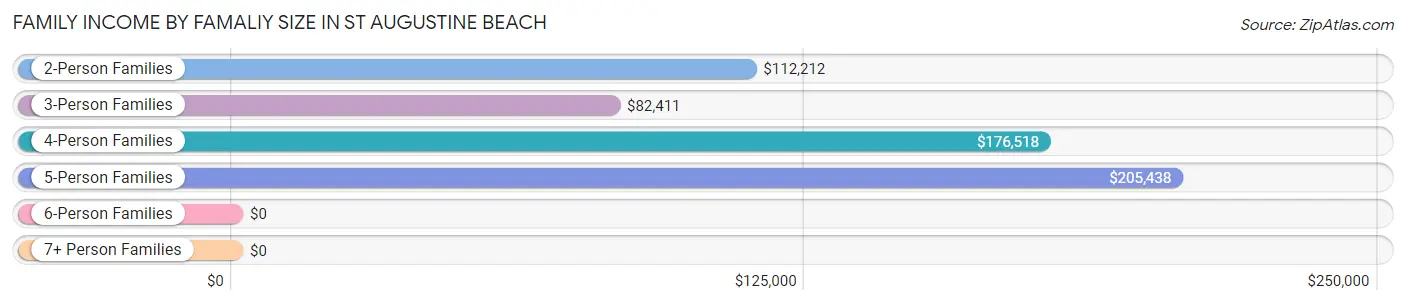
| Income Bracket | # Families | Median Income |
| 2-Person Families | 1,201 (64.7%) | $112,212 |
| 3-Person Families | 253 (13.6%) | $82,411 |
| 4-Person Families | 306 (16.5%) | $176,518 |
| 5-Person Families | 97 (5.2%) | $205,438 |
| 6-Person Families | 0 (0.0%) | $0 |
| 7+ Person Families | 0 (0.0%) | $0 |
| Total | 1,857 (100.0%) | $125,208 |
Family Income by Number of Earners in St Augustine Beach
The median family income in St Augustine Beach is $125,208, with families comprising 3+ earners (111) having the highest median family income of $148,036, while families with no earners (593) have the lowest median family income of $96,287, accounting for 6.0% and 31.9% of families, respectively.
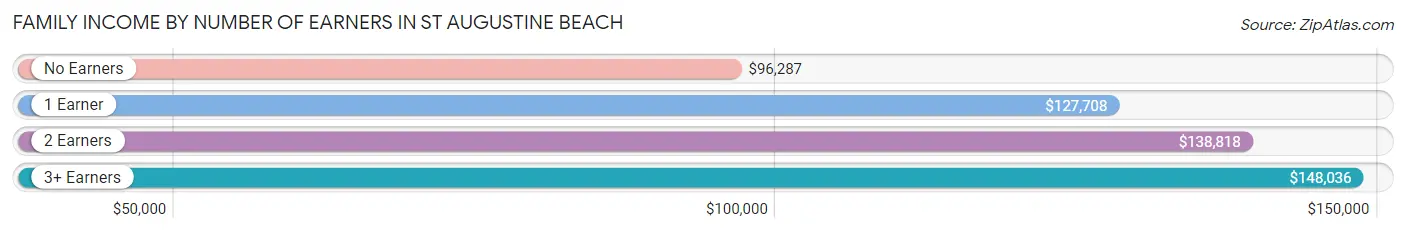
| Number of Earners | # Families | Median Income |
| No Earners | 593 (31.9%) | $96,287 |
| 1 Earner | 490 (26.4%) | $127,708 |
| 2 Earners | 663 (35.7%) | $138,818 |
| 3+ Earners | 111 (6.0%) | $148,036 |
| Total | 1,857 (100.0%) | $125,208 |
Household Income in St Augustine Beach
Household Income Brackets in St Augustine Beach
With 719 households falling in the category, the $50,000 to $74,999 income range is the most frequent in St Augustine Beach, accounting for 23.6% of all households. In contrast, only 12 households (0.4%) fall into the $10,000 to $14,999 income bracket, making it the least populous group.
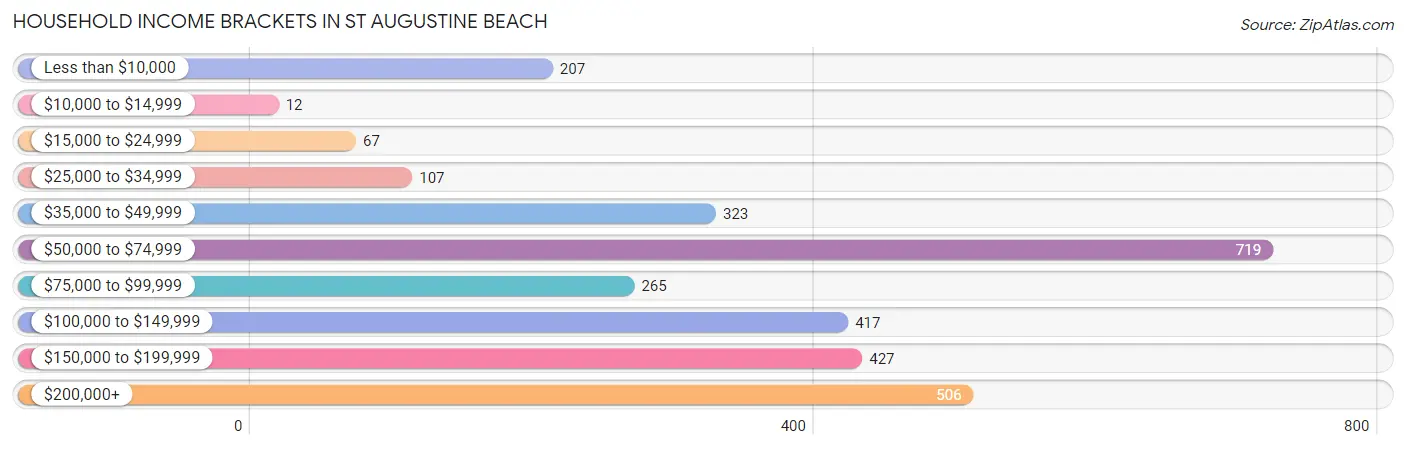
| Income Bracket | # Households | % Households |
| Less than $10,000 | 207 | 6.8% |
| $10,000 to $14,999 | 12 | 0.4% |
| $15,000 to $24,999 | 67 | 2.2% |
| $25,000 to $34,999 | 107 | 3.5% |
| $35,000 to $49,999 | 323 | 10.6% |
| $50,000 to $74,999 | 719 | 23.6% |
| $75,000 to $99,999 | 265 | 8.7% |
| $100,000 to $149,999 | 417 | 13.7% |
| $150,000 to $199,999 | 427 | 14.0% |
| $200,000+ | 506 | 16.6% |
Household Income by Householder Age in St Augustine Beach
The median household income in St Augustine Beach is $87,019, with the highest median household income of $128,942 found in the 25 to 44 years age bracket for the primary householder. A total of 502 households (16.5%) fall into this category. Meanwhile, the 15 to 24 years age bracket for the primary householder has the lowest median household income of $0, with 17 households (0.6%) in this group.
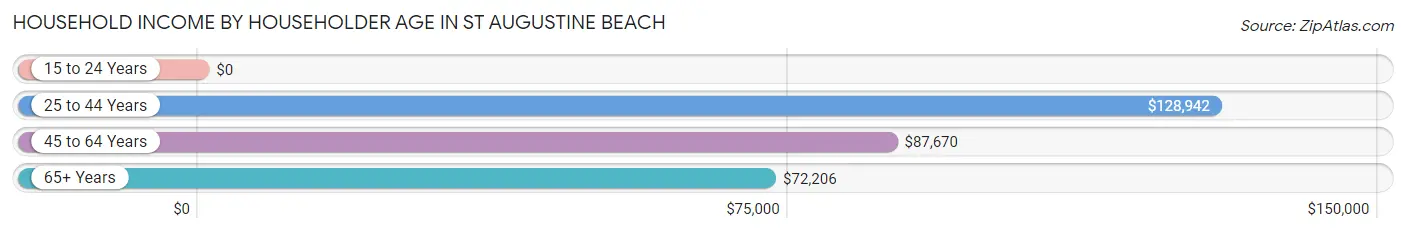
| Income Bracket | # Households | Median Income |
| 15 to 24 Years | 17 (0.6%) | $0 |
| 25 to 44 Years | 502 (16.5%) | $128,942 |
| 45 to 64 Years | 1,264 (41.5%) | $87,670 |
| 65+ Years | 1,264 (41.5%) | $72,206 |
| Total | 3,047 (100.0%) | $87,019 |
Poverty in St Augustine Beach
Income Below Poverty by Sex and Age in St Augustine Beach
With 6.6% poverty level for males and 6.9% for females among the residents of St Augustine Beach, 16 and 17 year old males and 5 year old females are the most vulnerable to poverty, with 15 males (21.7%) and 15 females (100.0%) in their respective age groups living below the poverty level.
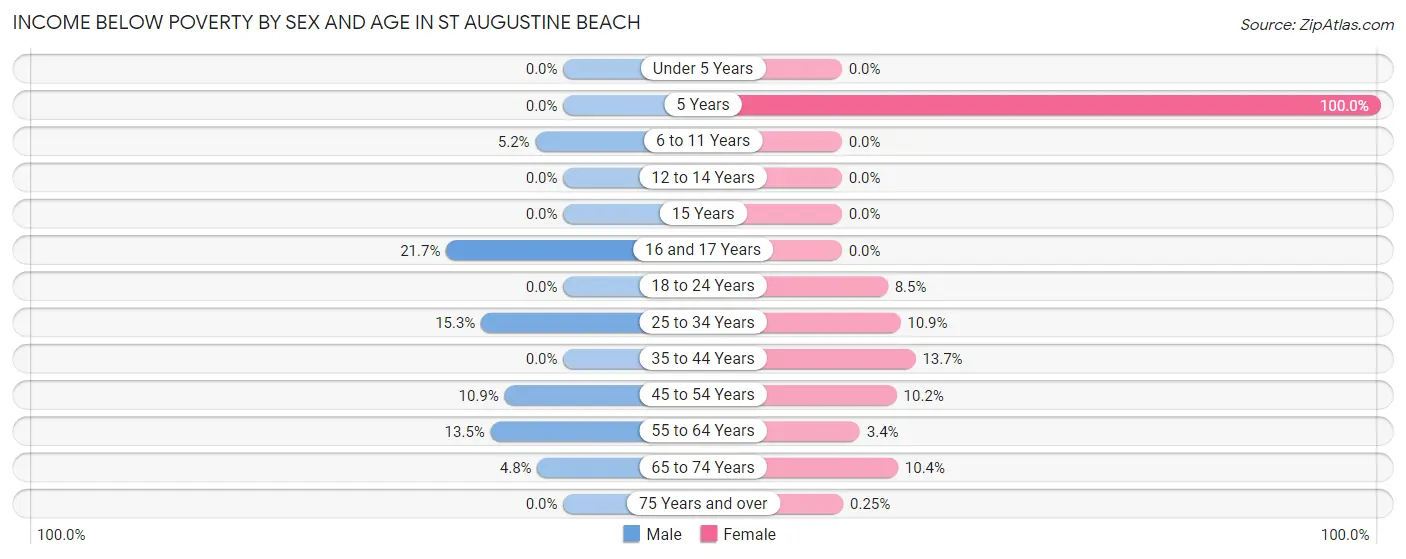
| Age Bracket | Male | Female |
| Under 5 Years | 0 (0.0%) | 0 (0.0%) |
| 5 Years | 0 (0.0%) | 15 (100.0%) |
| 6 to 11 Years | 13 (5.2%) | 0 (0.0%) |
| 12 to 14 Years | 0 (0.0%) | 0 (0.0%) |
| 15 Years | 0 (0.0%) | 0 (0.0%) |
| 16 and 17 Years | 15 (21.7%) | 0 (0.0%) |
| 18 to 24 Years | 0 (0.0%) | 18 (8.5%) |
| 25 to 34 Years | 18 (15.2%) | 5 (10.9%) |
| 35 to 44 Years | 0 (0.0%) | 67 (13.7%) |
| 45 to 54 Years | 51 (10.9%) | 39 (10.2%) |
| 55 to 64 Years | 97 (13.5%) | 26 (3.4%) |
| 65 to 74 Years | 28 (4.8%) | 64 (10.4%) |
| 75 Years and over | 0 (0.0%) | 1 (0.3%) |
| Total | 222 (6.6%) | 235 (6.9%) |
Income Above Poverty by Sex and Age in St Augustine Beach
According to the poverty statistics in St Augustine Beach, males aged under 5 years and females aged under 5 years are the age groups that are most secure financially, with 100.0% of males and 100.0% of females in these age groups living above the poverty line.
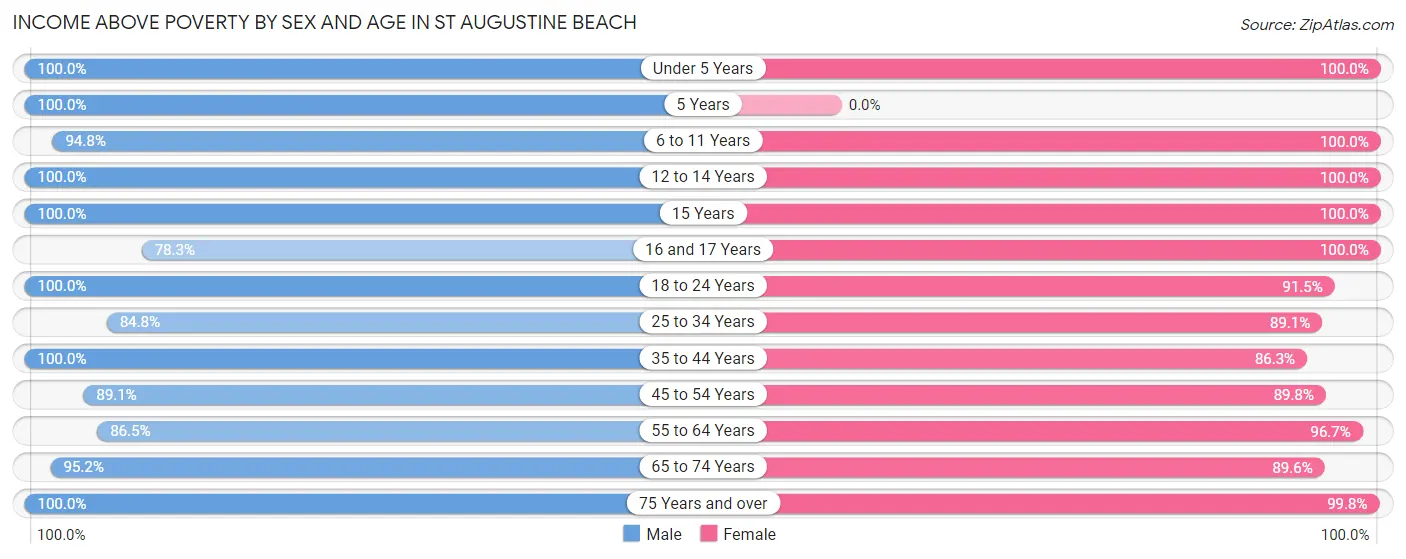
| Age Bracket | Male | Female |
| Under 5 Years | 35 (100.0%) | 52 (100.0%) |
| 5 Years | 32 (100.0%) | 0 (0.0%) |
| 6 to 11 Years | 238 (94.8%) | 206 (100.0%) |
| 12 to 14 Years | 70 (100.0%) | 137 (100.0%) |
| 15 Years | 48 (100.0%) | 76 (100.0%) |
| 16 and 17 Years | 54 (78.3%) | 15 (100.0%) |
| 18 to 24 Years | 166 (100.0%) | 193 (91.5%) |
| 25 to 34 Years | 100 (84.8%) | 41 (89.1%) |
| 35 to 44 Years | 551 (100.0%) | 423 (86.3%) |
| 45 to 54 Years | 416 (89.1%) | 344 (89.8%) |
| 55 to 64 Years | 622 (86.5%) | 751 (96.7%) |
| 65 to 74 Years | 554 (95.2%) | 551 (89.6%) |
| 75 Years and over | 234 (100.0%) | 394 (99.8%) |
| Total | 3,120 (93.4%) | 3,183 (93.1%) |
Income Below Poverty Among Married-Couple Families in St Augustine Beach
The poverty statistics for married-couple families in St Augustine Beach show that 2.1% or 33 of the total 1,556 families live below the poverty line. Families with no children have the highest poverty rate of 2.9%, comprising of 33 families. On the other hand, families with 1 or 2 children have the lowest poverty rate of 0.0%, which includes 0 families.
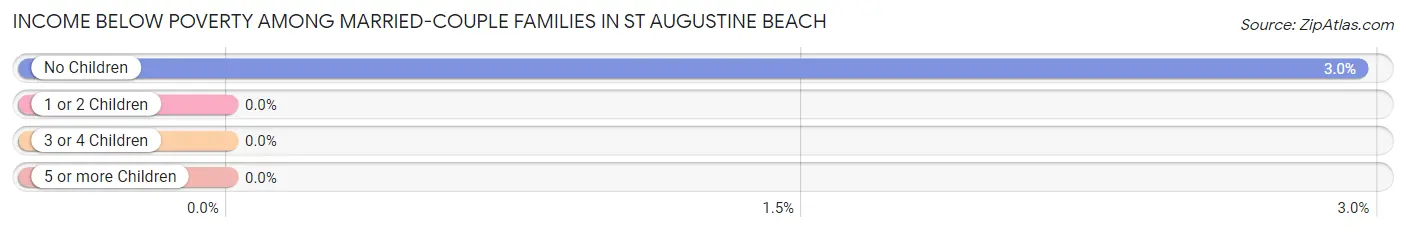
| Children | Above Poverty | Below Poverty |
| No Children | 1,086 (97.1%) | 33 (2.9%) |
| 1 or 2 Children | 371 (100.0%) | 0 (0.0%) |
| 3 or 4 Children | 66 (100.0%) | 0 (0.0%) |
| 5 or more Children | 0 (0.0%) | 0 (0.0%) |
| Total | 1,523 (97.9%) | 33 (2.1%) |
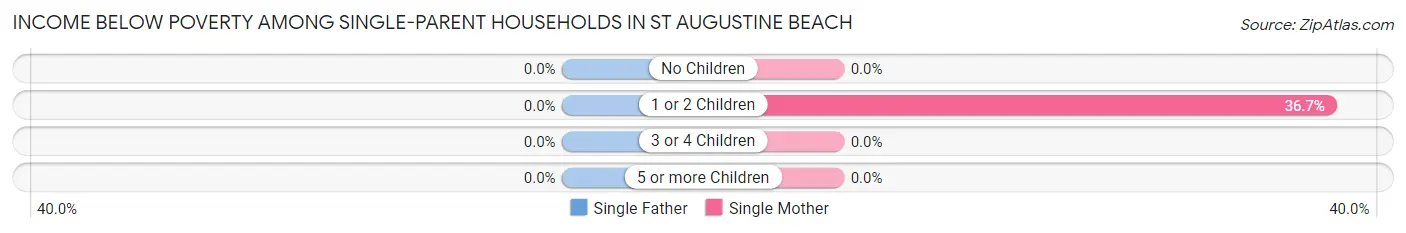
Income Below Poverty Among Single-Parent Households in St Augustine Beach
| Children | Single Father | Single Mother |
| No Children | 0 (0.0%) | 0 (0.0%) |
| 1 or 2 Children | 0 (0.0%) | 36 (36.7%) |
| 3 or 4 Children | 0 (0.0%) | 0 (0.0%) |
| 5 or more Children | 0 (0.0%) | 0 (0.0%) |
| Total | 0 (0.0%) | 36 (12.3%) |
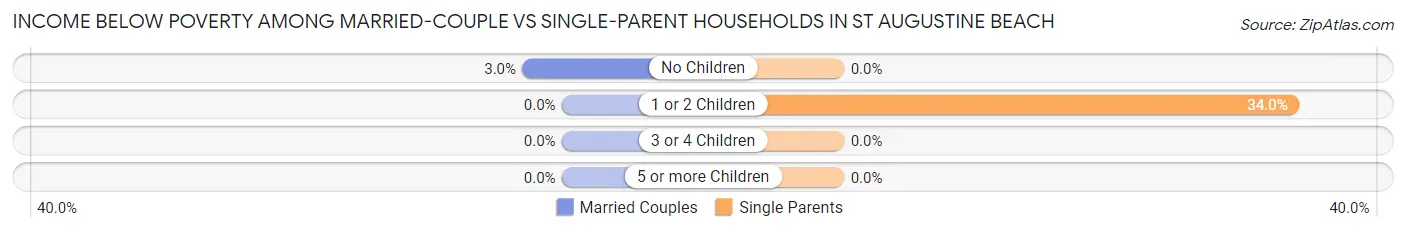
Income Below Poverty Among Married-Couple vs Single-Parent Households in St Augustine Beach
The poverty data for St Augustine Beach shows that 33 of the married-couple family households (2.1%) and 36 of the single-parent households (12.0%) are living below the poverty level. Within the married-couple family households, those with no children have the highest poverty rate, with 33 households (2.9%) falling below the poverty line. Among the single-parent households, those with 1 or 2 children have the highest poverty rate, with 36 household (34.0%) living below poverty.
| Children | Married-Couple Families | Single-Parent Households |
| No Children | 33 (2.9%) | 0 (0.0%) |
| 1 or 2 Children | 0 (0.0%) | 36 (34.0%) |
| 3 or 4 Children | 0 (0.0%) | 0 (0.0%) |
| 5 or more Children | 0 (0.0%) | 0 (0.0%) |
| Total | 33 (2.1%) | 36 (12.0%) |
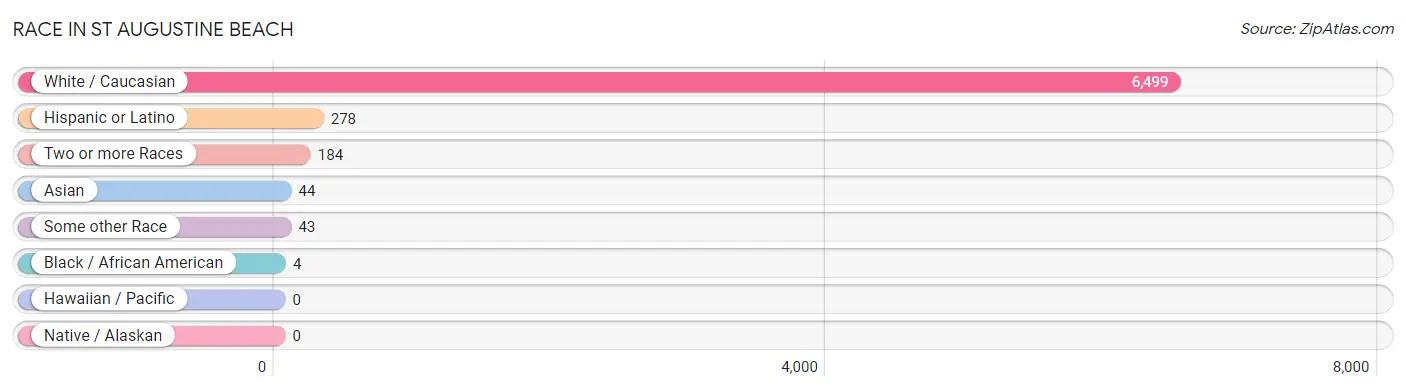
Race in St Augustine Beach
The most populous races in St Augustine Beach are White / Caucasian (6,499 | 95.9%), Hispanic or Latino (278 | 4.1%), and Two or more Races (184 | 2.7%).
| Race | # Population | % Population |
| Asian | 44 | 0.6% |
| Black / African American | 4 | 0.1% |
| Hawaiian / Pacific | 0 | 0.0% |
| Hispanic or Latino | 278 | 4.1% |
| Native / Alaskan | 0 | 0.0% |
| White / Caucasian | 6,499 | 95.9% |
| Two or more Races | 184 | 2.7% |
| Some other Race | 43 | 0.6% |
| Total | 6,774 | 100.0% |
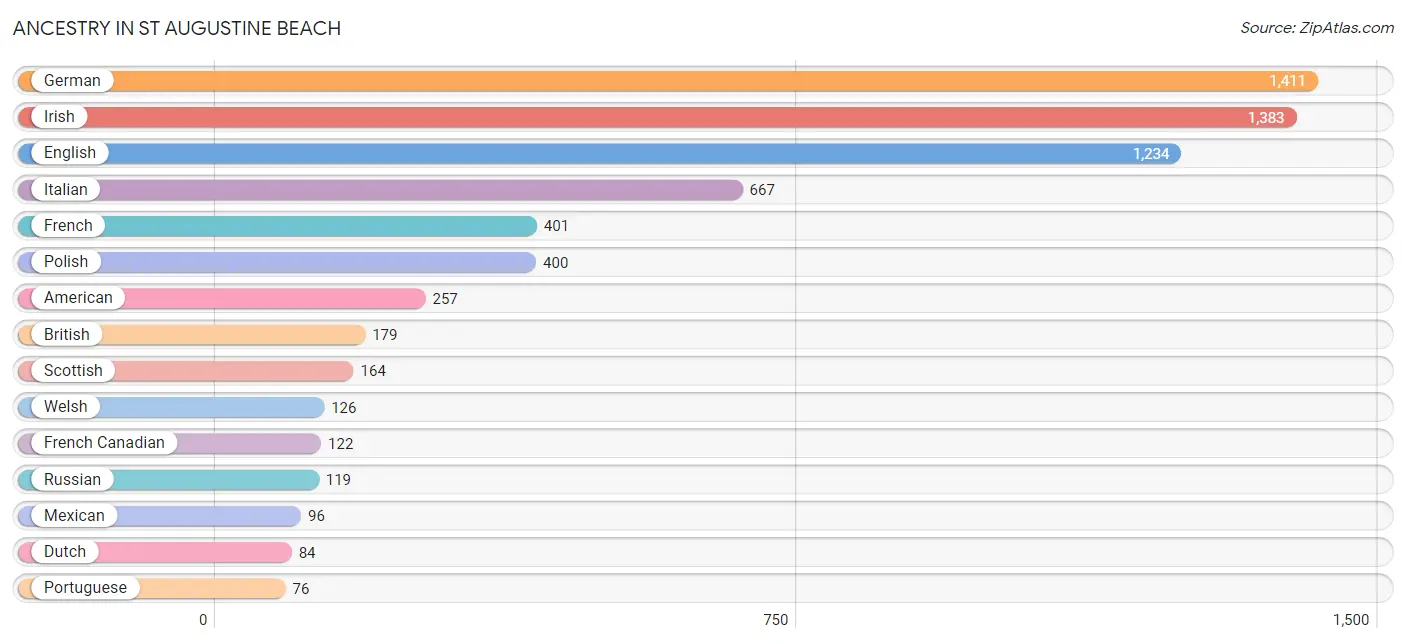
Ancestry in St Augustine Beach
The most populous ancestries reported in St Augustine Beach are German (1,411 | 20.8%), Irish (1,383 | 20.4%), English (1,234 | 18.2%), Italian (667 | 9.9%), and French (401 | 5.9%), together accounting for 75.2% of all St Augustine Beach residents.
| Ancestry | # Population | % Population |
| American | 257 | 3.8% |
| Arab | 26 | 0.4% |
| Australian | 18 | 0.3% |
| Bhutanese | 5 | 0.1% |
| British | 179 | 2.6% |
| Bulgarian | 70 | 1.0% |
| Canadian | 17 | 0.3% |
| Central American | 17 | 0.3% |
| Chilean | 23 | 0.3% |
| Croatian | 29 | 0.4% |
| Cuban | 62 | 0.9% |
| Czech | 21 | 0.3% |
| Danish | 14 | 0.2% |
| Dutch | 84 | 1.2% |
| Eastern European | 46 | 0.7% |
| English | 1,234 | 18.2% |
| European | 65 | 1.0% |
| French | 401 | 5.9% |
| French Canadian | 122 | 1.8% |
| German | 1,411 | 20.8% |
| Greek | 70 | 1.0% |
| Hungarian | 41 | 0.6% |
| Indian (Asian) | 38 | 0.6% |
| Irish | 1,383 | 20.4% |
| Italian | 667 | 9.9% |
| Korean | 15 | 0.2% |
| Latvian | 22 | 0.3% |
| Lebanese | 26 | 0.4% |
| Lithuanian | 15 | 0.2% |
| Mexican | 96 | 1.4% |
| Nicaraguan | 17 | 0.3% |
| Norwegian | 51 | 0.7% |
| Osage | 6 | 0.1% |
| Polish | 400 | 5.9% |
| Portuguese | 76 | 1.1% |
| Puerto Rican | 32 | 0.5% |
| Romanian | 66 | 1.0% |
| Russian | 119 | 1.8% |
| Scandinavian | 67 | 1.0% |
| Scotch-Irish | 17 | 0.3% |
| Scottish | 164 | 2.4% |
| Serbian | 30 | 0.4% |
| Slovak | 19 | 0.3% |
| South American | 23 | 0.3% |
| Spaniard | 15 | 0.2% |
| Spanish | 16 | 0.2% |
| Swedish | 47 | 0.7% |
| Swiss | 36 | 0.5% |
| Tlingit-Haida | 10 | 0.2% |
| Welsh | 126 | 1.9% |
| Yugoslavian | 22 | 0.3% | View All 51 Rows |
Immigrants in St Augustine Beach
The most numerous immigrant groups reported in St Augustine Beach came from Europe (171 | 2.5%), Latin America (94 | 1.4%), Northern Europe (88 | 1.3%), Caribbean (79 | 1.2%), and Canada (53 | 0.8%), together accounting for 7.2% of all St Augustine Beach residents.
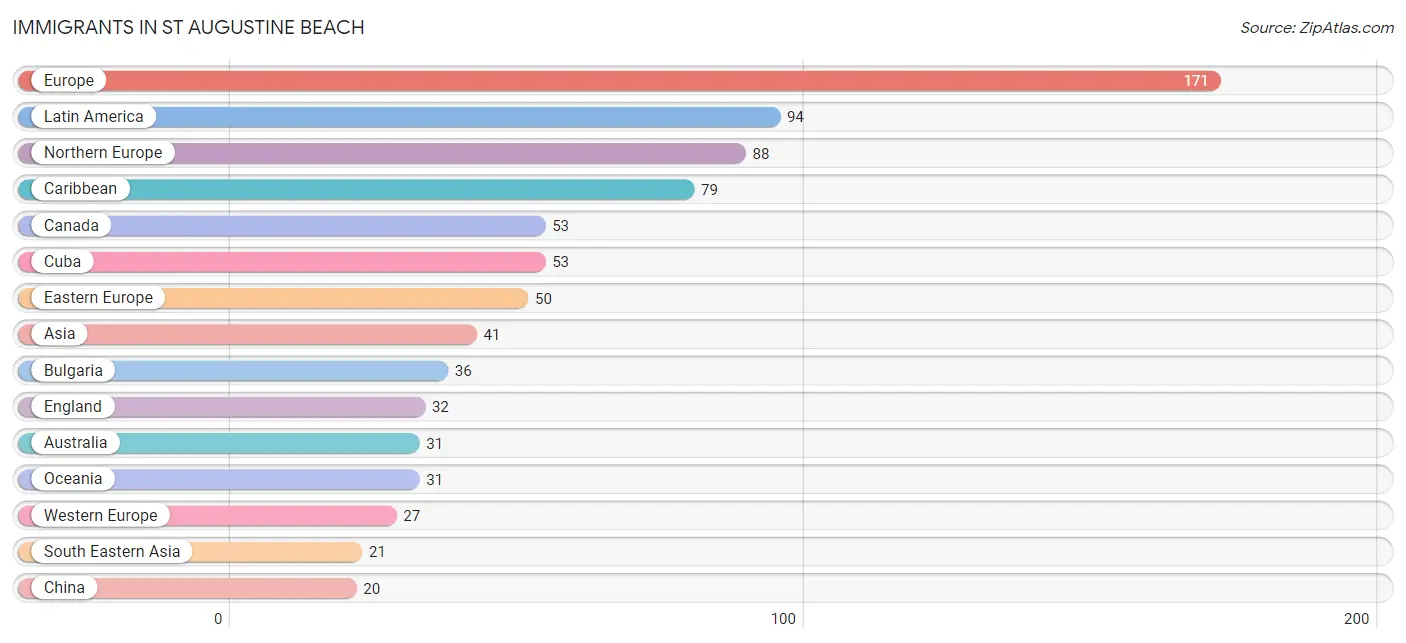
| Immigration Origin | # Population | % Population |
| Asia | 41 | 0.6% |
| Australia | 31 | 0.5% |
| Bulgaria | 36 | 0.5% |
| Canada | 53 | 0.8% |
| Caribbean | 79 | 1.2% |
| Central America | 15 | 0.2% |
| China | 20 | 0.3% |
| Cuba | 53 | 0.8% |
| Dominican Republic | 16 | 0.2% |
| Eastern Asia | 20 | 0.3% |
| Eastern Europe | 50 | 0.7% |
| England | 32 | 0.5% |
| Europe | 171 | 2.5% |
| France | 18 | 0.3% |
| Germany | 9 | 0.1% |
| Italy | 6 | 0.1% |
| Latin America | 94 | 1.4% |
| Mexico | 15 | 0.2% |
| Northern Europe | 88 | 1.3% |
| Oceania | 31 | 0.5% |
| Philippines | 12 | 0.2% |
| Poland | 14 | 0.2% |
| Scotland | 16 | 0.2% |
| Singapore | 9 | 0.1% |
| South Eastern Asia | 21 | 0.3% |
| Southern Europe | 6 | 0.1% |
| Taiwan | 20 | 0.3% |
| Western Europe | 27 | 0.4% | View All 28 Rows |
Sex and Age in St Augustine Beach
Sex and Age in St Augustine Beach
The most populous age groups in St Augustine Beach are 60 to 64 Years (480 | 14.4%) for men and 60 to 64 Years (426 | 12.4%) for women.
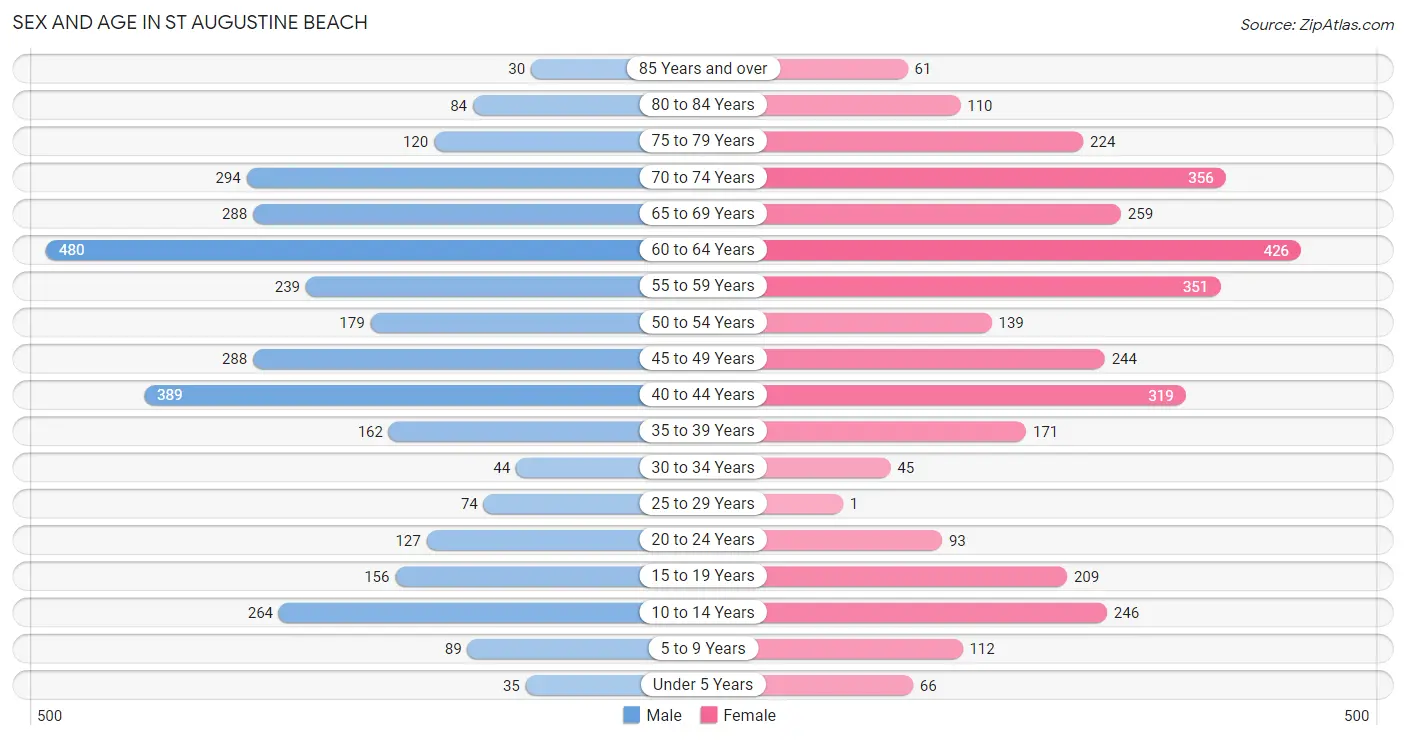
| Age Bracket | Male | Female |
| Under 5 Years | 35 (1.1%) | 66 (1.9%) |
| 5 to 9 Years | 89 (2.7%) | 112 (3.3%) |
| 10 to 14 Years | 264 (7.9%) | 246 (7.2%) |
| 15 to 19 Years | 156 (4.7%) | 209 (6.1%) |
| 20 to 24 Years | 127 (3.8%) | 93 (2.7%) |
| 25 to 29 Years | 74 (2.2%) | 1 (0.0%) |
| 30 to 34 Years | 44 (1.3%) | 45 (1.3%) |
| 35 to 39 Years | 162 (4.9%) | 171 (5.0%) |
| 40 to 44 Years | 389 (11.6%) | 319 (9.3%) |
| 45 to 49 Years | 288 (8.6%) | 244 (7.1%) |
| 50 to 54 Years | 179 (5.4%) | 139 (4.1%) |
| 55 to 59 Years | 239 (7.1%) | 351 (10.2%) |
| 60 to 64 Years | 480 (14.4%) | 426 (12.4%) |
| 65 to 69 Years | 288 (8.6%) | 259 (7.5%) |
| 70 to 74 Years | 294 (8.8%) | 356 (10.4%) |
| 75 to 79 Years | 120 (3.6%) | 224 (6.5%) |
| 80 to 84 Years | 84 (2.5%) | 110 (3.2%) |
| 85 Years and over | 30 (0.9%) | 61 (1.8%) |
| Total | 3,342 (100.0%) | 3,432 (100.0%) |
Families and Households in St Augustine Beach
Median Family Size in St Augustine Beach
The median family size in St Augustine Beach is 2.76 persons per family, with single female/mother families (293 | 15.8%) accounting for the largest median family size of 2.78 persons per family. On the other hand, single male/father families (8 | 0.4%) represent the smallest median family size with 2.00 persons per family.
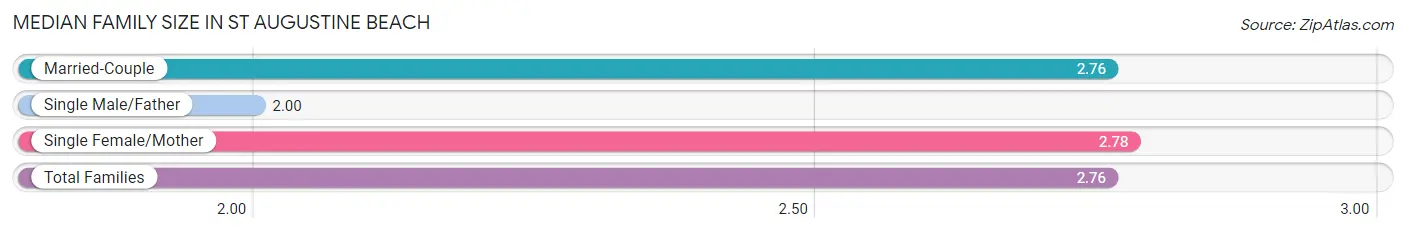
| Family Type | # Families | Family Size |
| Married-Couple | 1,556 (83.8%) | 2.76 |
| Single Male/Father | 8 (0.4%) | 2.00 |
| Single Female/Mother | 293 (15.8%) | 2.78 |
| Total Families | 1,857 (100.0%) | 2.76 |
Median Household Size in St Augustine Beach
The median household size in St Augustine Beach is 2.22 persons per household, with single female/mother households (293 | 9.6%) accounting for the largest median household size of 3.19 persons per household. non-family households (1,190 | 39.1%) represent the smallest median household size with 1.26 persons per household.
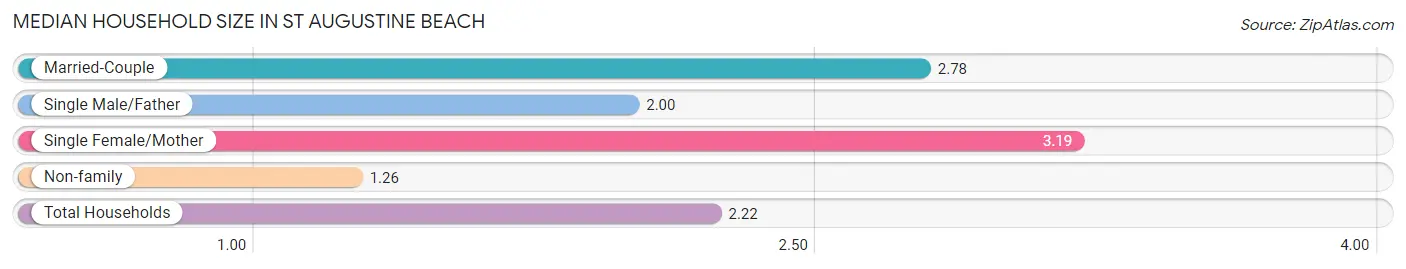
| Household Type | # Households | Household Size |
| Married-Couple | 1,556 (51.1%) | 2.78 |
| Single Male/Father | 8 (0.3%) | 2.00 |
| Single Female/Mother | 293 (9.6%) | 3.19 |
| Non-family | 1,190 (39.1%) | 1.26 |
| Total Households | 3,047 (100.0%) | 2.22 |
Household Size by Marriage Status in St Augustine Beach
Out of a total of 3,047 households in St Augustine Beach, 1,857 (61.0%) are family households, while 1,190 (39.1%) are nonfamily households. The most numerous type of family households are 2-person households, comprising 1,123, and the most common type of nonfamily households are 1-person households, comprising 986.
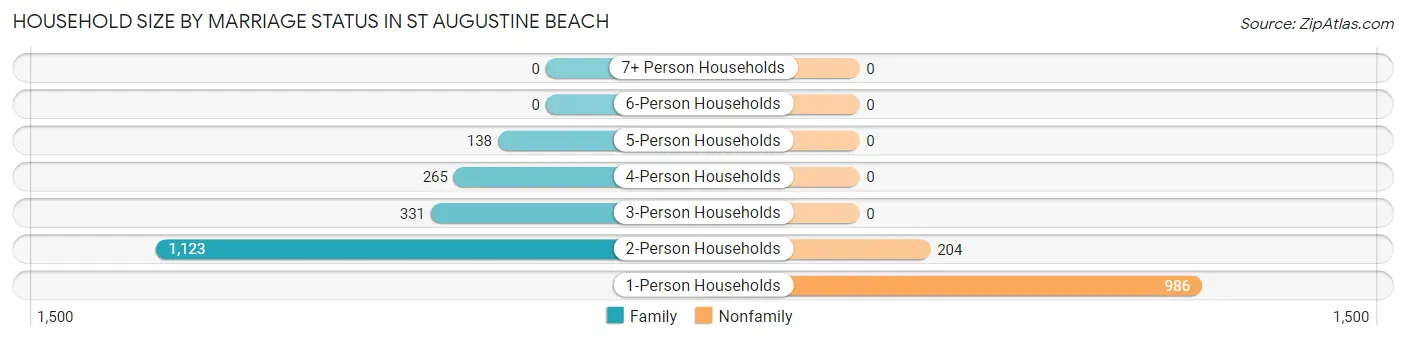
| Household Size | Family Households | Nonfamily Households |
| 1-Person Households | - | 986 (32.4%) |
| 2-Person Households | 1,123 (36.9%) | 204 (6.7%) |
| 3-Person Households | 331 (10.9%) | 0 (0.0%) |
| 4-Person Households | 265 (8.7%) | 0 (0.0%) |
| 5-Person Households | 138 (4.5%) | 0 (0.0%) |
| 6-Person Households | 0 (0.0%) | 0 (0.0%) |
| 7+ Person Households | 0 (0.0%) | 0 (0.0%) |
| Total | 1,857 (61.0%) | 1,190 (39.1%) |
Female Fertility in St Augustine Beach
Fertility by Age in St Augustine Beach
| Age Bracket | Women with Births | Births / 1,000 Women |
| 15 to 19 years | 0 (0.0%) | 0.0 |
| 20 to 34 years | 0 (0.0%) | 0.0 |
| 35 to 50 years | 0 (0.0%) | 0.0 |
| Total | 0 (0.0%) | 0.0 |
Fertility by Age by Marriage Status in St Augustine Beach
| Age Bracket | Married | Unmarried |
| 15 to 19 years | 0 (0.0%) | 0 (0.0%) |
| 20 to 34 years | 0 (0.0%) | 0 (0.0%) |
| 35 to 50 years | 0 (0.0%) | 0 (0.0%) |
| Total | 0 (0.0%) | 0 (0.0%) |
Fertility by Education in St Augustine Beach
| Educational Attainment | Women with Births | Births / 1,000 Women |
| Less than High School | 0 (0.0%) | 0.0 |
| High School Diploma | 0 (0.0%) | 0.0 |
| College or Associate's Degree | 0 (0.0%) | 0.0 |
| Bachelor's Degree | 0 (0.0%) | 0.0 |
| Graduate Degree | 0 (0.0%) | 0.0 |
| Total | 0 (0.0%) | 0.0 |
Fertility by Education by Marriage Status in St Augustine Beach
| Educational Attainment | Married | Unmarried |
| Less than High School | 0 (0.0%) | 0 (0.0%) |
| High School Diploma | 0 (0.0%) | 0 (0.0%) |
| College or Associate's Degree | 0 (0.0%) | 0 (0.0%) |
| Bachelor's Degree | 0 (0.0%) | 0 (0.0%) |
| Graduate Degree | 0 (0.0%) | 0 (0.0%) |
| Total | 0 (0.0%) | 0 (0.0%) |
Employment Characteristics in St Augustine Beach
Employment by Class of Employer in St Augustine Beach
Among the 2,730 employed individuals in St Augustine Beach, private company employees (1,432 | 52.4%), not-for-profit organizations (379 | 13.9%), and self-employed (incorporated) (272 | 10.0%) make up the most common classes of employment.
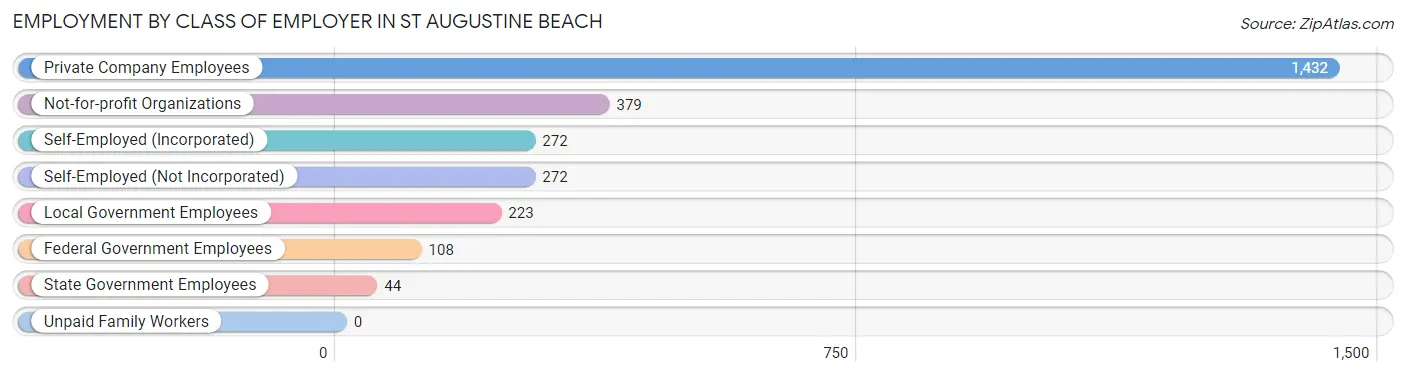
| Employer Class | # Employees | % Employees |
| Private Company Employees | 1,432 | 52.4% |
| Self-Employed (Incorporated) | 272 | 10.0% |
| Self-Employed (Not Incorporated) | 272 | 10.0% |
| Not-for-profit Organizations | 379 | 13.9% |
| Local Government Employees | 223 | 8.2% |
| State Government Employees | 44 | 1.6% |
| Federal Government Employees | 108 | 4.0% |
| Unpaid Family Workers | 0 | 0.0% |
| Total | 2,730 | 100.0% |
Employment Status by Age in St Augustine Beach
According to the labor force statistics for St Augustine Beach, out of the total population over 16 years of age (5,838), 51.6% or 3,012 individuals are in the labor force, with 8.1% or 244 of them unemployed. The age group with the highest labor force participation rate is 25 to 29 years, with 98.7% or 74 individuals in the labor force. Within the labor force, the 55 to 59 years age range has the highest percentage of unemployed individuals, with 19.5% or 63 of them being unemployed.
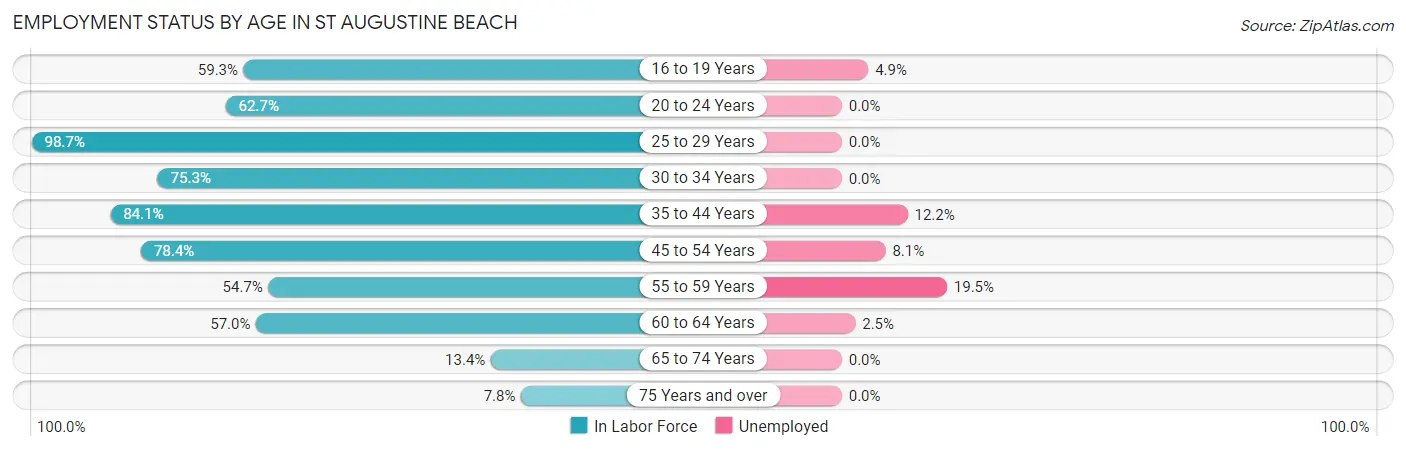
| Age Bracket | In Labor Force | Unemployed |
| 16 to 19 Years | 143 (59.3%) | 7 (4.9%) |
| 20 to 24 Years | 138 (62.7%) | 0 (0.0%) |
| 25 to 29 Years | 74 (98.7%) | 0 (0.0%) |
| 30 to 34 Years | 67 (75.3%) | 0 (0.0%) |
| 35 to 44 Years | 875 (84.1%) | 107 (12.2%) |
| 45 to 54 Years | 666 (78.4%) | 54 (8.1%) |
| 55 to 59 Years | 323 (54.7%) | 63 (19.5%) |
| 60 to 64 Years | 516 (57.0%) | 13 (2.5%) |
| 65 to 74 Years | 160 (13.4%) | 0 (0.0%) |
| 75 Years and over | 49 (7.8%) | 0 (0.0%) |
| Total | 3,012 (51.6%) | 244 (8.1%) |
Employment Status by Educational Attainment in St Augustine Beach
According to labor force statistics for St Augustine Beach, 71.0% of individuals (2,521) out of the total population between 25 and 64 years of age (3,551) are in the labor force, with 9.4% or 237 of them being unemployed. The group with the highest labor force participation rate are those with the educational attainment of bachelor's degree or higher, with 75.8% or 1,417 individuals in the labor force. Within the labor force, individuals with less than high school education have the highest percentage of unemployment, with 56.9% or 107 of them being unemployed.
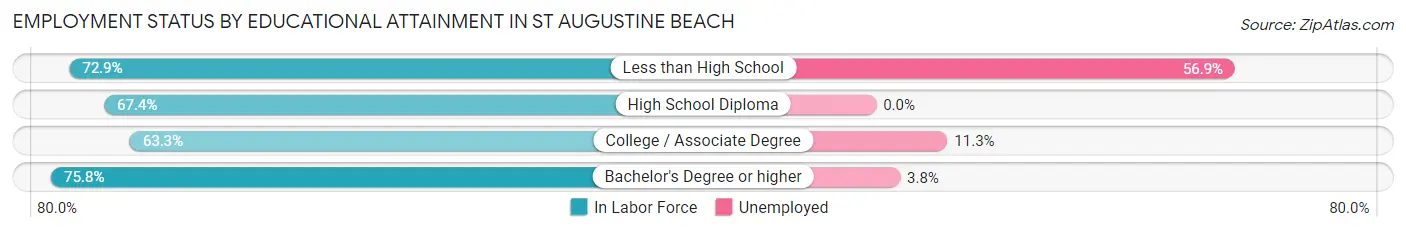
| Educational Attainment | In Labor Force | Unemployed |
| Less than High School | 188 (72.9%) | 147 (56.9%) |
| High School Diploma | 242 (67.4%) | 0 (0.0%) |
| College / Associate Degree | 674 (63.3%) | 120 (11.3%) |
| Bachelor's Degree or higher | 1,417 (75.8%) | 71 (3.8%) |
| Total | 2,521 (71.0%) | 334 (9.4%) |
Employment Occupations by Sex in St Augustine Beach
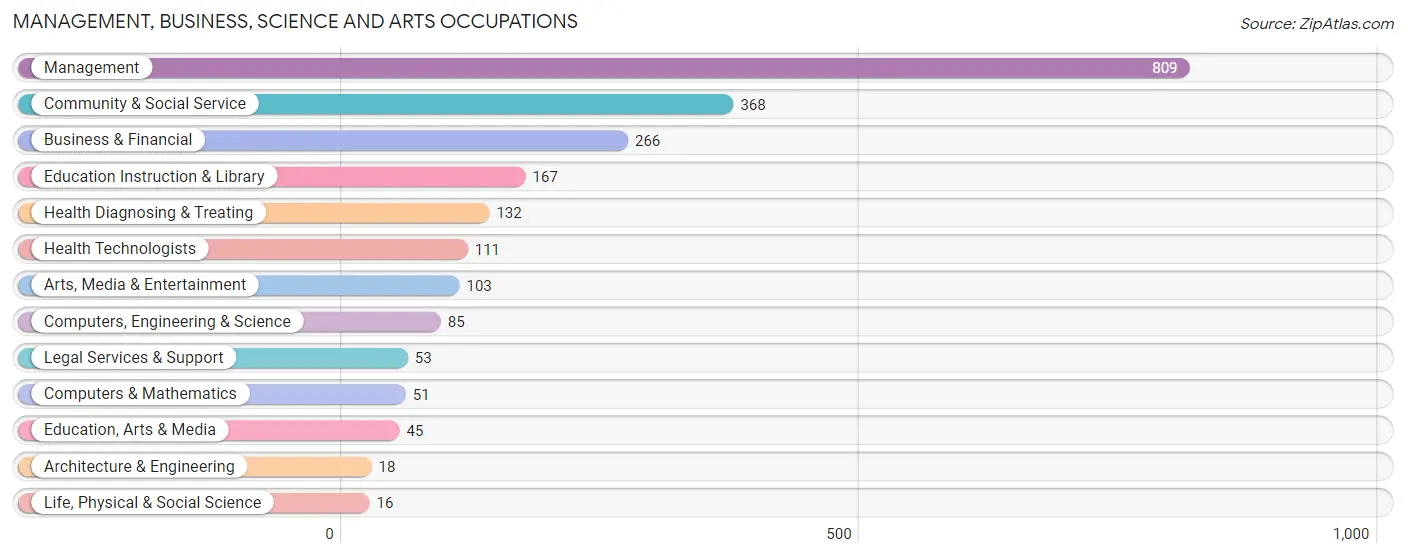
Management, Business, Science and Arts Occupations
The most common Management, Business, Science and Arts occupations in St Augustine Beach are Management (809 | 29.2%), Community & Social Service (368 | 13.3%), Business & Financial (266 | 9.6%), Education Instruction & Library (167 | 6.0%), and Health Diagnosing & Treating (132 | 4.8%).
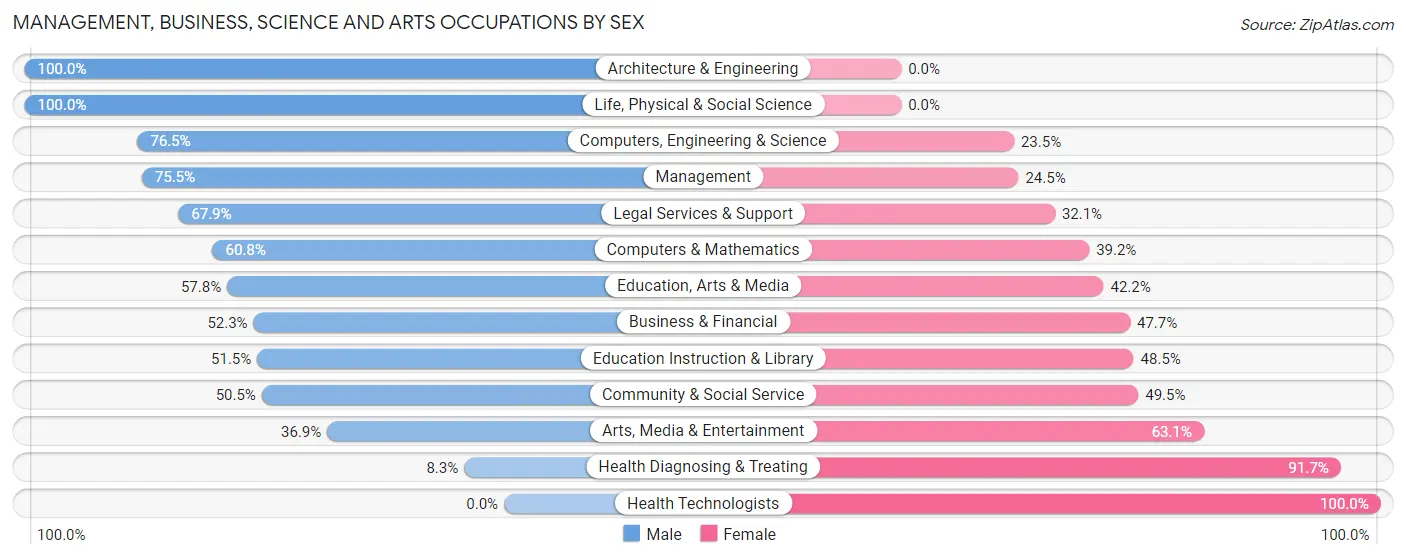
Management, Business, Science and Arts Occupations by Sex
Within the Management, Business, Science and Arts occupations in St Augustine Beach, the most male-oriented occupations are Architecture & Engineering (100.0%), Life, Physical & Social Science (100.0%), and Computers, Engineering & Science (76.5%), while the most female-oriented occupations are Health Technologists (100.0%), Health Diagnosing & Treating (91.7%), and Arts, Media & Entertainment (63.1%).
| Occupation | Male | Female |
| Management | 611 (75.5%) | 198 (24.5%) |
| Business & Financial | 139 (52.3%) | 127 (47.7%) |
| Computers, Engineering & Science | 65 (76.5%) | 20 (23.5%) |
| Computers & Mathematics | 31 (60.8%) | 20 (39.2%) |
| Architecture & Engineering | 18 (100.0%) | 0 (0.0%) |
| Life, Physical & Social Science | 16 (100.0%) | 0 (0.0%) |
| Community & Social Service | 186 (50.5%) | 182 (49.5%) |
| Education, Arts & Media | 26 (57.8%) | 19 (42.2%) |
| Legal Services & Support | 36 (67.9%) | 17 (32.1%) |
| Education Instruction & Library | 86 (51.5%) | 81 (48.5%) |
| Arts, Media & Entertainment | 38 (36.9%) | 65 (63.1%) |
| Health Diagnosing & Treating | 11 (8.3%) | 121 (91.7%) |
| Health Technologists | 0 (0.0%) | 111 (100.0%) |
| Total (Category) | 1,012 (61.0%) | 648 (39.0%) |
| Total (Overall) | 1,594 (57.6%) | 1,173 (42.4%) |
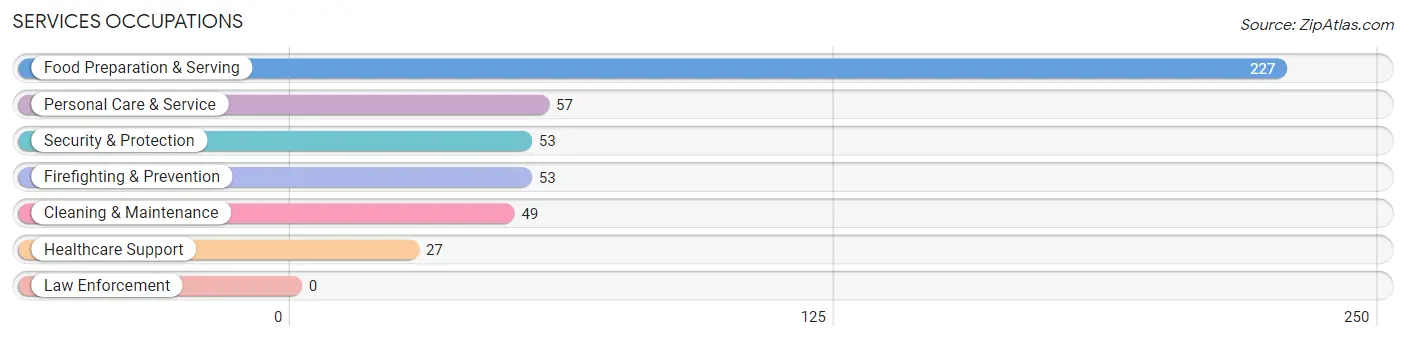
Services Occupations
The most common Services occupations in St Augustine Beach are Food Preparation & Serving (227 | 8.2%), Personal Care & Service (57 | 2.1%), Security & Protection (53 | 1.9%), Firefighting & Prevention (53 | 1.9%), and Cleaning & Maintenance (49 | 1.8%).
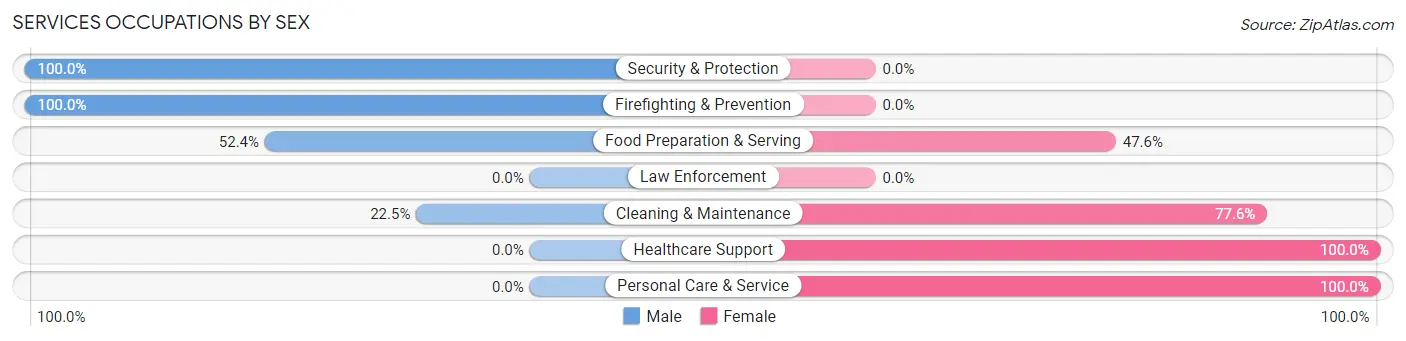
Services Occupations by Sex
Within the Services occupations in St Augustine Beach, the most male-oriented occupations are Security & Protection (100.0%), Firefighting & Prevention (100.0%), and Food Preparation & Serving (52.4%), while the most female-oriented occupations are Healthcare Support (100.0%), Personal Care & Service (100.0%), and Cleaning & Maintenance (77.5%).
| Occupation | Male | Female |
| Healthcare Support | 0 (0.0%) | 27 (100.0%) |
| Security & Protection | 53 (100.0%) | 0 (0.0%) |
| Firefighting & Prevention | 53 (100.0%) | 0 (0.0%) |
| Law Enforcement | 0 (0.0%) | 0 (0.0%) |
| Food Preparation & Serving | 119 (52.4%) | 108 (47.6%) |
| Cleaning & Maintenance | 11 (22.5%) | 38 (77.5%) |
| Personal Care & Service | 0 (0.0%) | 57 (100.0%) |
| Total (Category) | 183 (44.3%) | 230 (55.7%) |
| Total (Overall) | 1,594 (57.6%) | 1,173 (42.4%) |
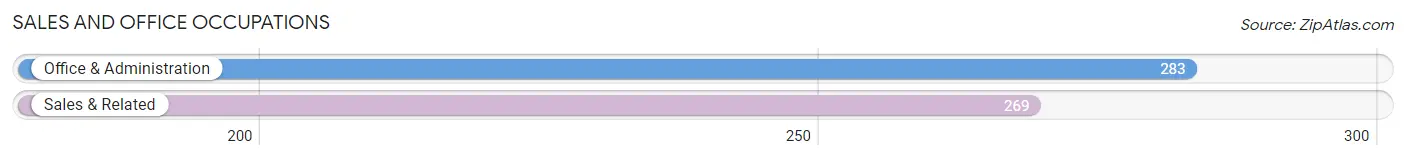
Sales and Office Occupations
The most common Sales and Office occupations in St Augustine Beach are Office & Administration (283 | 10.2%), and Sales & Related (269 | 9.7%).
Sales and Office Occupations by Sex
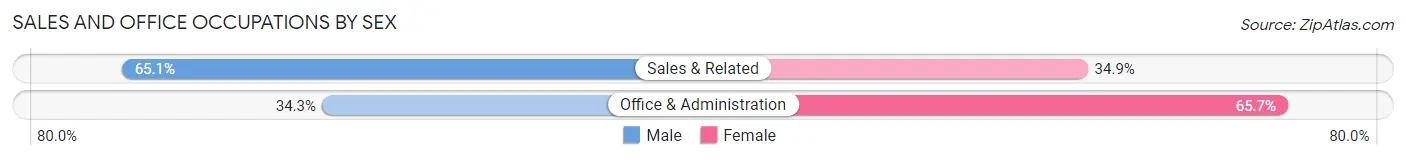
| Occupation | Male | Female |
| Sales & Related | 175 (65.1%) | 94 (34.9%) |
| Office & Administration | 97 (34.3%) | 186 (65.7%) |
| Total (Category) | 272 (49.3%) | 280 (50.7%) |
| Total (Overall) | 1,594 (57.6%) | 1,173 (42.4%) |
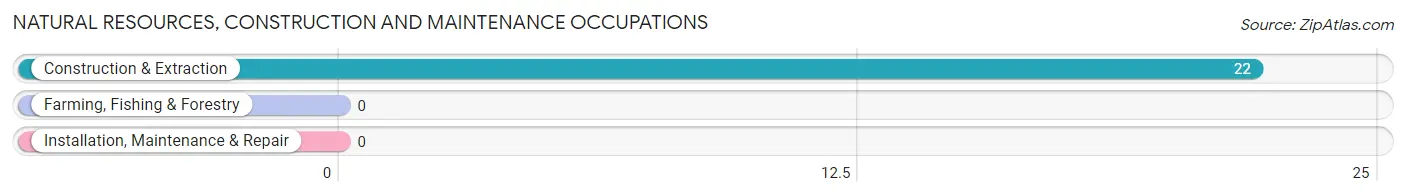
Natural Resources, Construction and Maintenance Occupations
The most common Natural Resources, Construction and Maintenance occupations in St Augustine Beach are , and Construction & Extraction (22 | 0.8%).
Natural Resources, Construction and Maintenance Occupations by Sex
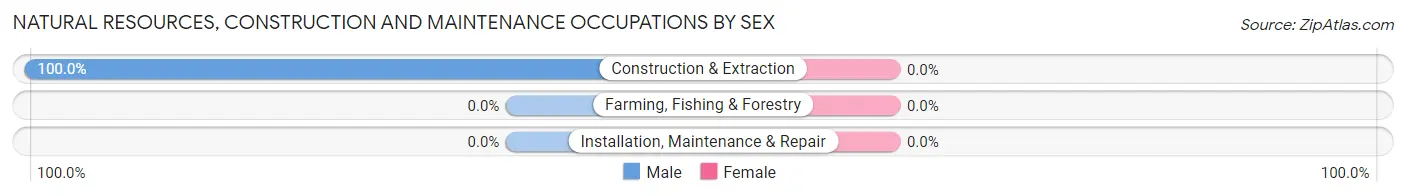
| Occupation | Male | Female |
| Farming, Fishing & Forestry | 0 (0.0%) | 0 (0.0%) |
| Construction & Extraction | 22 (100.0%) | 0 (0.0%) |
| Installation, Maintenance & Repair | 0 (0.0%) | 0 (0.0%) |
| Total (Category) | 22 (100.0%) | 0 (0.0%) |
| Total (Overall) | 1,594 (57.6%) | 1,173 (42.4%) |
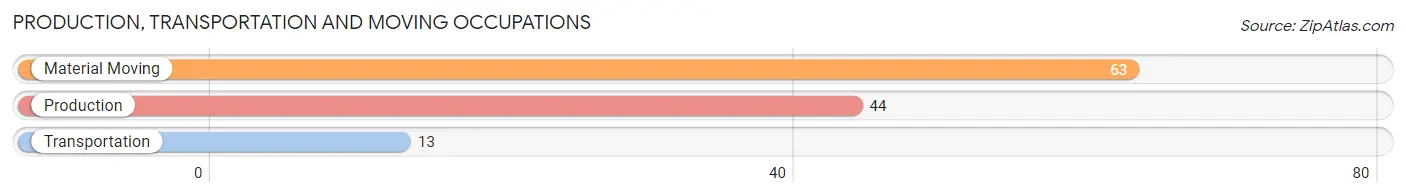
Production, Transportation and Moving Occupations
The most common Production, Transportation and Moving occupations in St Augustine Beach are Material Moving (63 | 2.3%), Production (44 | 1.6%), and Transportation (13 | 0.5%).
Production, Transportation and Moving Occupations by Sex
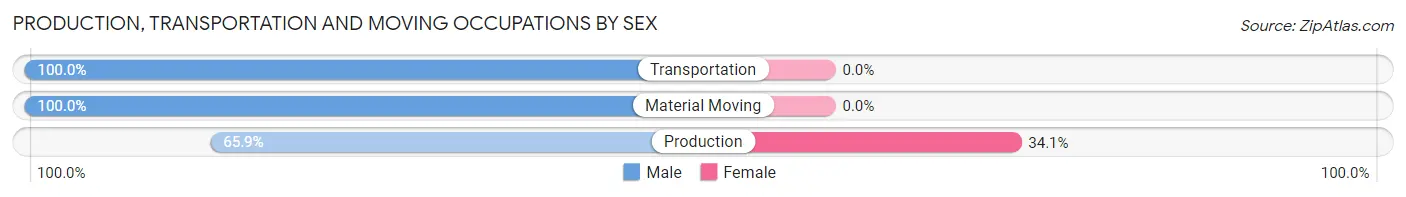
| Occupation | Male | Female |
| Production | 29 (65.9%) | 15 (34.1%) |
| Transportation | 13 (100.0%) | 0 (0.0%) |
| Material Moving | 63 (100.0%) | 0 (0.0%) |
| Total (Category) | 105 (87.5%) | 15 (12.5%) |
| Total (Overall) | 1,594 (57.6%) | 1,173 (42.4%) |
Employment Industries by Sex in St Augustine Beach
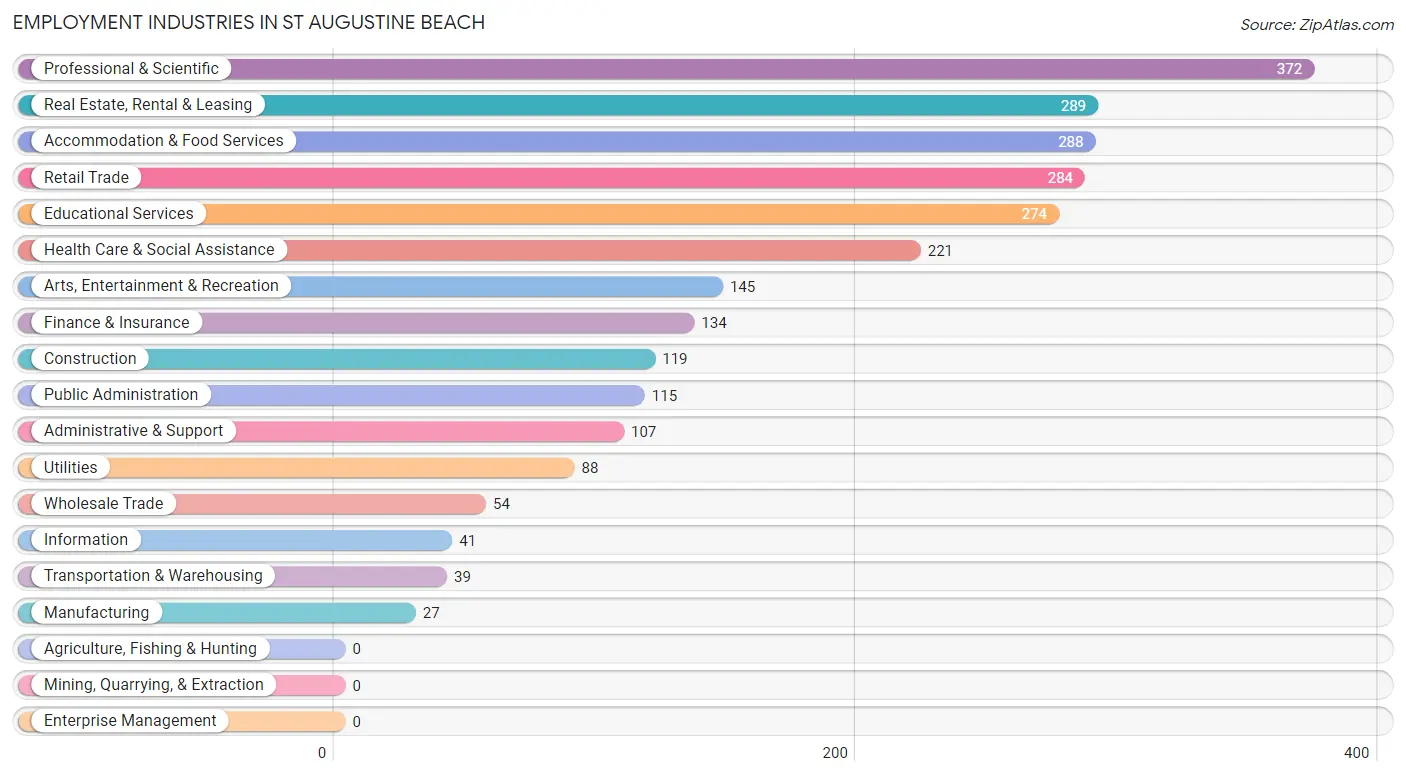
Employment Industries in St Augustine Beach
The major employment industries in St Augustine Beach include Professional & Scientific (372 | 13.4%), Real Estate, Rental & Leasing (289 | 10.4%), Accommodation & Food Services (288 | 10.4%), Retail Trade (284 | 10.3%), and Educational Services (274 | 9.9%).
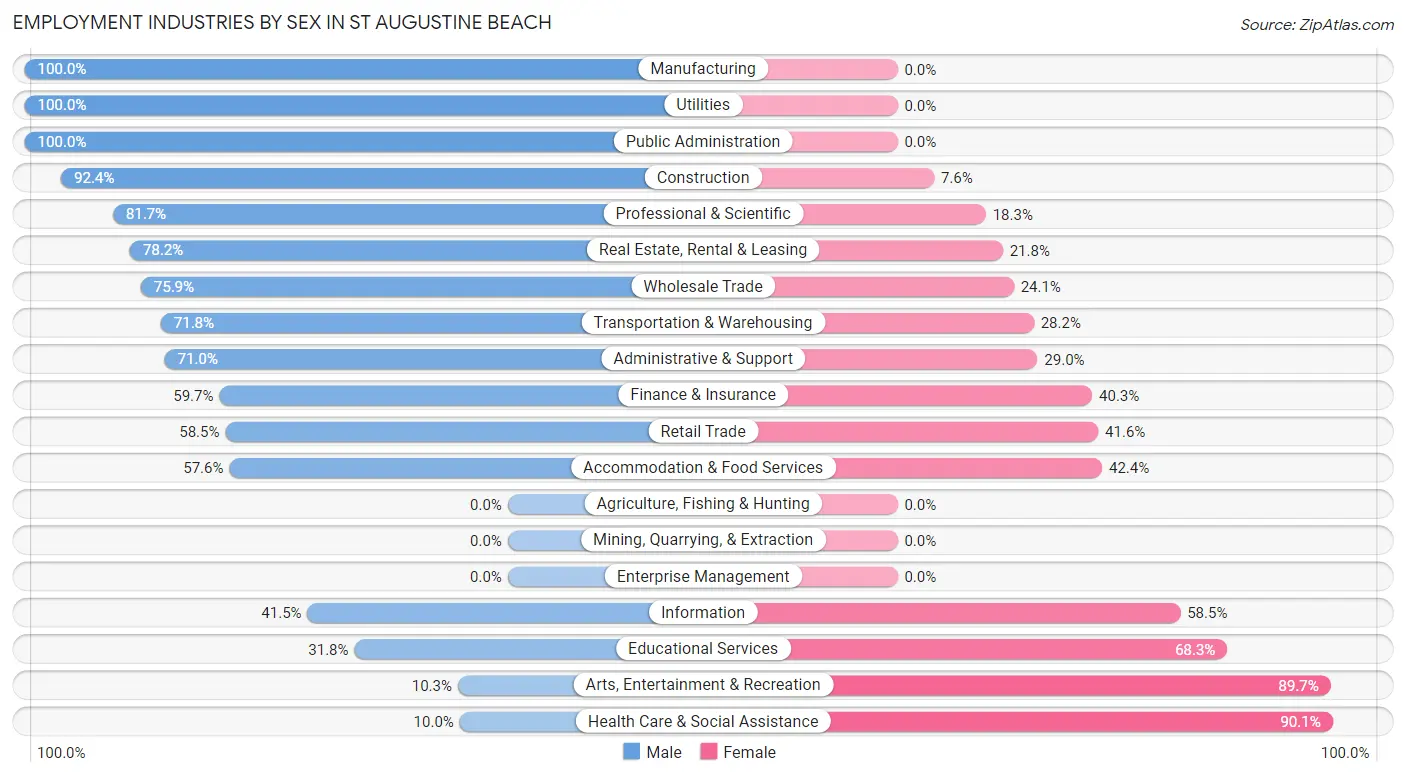
Employment Industries by Sex in St Augustine Beach
The St Augustine Beach industries that see more men than women are Manufacturing (100.0%), Utilities (100.0%), and Public Administration (100.0%), whereas the industries that tend to have a higher number of women are Health Care & Social Assistance (90.0%), Arts, Entertainment & Recreation (89.7%), and Educational Services (68.2%).
| Industry | Male | Female |
| Agriculture, Fishing & Hunting | 0 (0.0%) | 0 (0.0%) |
| Mining, Quarrying, & Extraction | 0 (0.0%) | 0 (0.0%) |
| Construction | 110 (92.4%) | 9 (7.6%) |
| Manufacturing | 27 (100.0%) | 0 (0.0%) |
| Wholesale Trade | 41 (75.9%) | 13 (24.1%) |
| Retail Trade | 166 (58.5%) | 118 (41.5%) |
| Transportation & Warehousing | 28 (71.8%) | 11 (28.2%) |
| Utilities | 88 (100.0%) | 0 (0.0%) |
| Information | 17 (41.5%) | 24 (58.5%) |
| Finance & Insurance | 80 (59.7%) | 54 (40.3%) |
| Real Estate, Rental & Leasing | 226 (78.2%) | 63 (21.8%) |
| Professional & Scientific | 304 (81.7%) | 68 (18.3%) |
| Enterprise Management | 0 (0.0%) | 0 (0.0%) |
| Administrative & Support | 76 (71.0%) | 31 (29.0%) |
| Educational Services | 87 (31.8%) | 187 (68.2%) |
| Health Care & Social Assistance | 22 (10.0%) | 199 (90.0%) |
| Arts, Entertainment & Recreation | 15 (10.3%) | 130 (89.7%) |
| Accommodation & Food Services | 166 (57.6%) | 122 (42.4%) |
| Public Administration | 115 (100.0%) | 0 (0.0%) |
| Total | 1,594 (57.6%) | 1,173 (42.4%) |
Education in St Augustine Beach
School Enrollment in St Augustine Beach
The most common levels of schooling among the 1,388 students in St Augustine Beach are middle school (386 | 27.8%), college / undergraduate (324 | 23.3%), and high school (319 | 23.0%).
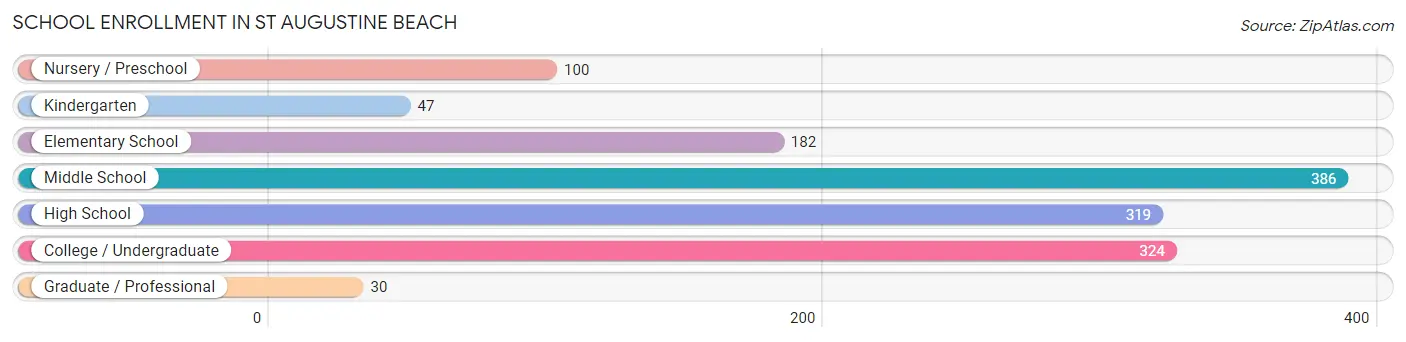
| School Level | # Students | % Students |
| Nursery / Preschool | 100 | 7.2% |
| Kindergarten | 47 | 3.4% |
| Elementary School | 182 | 13.1% |
| Middle School | 386 | 27.8% |
| High School | 319 | 23.0% |
| College / Undergraduate | 324 | 23.3% |
| Graduate / Professional | 30 | 2.2% |
| Total | 1,388 | 100.0% |
School Enrollment by Age by Funding Source in St Augustine Beach
Out of a total of 1,388 students who are enrolled in schools in St Augustine Beach, 464 (33.4%) attend a private institution, while the remaining 924 (66.6%) are enrolled in public schools. The age group of 25 to 34 year olds has the highest likelihood of being enrolled in private schools, with 26 (100.0% in the age bracket) enrolled. Conversely, the age group of 18 to 19 year olds has the lowest likelihood of being enrolled in a private school, with 125 (88.6% in the age bracket) attending a public institution.
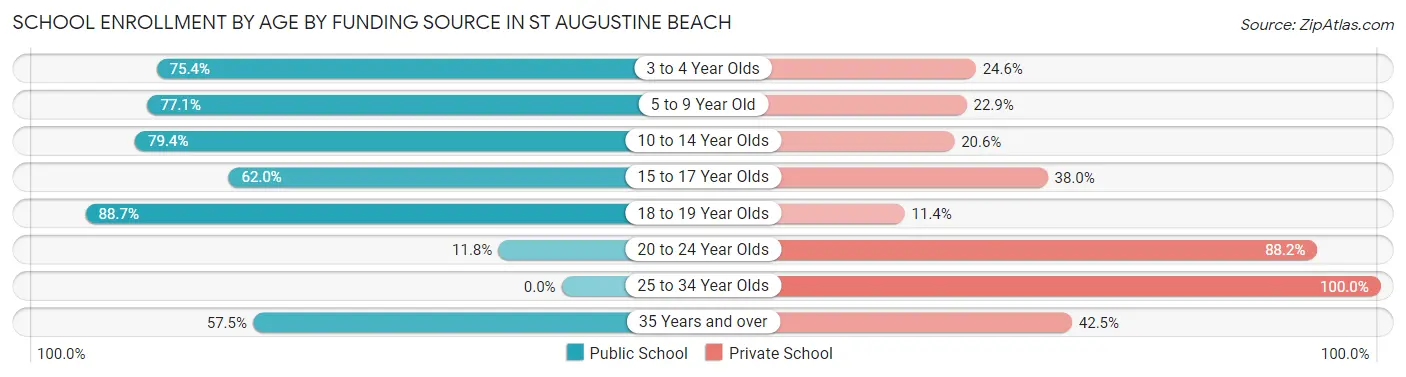
| Age Bracket | Public School | Private School |
| 3 to 4 Year Olds | 46 (75.4%) | 15 (24.6%) |
| 5 to 9 Year Old | 155 (77.1%) | 46 (22.9%) |
| 10 to 14 Year Olds | 405 (79.4%) | 105 (20.6%) |
| 15 to 17 Year Olds | 129 (62.0%) | 79 (38.0%) |
| 18 to 19 Year Olds | 125 (88.6%) | 16 (11.4%) |
| 20 to 24 Year Olds | 19 (11.8%) | 142 (88.2%) |
| 25 to 34 Year Olds | 0 (0.0%) | 26 (100.0%) |
| 35 Years and over | 46 (57.5%) | 34 (42.5%) |
| Total | 924 (66.6%) | 464 (33.4%) |
Educational Attainment by Field of Study in St Augustine Beach
Business (776 | 24.7%), communications (356 | 11.3%), education (340 | 10.8%), social sciences (291 | 9.3%), and bio, nature & agricultural (261 | 8.3%) are the most common fields of study among 3,143 individuals in St Augustine Beach who have obtained a bachelor's degree or higher.
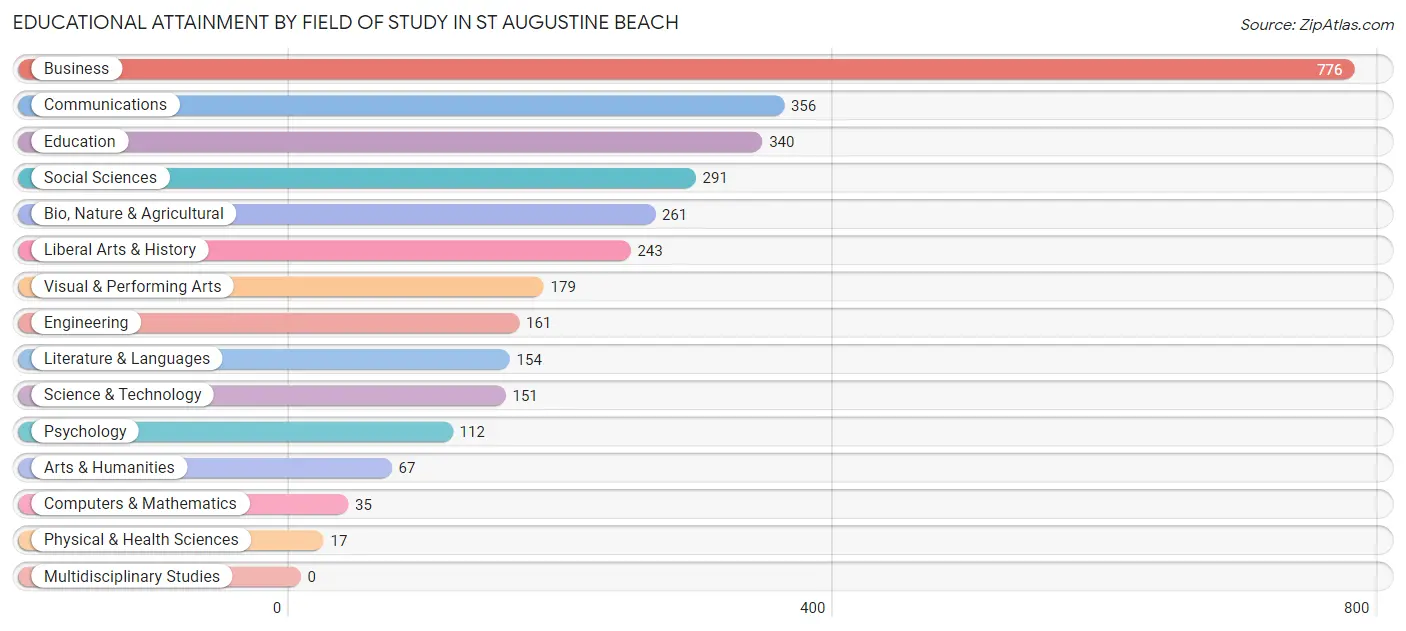
| Field of Study | # Graduates | % Graduates |
| Computers & Mathematics | 35 | 1.1% |
| Bio, Nature & Agricultural | 261 | 8.3% |
| Physical & Health Sciences | 17 | 0.5% |
| Psychology | 112 | 3.6% |
| Social Sciences | 291 | 9.3% |
| Engineering | 161 | 5.1% |
| Multidisciplinary Studies | 0 | 0.0% |
| Science & Technology | 151 | 4.8% |
| Business | 776 | 24.7% |
| Education | 340 | 10.8% |
| Literature & Languages | 154 | 4.9% |
| Liberal Arts & History | 243 | 7.7% |
| Visual & Performing Arts | 179 | 5.7% |
| Communications | 356 | 11.3% |
| Arts & Humanities | 67 | 2.1% |
| Total | 3,143 | 100.0% |
Transportation & Commute in St Augustine Beach
Vehicle Availability by Sex in St Augustine Beach
The most prevalent vehicle ownership categories in St Augustine Beach are males with 2 vehicles (763, accounting for 49.0%) and females with 2 vehicles (520, making up 65.1%).
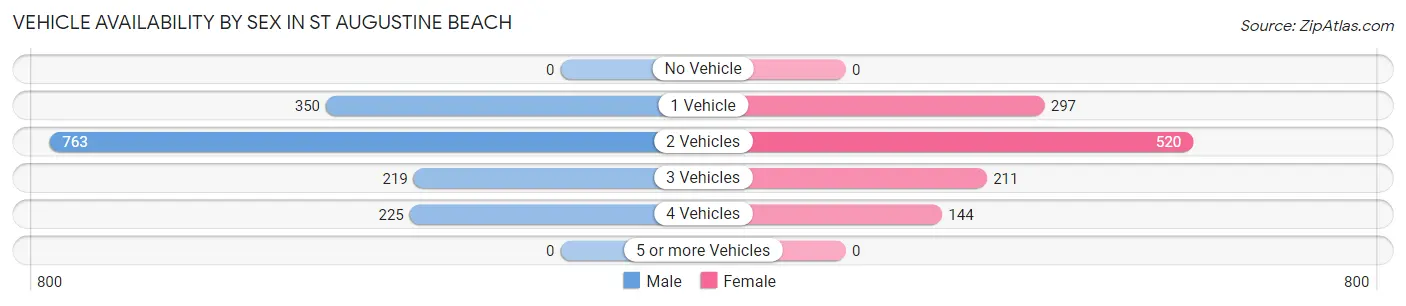
| Vehicles Available | Male | Female |
| No Vehicle | 0 (0.0%) | 0 (0.0%) |
| 1 Vehicle | 350 (22.5%) | 297 (25.3%) |
| 2 Vehicles | 763 (49.0%) | 520 (44.4%) |
| 3 Vehicles | 219 (14.1%) | 211 (18.0%) |
| 4 Vehicles | 225 (14.4%) | 144 (12.3%) |
| 5 or more Vehicles | 0 (0.0%) | 0 (0.0%) |
| Total | 1,557 (100.0%) | 1,172 (100.0%) |
Commute Time in St Augustine Beach
The most frequently occuring commute durations in St Augustine Beach are 20 to 24 minutes (433 commuters, 19.5%), 15 to 19 minutes (418 commuters, 18.8%), and 10 to 14 minutes (359 commuters, 16.2%).
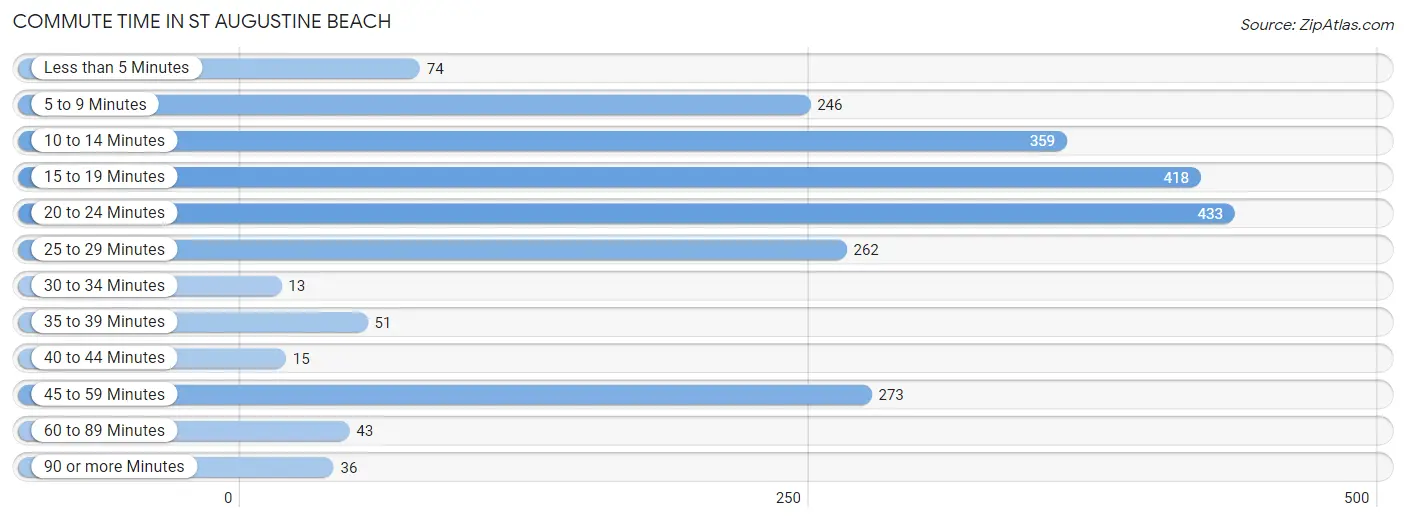
| Commute Time | # Commuters | % Commuters |
| Less than 5 Minutes | 74 | 3.3% |
| 5 to 9 Minutes | 246 | 11.1% |
| 10 to 14 Minutes | 359 | 16.2% |
| 15 to 19 Minutes | 418 | 18.8% |
| 20 to 24 Minutes | 433 | 19.5% |
| 25 to 29 Minutes | 262 | 11.8% |
| 30 to 34 Minutes | 13 | 0.6% |
| 35 to 39 Minutes | 51 | 2.3% |
| 40 to 44 Minutes | 15 | 0.7% |
| 45 to 59 Minutes | 273 | 12.3% |
| 60 to 89 Minutes | 43 | 1.9% |
| 90 or more Minutes | 36 | 1.6% |
Commute Time by Sex in St Augustine Beach
The most common commute times in St Augustine Beach are 20 to 24 minutes (317 commuters, 25.0%) for males and 15 to 19 minutes (290 commuters, 30.4%) for females.
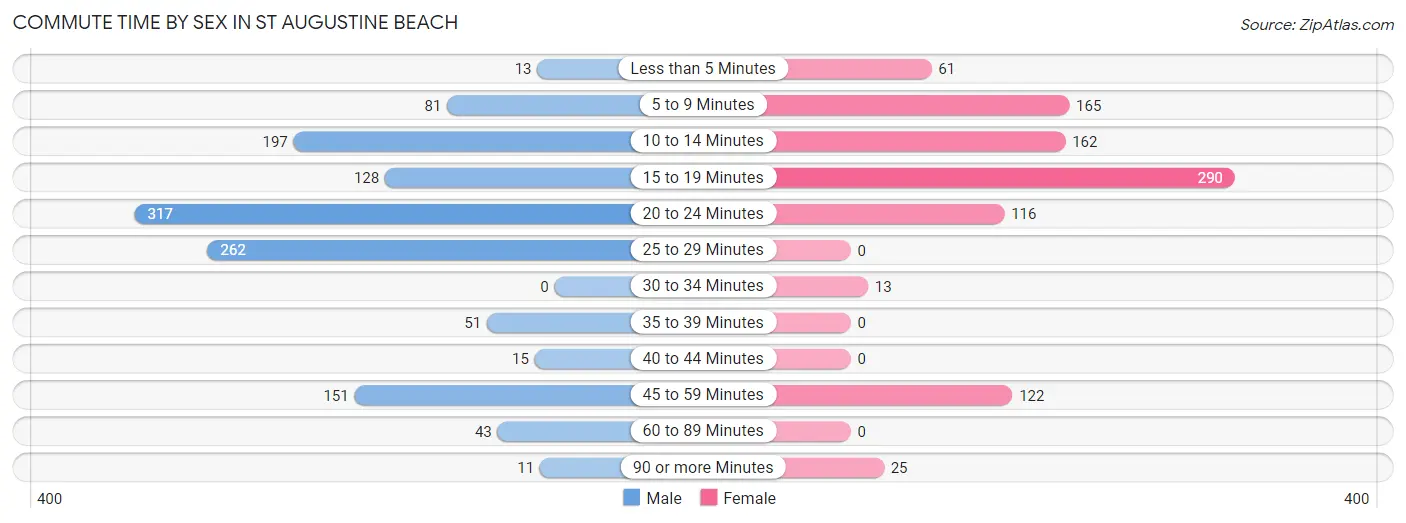
| Commute Time | Male | Female |
| Less than 5 Minutes | 13 (1.0%) | 61 (6.4%) |
| 5 to 9 Minutes | 81 (6.4%) | 165 (17.3%) |
| 10 to 14 Minutes | 197 (15.5%) | 162 (17.0%) |
| 15 to 19 Minutes | 128 (10.1%) | 290 (30.4%) |
| 20 to 24 Minutes | 317 (25.0%) | 116 (12.2%) |
| 25 to 29 Minutes | 262 (20.6%) | 0 (0.0%) |
| 30 to 34 Minutes | 0 (0.0%) | 13 (1.4%) |
| 35 to 39 Minutes | 51 (4.0%) | 0 (0.0%) |
| 40 to 44 Minutes | 15 (1.2%) | 0 (0.0%) |
| 45 to 59 Minutes | 151 (11.9%) | 122 (12.8%) |
| 60 to 89 Minutes | 43 (3.4%) | 0 (0.0%) |
| 90 or more Minutes | 11 (0.9%) | 25 (2.6%) |
Time of Departure to Work by Sex in St Augustine Beach
The most frequent times of departure to work in St Augustine Beach are 8:00 AM to 8:29 AM (462, 36.4%) for males and 7:00 AM to 7:29 AM (195, 20.4%) for females.
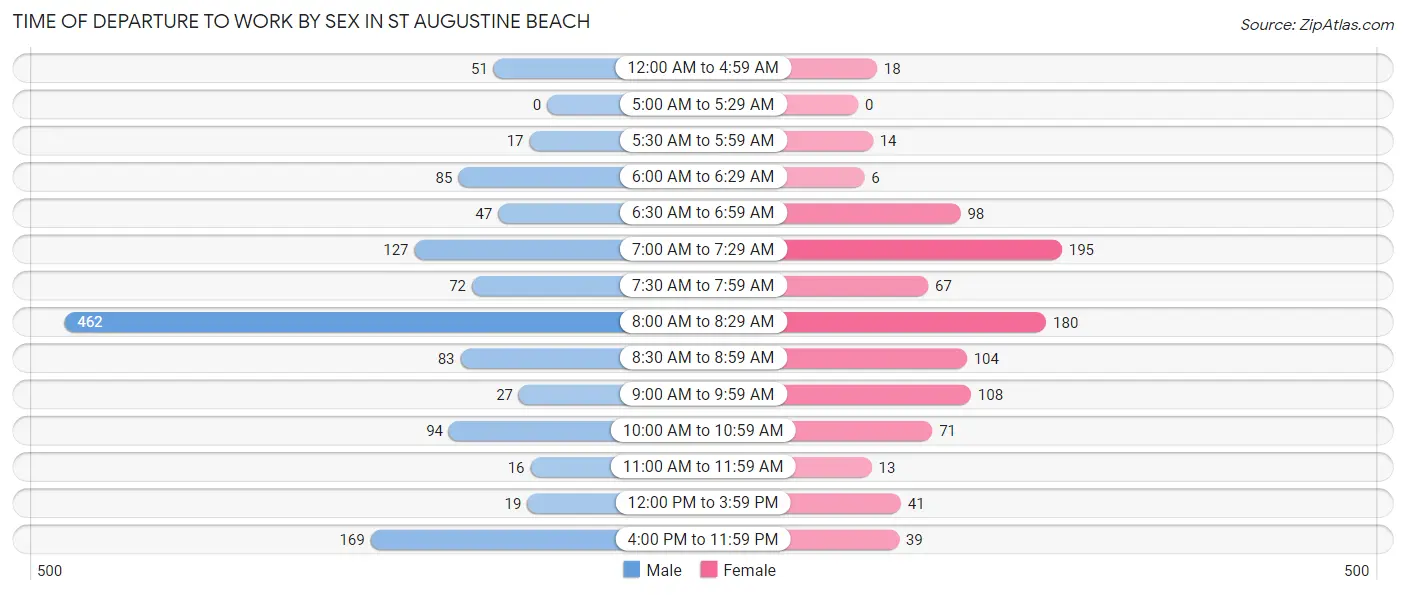
| Time of Departure | Male | Female |
| 12:00 AM to 4:59 AM | 51 (4.0%) | 18 (1.9%) |
| 5:00 AM to 5:29 AM | 0 (0.0%) | 0 (0.0%) |
| 5:30 AM to 5:59 AM | 17 (1.3%) | 14 (1.5%) |
| 6:00 AM to 6:29 AM | 85 (6.7%) | 6 (0.6%) |
| 6:30 AM to 6:59 AM | 47 (3.7%) | 98 (10.3%) |
| 7:00 AM to 7:29 AM | 127 (10.0%) | 195 (20.4%) |
| 7:30 AM to 7:59 AM | 72 (5.7%) | 67 (7.0%) |
| 8:00 AM to 8:29 AM | 462 (36.4%) | 180 (18.9%) |
| 8:30 AM to 8:59 AM | 83 (6.5%) | 104 (10.9%) |
| 9:00 AM to 9:59 AM | 27 (2.1%) | 108 (11.3%) |
| 10:00 AM to 10:59 AM | 94 (7.4%) | 71 (7.4%) |
| 11:00 AM to 11:59 AM | 16 (1.3%) | 13 (1.4%) |
| 12:00 PM to 3:59 PM | 19 (1.5%) | 41 (4.3%) |
| 4:00 PM to 11:59 PM | 169 (13.3%) | 39 (4.1%) |
| Total | 1,269 (100.0%) | 954 (100.0%) |
Housing Occupancy in St Augustine Beach
Occupancy by Ownership in St Augustine Beach
Of the total 3,047 dwellings in St Augustine Beach, owner-occupied units account for 2,281 (74.9%), while renter-occupied units make up 766 (25.1%).
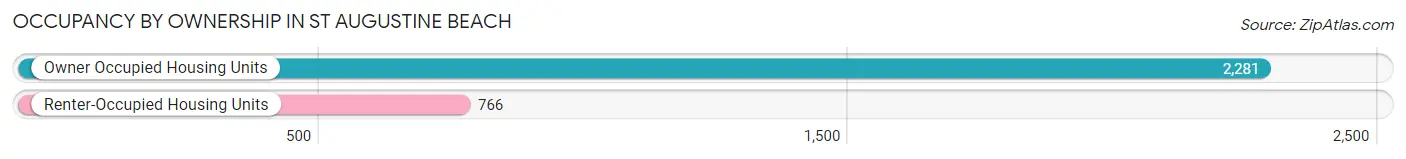
| Occupancy | # Housing Units | % Housing Units |
| Owner Occupied Housing Units | 2,281 | 74.9% |
| Renter-Occupied Housing Units | 766 | 25.1% |
| Total Occupied Housing Units | 3,047 | 100.0% |
Occupancy by Household Size in St Augustine Beach
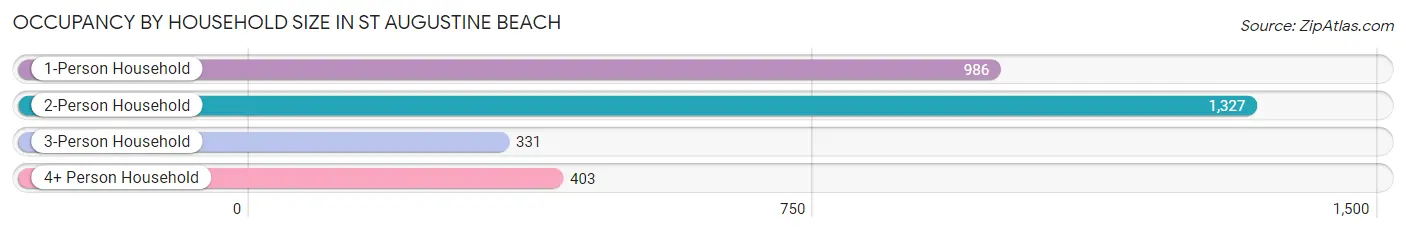
| Household Size | # Housing Units | % Housing Units |
| 1-Person Household | 986 | 32.4% |
| 2-Person Household | 1,327 | 43.5% |
| 3-Person Household | 331 | 10.9% |
| 4+ Person Household | 403 | 13.2% |
| Total Housing Units | 3,047 | 100.0% |
Occupancy by Ownership by Household Size in St Augustine Beach
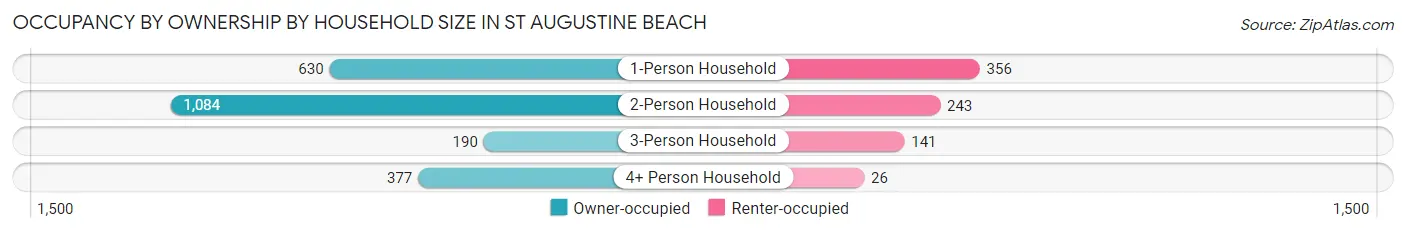
| Household Size | Owner-occupied | Renter-occupied |
| 1-Person Household | 630 (63.9%) | 356 (36.1%) |
| 2-Person Household | 1,084 (81.7%) | 243 (18.3%) |
| 3-Person Household | 190 (57.4%) | 141 (42.6%) |
| 4+ Person Household | 377 (93.5%) | 26 (6.5%) |
| Total Housing Units | 2,281 (74.9%) | 766 (25.1%) |
Occupancy by Educational Attainment in St Augustine Beach
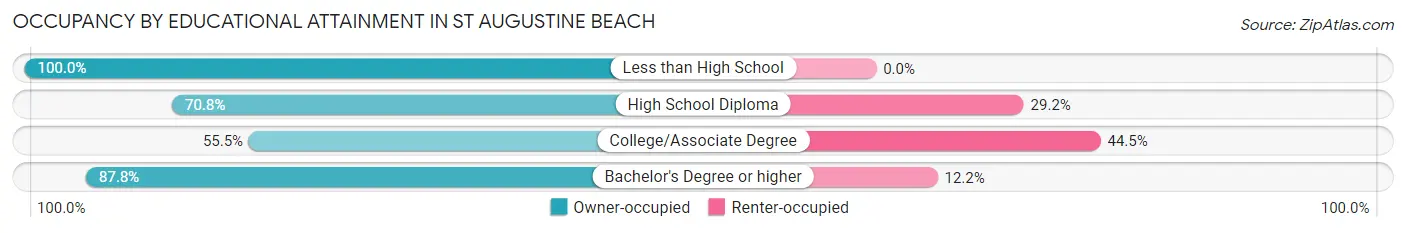
| Household Size | Owner-occupied | Renter-occupied |
| Less than High School | 19 (100.0%) | 0 (0.0%) |
| High School Diploma | 242 (70.8%) | 100 (29.2%) |
| College/Associate Degree | 583 (55.5%) | 467 (44.5%) |
| Bachelor's Degree or higher | 1,437 (87.8%) | 199 (12.2%) |
Occupancy by Age of Householder in St Augustine Beach
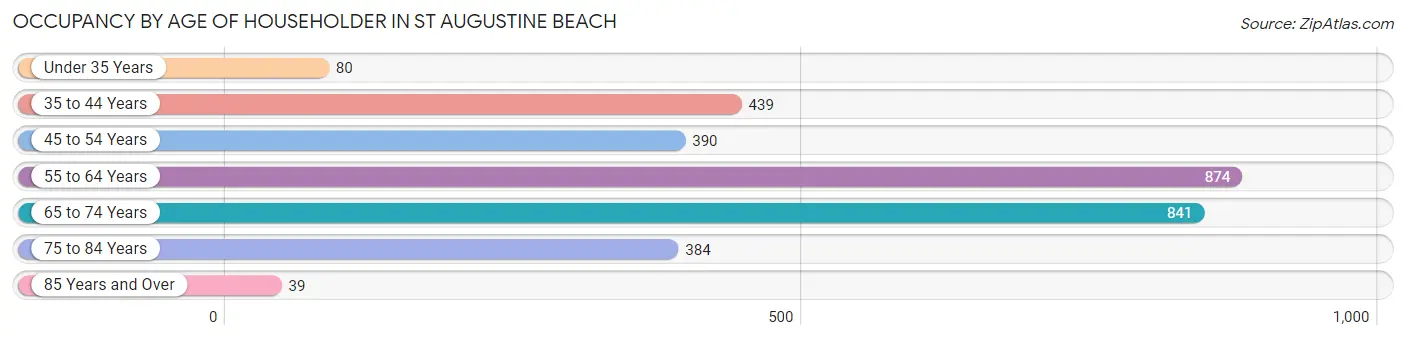
| Age Bracket | # Households | % Households |
| Under 35 Years | 80 | 2.6% |
| 35 to 44 Years | 439 | 14.4% |
| 45 to 54 Years | 390 | 12.8% |
| 55 to 64 Years | 874 | 28.7% |
| 65 to 74 Years | 841 | 27.6% |
| 75 to 84 Years | 384 | 12.6% |
| 85 Years and Over | 39 | 1.3% |
| Total | 3,047 | 100.0% |
Housing Finances in St Augustine Beach
Median Income by Occupancy in St Augustine Beach

| Occupancy Type | # Households | Median Income |
| Owner-Occupied | 2,281 (74.9%) | $114,453 |
| Renter-Occupied | 766 (25.1%) | $65,376 |
| Average | 3,047 (100.0%) | $87,019 |
Occupancy by Householder Income Bracket in St Augustine Beach
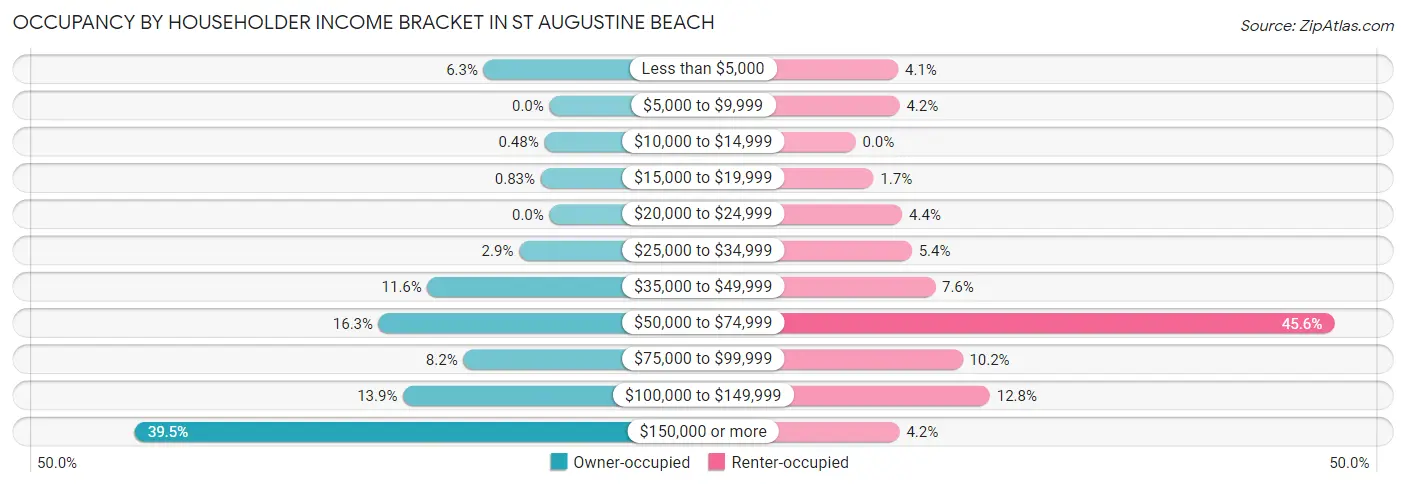
| Income Bracket | Owner-occupied | Renter-occupied |
| Less than $5,000 | 143 (6.3%) | 31 (4.1%) |
| $5,000 to $9,999 | 0 (0.0%) | 32 (4.2%) |
| $10,000 to $14,999 | 11 (0.5%) | 0 (0.0%) |
| $15,000 to $19,999 | 19 (0.8%) | 13 (1.7%) |
| $20,000 to $24,999 | 0 (0.0%) | 34 (4.4%) |
| $25,000 to $34,999 | 66 (2.9%) | 41 (5.3%) |
| $35,000 to $49,999 | 265 (11.6%) | 58 (7.6%) |
| $50,000 to $74,999 | 371 (16.3%) | 349 (45.6%) |
| $75,000 to $99,999 | 187 (8.2%) | 78 (10.2%) |
| $100,000 to $149,999 | 318 (13.9%) | 98 (12.8%) |
| $150,000 or more | 901 (39.5%) | 32 (4.2%) |
| Total | 2,281 (100.0%) | 766 (100.0%) |
Monthly Housing Cost Tiers in St Augustine Beach
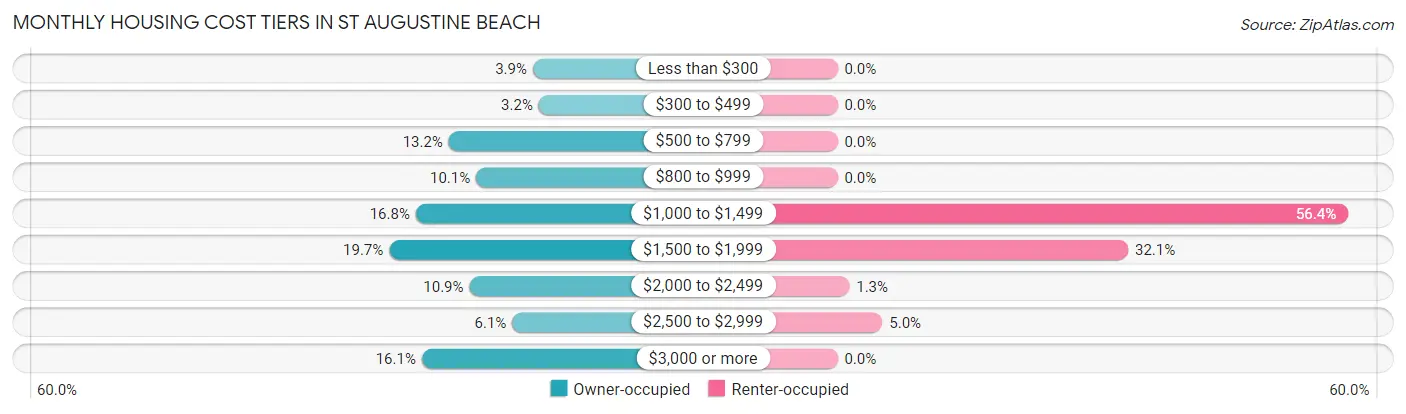
| Monthly Cost | Owner-occupied | Renter-occupied |
| Less than $300 | 88 (3.9%) | 0 (0.0%) |
| $300 to $499 | 73 (3.2%) | 0 (0.0%) |
| $500 to $799 | 300 (13.2%) | 0 (0.0%) |
| $800 to $999 | 231 (10.1%) | 0 (0.0%) |
| $1,000 to $1,499 | 383 (16.8%) | 432 (56.4%) |
| $1,500 to $1,999 | 450 (19.7%) | 246 (32.1%) |
| $2,000 to $2,499 | 248 (10.9%) | 10 (1.3%) |
| $2,500 to $2,999 | 140 (6.1%) | 38 (5.0%) |
| $3,000 or more | 368 (16.1%) | 0 (0.0%) |
| Total | 2,281 (100.0%) | 766 (100.0%) |
Physical Housing Characteristics in St Augustine Beach
Housing Structures in St Augustine Beach
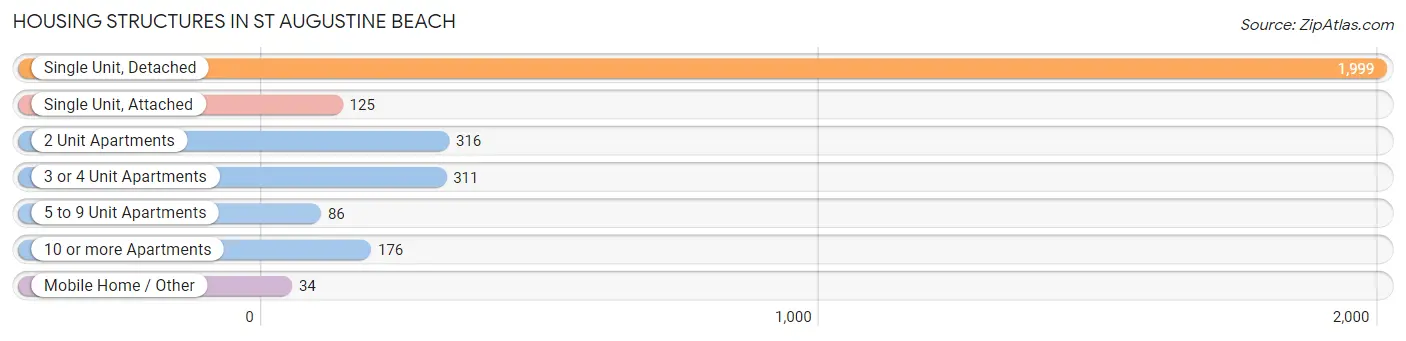
| Structure Type | # Housing Units | % Housing Units |
| Single Unit, Detached | 1,999 | 65.6% |
| Single Unit, Attached | 125 | 4.1% |
| 2 Unit Apartments | 316 | 10.4% |
| 3 or 4 Unit Apartments | 311 | 10.2% |
| 5 to 9 Unit Apartments | 86 | 2.8% |
| 10 or more Apartments | 176 | 5.8% |
| Mobile Home / Other | 34 | 1.1% |
| Total | 3,047 | 100.0% |
Housing Structures by Occupancy in St Augustine Beach
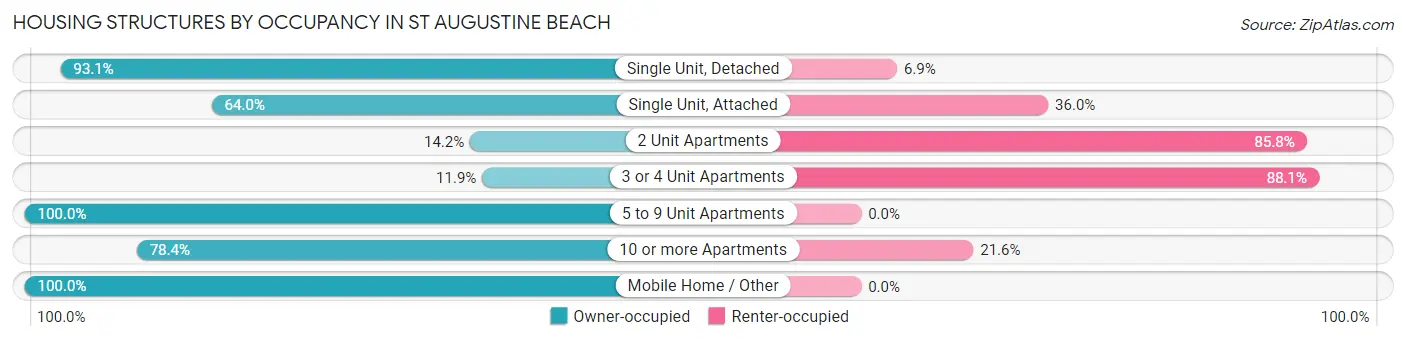
| Structure Type | Owner-occupied | Renter-occupied |
| Single Unit, Detached | 1,861 (93.1%) | 138 (6.9%) |
| Single Unit, Attached | 80 (64.0%) | 45 (36.0%) |
| 2 Unit Apartments | 45 (14.2%) | 271 (85.8%) |
| 3 or 4 Unit Apartments | 37 (11.9%) | 274 (88.1%) |
| 5 to 9 Unit Apartments | 86 (100.0%) | 0 (0.0%) |
| 10 or more Apartments | 138 (78.4%) | 38 (21.6%) |
| Mobile Home / Other | 34 (100.0%) | 0 (0.0%) |
| Total | 2,281 (74.9%) | 766 (25.1%) |
Housing Structures by Number of Rooms in St Augustine Beach
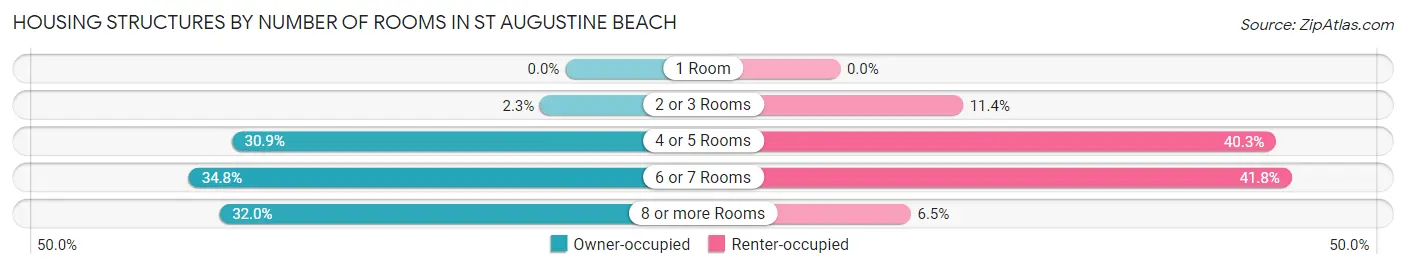
| Number of Rooms | Owner-occupied | Renter-occupied |
| 1 Room | 0 (0.0%) | 0 (0.0%) |
| 2 or 3 Rooms | 53 (2.3%) | 87 (11.4%) |
| 4 or 5 Rooms | 704 (30.9%) | 309 (40.3%) |
| 6 or 7 Rooms | 794 (34.8%) | 320 (41.8%) |
| 8 or more Rooms | 730 (32.0%) | 50 (6.5%) |
| Total | 2,281 (100.0%) | 766 (100.0%) |
Housing Structure by Heating Type in St Augustine Beach
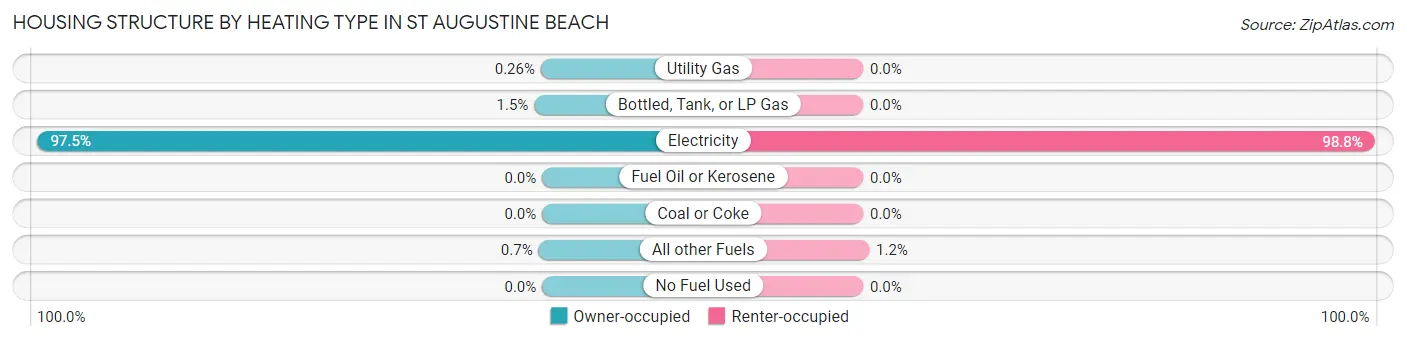
| Heating Type | Owner-occupied | Renter-occupied |
| Utility Gas | 6 (0.3%) | 0 (0.0%) |
| Bottled, Tank, or LP Gas | 35 (1.5%) | 0 (0.0%) |
| Electricity | 2,224 (97.5%) | 757 (98.8%) |
| Fuel Oil or Kerosene | 0 (0.0%) | 0 (0.0%) |
| Coal or Coke | 0 (0.0%) | 0 (0.0%) |
| All other Fuels | 16 (0.7%) | 9 (1.2%) |
| No Fuel Used | 0 (0.0%) | 0 (0.0%) |
| Total | 2,281 (100.0%) | 766 (100.0%) |
Household Vehicle Usage in St Augustine Beach
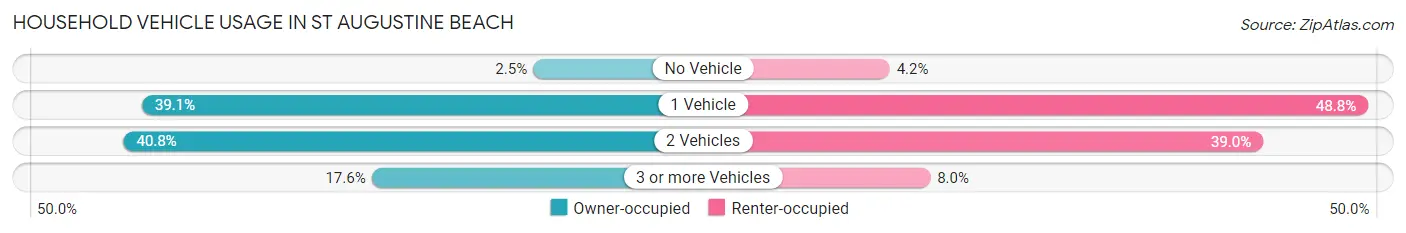
| Vehicles per Household | Owner-occupied | Renter-occupied |
| No Vehicle | 58 (2.5%) | 32 (4.2%) |
| 1 Vehicle | 891 (39.1%) | 374 (48.8%) |
| 2 Vehicles | 930 (40.8%) | 299 (39.0%) |
| 3 or more Vehicles | 402 (17.6%) | 61 (8.0%) |
| Total | 2,281 (100.0%) | 766 (100.0%) |
Real Estate & Mortgages in St Augustine Beach
Real Estate and Mortgage Overview in St Augustine Beach
| Characteristic | Without Mortgage | With Mortgage |
| Housing Units | 981 | 1,300 |
| Median Property Value | $487,600 | $516,300 |
| Median Household Income | $89,522 | $638 |
| Monthly Housing Costs | $837 | $368 |
| Real Estate Taxes | $3,645 | $11 |
Property Value by Mortgage Status in St Augustine Beach
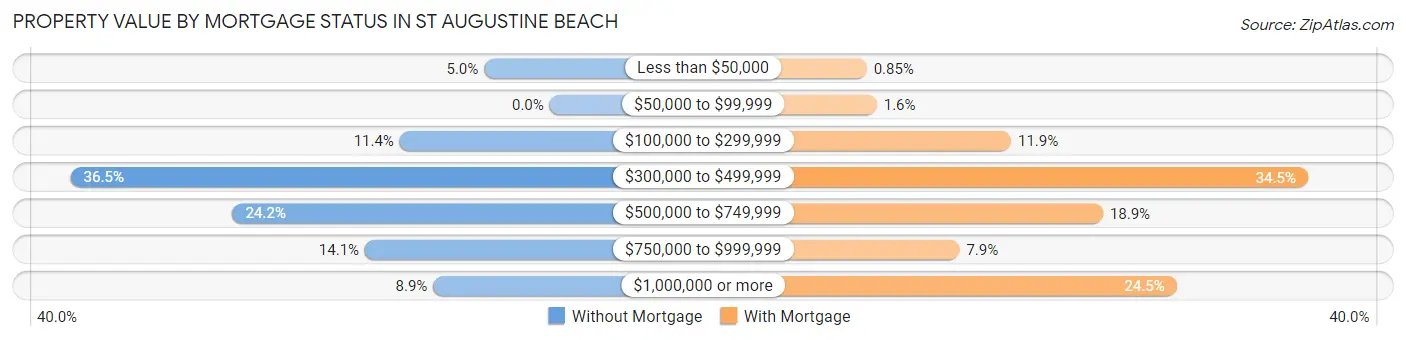
| Property Value | Without Mortgage | With Mortgage |
| Less than $50,000 | 49 (5.0%) | 11 (0.9%) |
| $50,000 to $99,999 | 0 (0.0%) | 21 (1.6%) |
| $100,000 to $299,999 | 112 (11.4%) | 154 (11.8%) |
| $300,000 to $499,999 | 358 (36.5%) | 448 (34.5%) |
| $500,000 to $749,999 | 237 (24.2%) | 245 (18.9%) |
| $750,000 to $999,999 | 138 (14.1%) | 103 (7.9%) |
| $1,000,000 or more | 87 (8.9%) | 318 (24.5%) |
| Total | 981 (100.0%) | 1,300 (100.0%) |
Household Income by Mortgage Status in St Augustine Beach
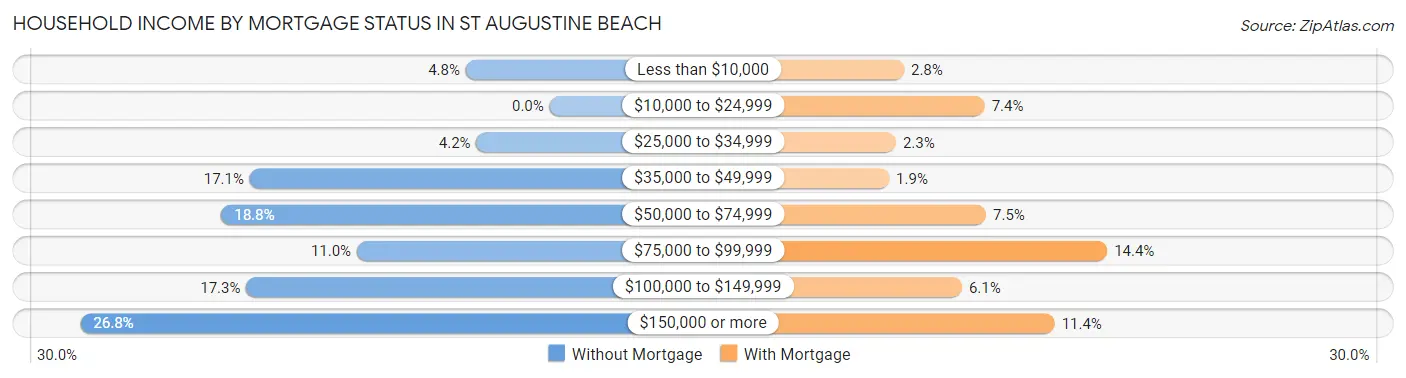
| Household Income | Without Mortgage | With Mortgage |
| Less than $10,000 | 47 (4.8%) | 36 (2.8%) |
| $10,000 to $24,999 | 0 (0.0%) | 96 (7.4%) |
| $25,000 to $34,999 | 41 (4.2%) | 30 (2.3%) |
| $35,000 to $49,999 | 168 (17.1%) | 25 (1.9%) |
| $50,000 to $74,999 | 184 (18.8%) | 97 (7.5%) |
| $75,000 to $99,999 | 108 (11.0%) | 187 (14.4%) |
| $100,000 to $149,999 | 170 (17.3%) | 79 (6.1%) |
| $150,000 or more | 263 (26.8%) | 148 (11.4%) |
| Total | 981 (100.0%) | 1,300 (100.0%) |
Property Value to Household Income Ratio in St Augustine Beach
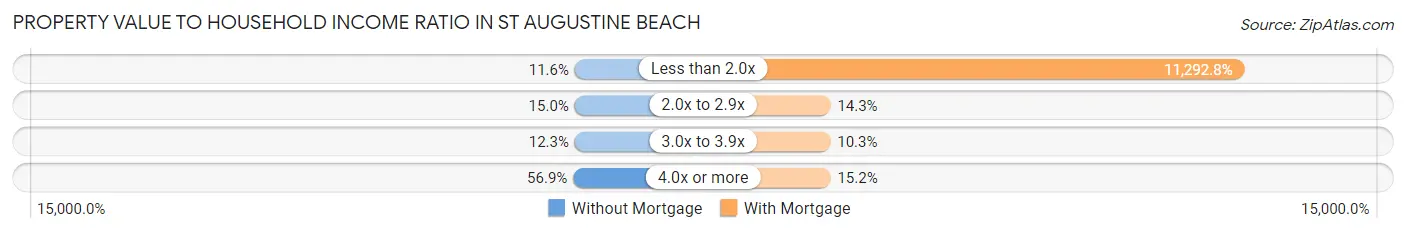
| Value-to-Income Ratio | Without Mortgage | With Mortgage |
| Less than 2.0x | 114 (11.6%) | 146,806 (11,292.8%) |
| 2.0x to 2.9x | 147 (15.0%) | 186 (14.3%) |
| 3.0x to 3.9x | 121 (12.3%) | 134 (10.3%) |
| 4.0x or more | 558 (56.9%) | 197 (15.1%) |
| Total | 981 (100.0%) | 1,300 (100.0%) |
Real Estate Taxes by Mortgage Status in St Augustine Beach
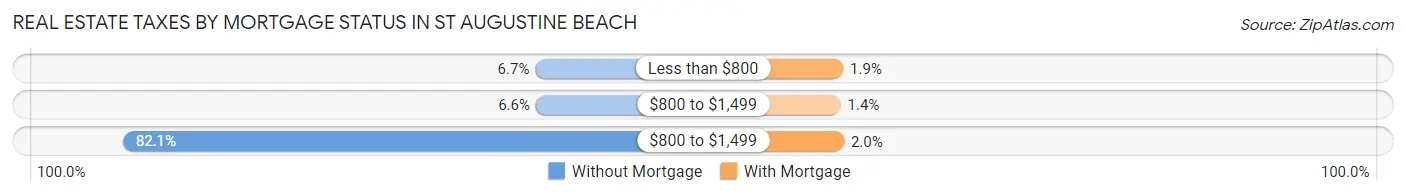
| Property Taxes | Without Mortgage | With Mortgage |
| Less than $800 | 66 (6.7%) | 24 (1.8%) |
| $800 to $1,499 | 65 (6.6%) | 18 (1.4%) |
| $800 to $1,499 | 805 (82.1%) | 26 (2.0%) |
| Total | 981 (100.0%) | 1,300 (100.0%) |
Health & Disability in St Augustine Beach
Health Insurance Coverage by Age in St Augustine Beach
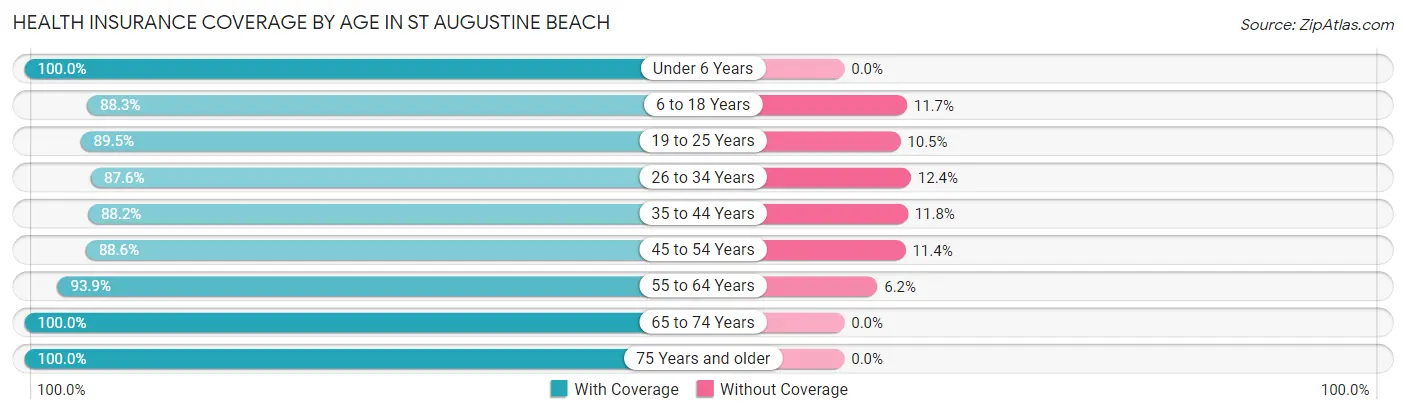
| Age Bracket | With Coverage | Without Coverage |
| Under 6 Years | 148 (100.0%) | 0 (0.0%) |
| 6 to 18 Years | 833 (88.3%) | 110 (11.7%) |
| 19 to 25 Years | 291 (89.5%) | 34 (10.5%) |
| 26 to 34 Years | 127 (87.6%) | 18 (12.4%) |
| 35 to 44 Years | 918 (88.2%) | 123 (11.8%) |
| 45 to 54 Years | 753 (88.6%) | 97 (11.4%) |
| 55 to 64 Years | 1,404 (93.9%) | 92 (6.1%) |
| 65 to 74 Years | 1,197 (100.0%) | 0 (0.0%) |
| 75 Years and older | 629 (100.0%) | 0 (0.0%) |
| Total | 6,300 (93.0%) | 474 (7.0%) |
Health Insurance Coverage by Citizenship Status in St Augustine Beach
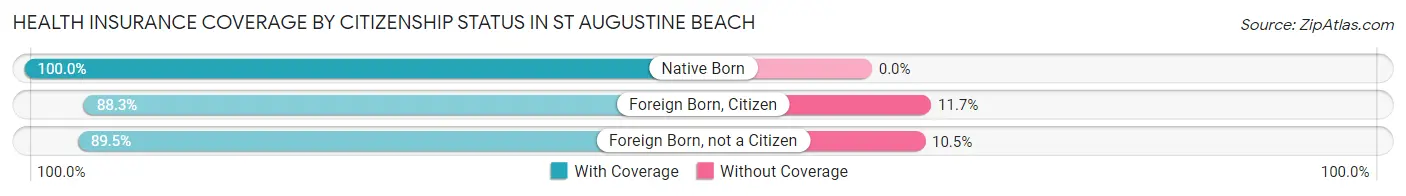
| Citizenship Status | With Coverage | Without Coverage |
| Native Born | 148 (100.0%) | 0 (0.0%) |
| Foreign Born, Citizen | 833 (88.3%) | 110 (11.7%) |
| Foreign Born, not a Citizen | 291 (89.5%) | 34 (10.5%) |
Health Insurance Coverage by Household Income in St Augustine Beach
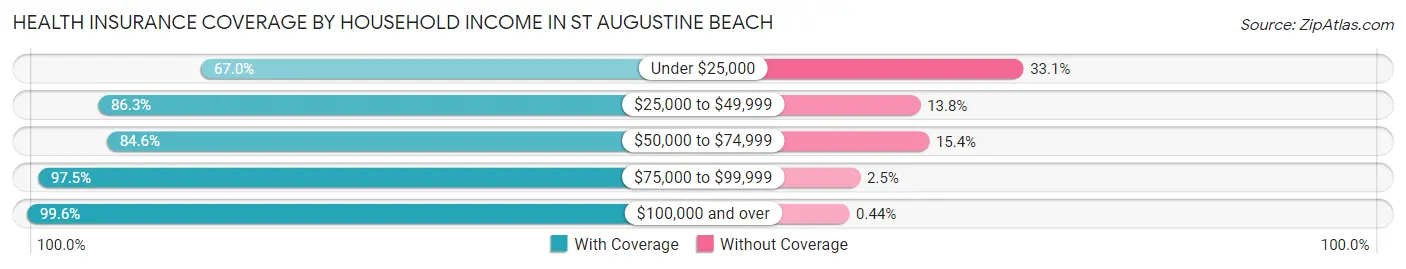
| Household Income | With Coverage | Without Coverage |
| Under $25,000 | 237 (66.9%) | 117 (33.1%) |
| $25,000 to $49,999 | 671 (86.3%) | 107 (13.8%) |
| $50,000 to $74,999 | 1,204 (84.6%) | 219 (15.4%) |
| $75,000 to $99,999 | 587 (97.5%) | 15 (2.5%) |
| $100,000 and over | 3,590 (99.6%) | 16 (0.4%) |
Public vs Private Health Insurance Coverage by Age in St Augustine Beach
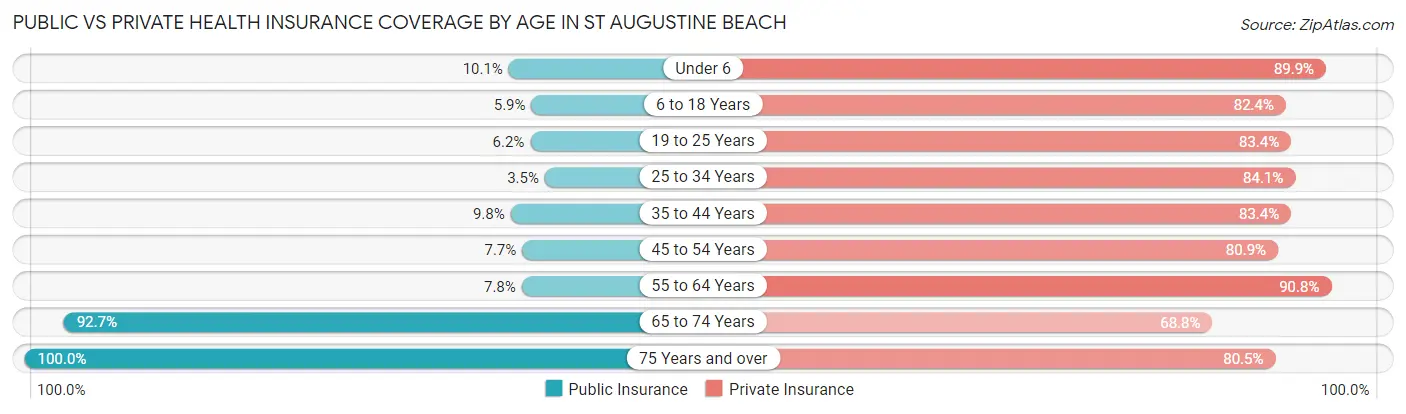
| Age Bracket | Public Insurance | Private Insurance |
| Under 6 | 15 (10.1%) | 133 (89.9%) |
| 6 to 18 Years | 56 (5.9%) | 777 (82.4%) |
| 19 to 25 Years | 20 (6.1%) | 271 (83.4%) |
| 25 to 34 Years | 5 (3.5%) | 122 (84.1%) |
| 35 to 44 Years | 102 (9.8%) | 868 (83.4%) |
| 45 to 54 Years | 65 (7.6%) | 688 (80.9%) |
| 55 to 64 Years | 116 (7.7%) | 1,359 (90.8%) |
| 65 to 74 Years | 1,110 (92.7%) | 823 (68.8%) |
| 75 Years and over | 629 (100.0%) | 506 (80.4%) |
| Total | 2,118 (31.3%) | 5,547 (81.9%) |
Disability Status by Sex by Age in St Augustine Beach
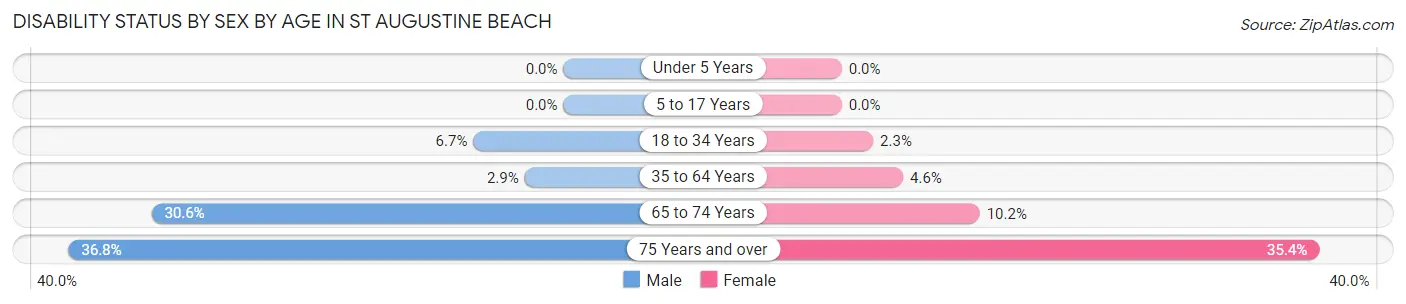
| Age Bracket | Male | Female |
| Under 5 Years | 0 (0.0%) | 0 (0.0%) |
| 5 to 17 Years | 0 (0.0%) | 0 (0.0%) |
| 18 to 34 Years | 19 (6.7%) | 6 (2.3%) |
| 35 to 64 Years | 50 (2.9%) | 75 (4.5%) |
| 65 to 74 Years | 178 (30.6%) | 63 (10.2%) |
| 75 Years and over | 86 (36.7%) | 140 (35.4%) |
Disability Class by Sex by Age in St Augustine Beach
Disability Class: Hearing Difficulty
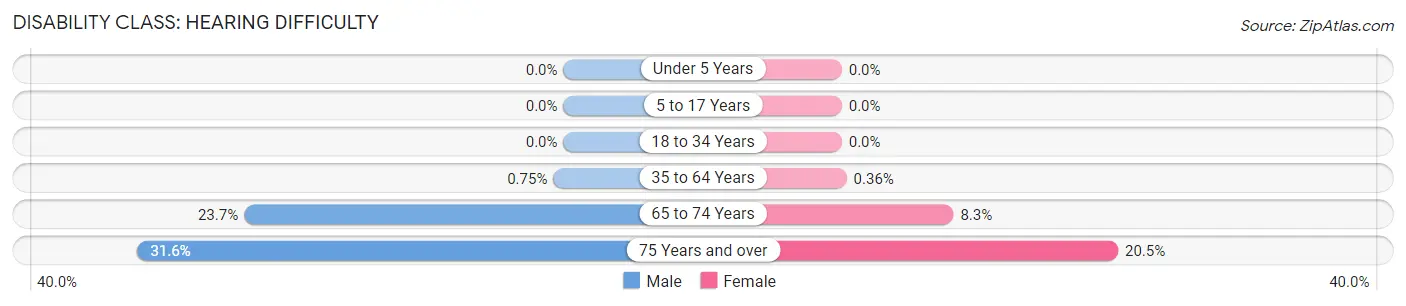
| Age Bracket | Male | Female |
| Under 5 Years | 0 (0.0%) | 0 (0.0%) |
| 5 to 17 Years | 0 (0.0%) | 0 (0.0%) |
| 18 to 34 Years | 0 (0.0%) | 0 (0.0%) |
| 35 to 64 Years | 13 (0.7%) | 6 (0.4%) |
| 65 to 74 Years | 138 (23.7%) | 51 (8.3%) |
| 75 Years and over | 74 (31.6%) | 81 (20.5%) |
Disability Class: Vision Difficulty
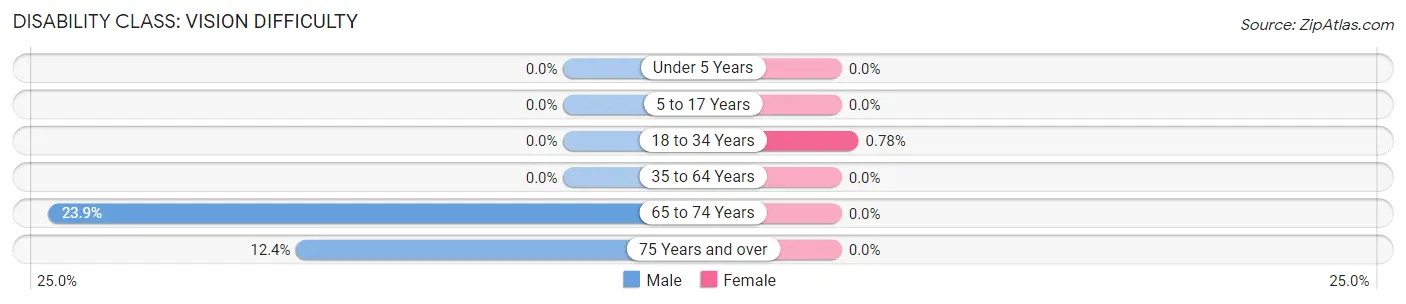
| Age Bracket | Male | Female |
| Under 5 Years | 0 (0.0%) | 0 (0.0%) |
| 5 to 17 Years | 0 (0.0%) | 0 (0.0%) |
| 18 to 34 Years | 0 (0.0%) | 2 (0.8%) |
| 35 to 64 Years | 0 (0.0%) | 0 (0.0%) |
| 65 to 74 Years | 139 (23.9%) | 0 (0.0%) |
| 75 Years and over | 29 (12.4%) | 0 (0.0%) |
Disability Class: Cognitive Difficulty
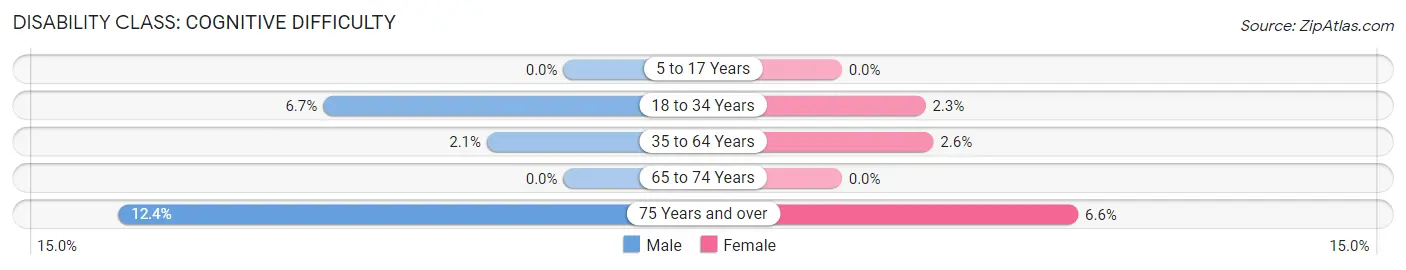
| Age Bracket | Male | Female |
| 5 to 17 Years | 0 (0.0%) | 0 (0.0%) |
| 18 to 34 Years | 19 (6.7%) | 6 (2.3%) |
| 35 to 64 Years | 37 (2.1%) | 42 (2.5%) |
| 65 to 74 Years | 0 (0.0%) | 0 (0.0%) |
| 75 Years and over | 29 (12.4%) | 26 (6.6%) |
Disability Class: Ambulatory Difficulty
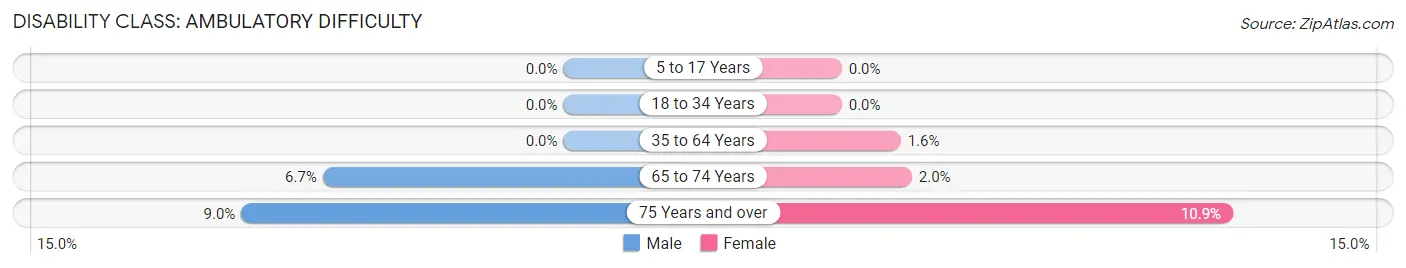
| Age Bracket | Male | Female |
| 5 to 17 Years | 0 (0.0%) | 0 (0.0%) |
| 18 to 34 Years | 0 (0.0%) | 0 (0.0%) |
| 35 to 64 Years | 0 (0.0%) | 27 (1.6%) |
| 65 to 74 Years | 39 (6.7%) | 12 (1.9%) |
| 75 Years and over | 21 (9.0%) | 43 (10.9%) |
Disability Class: Self-Care Difficulty
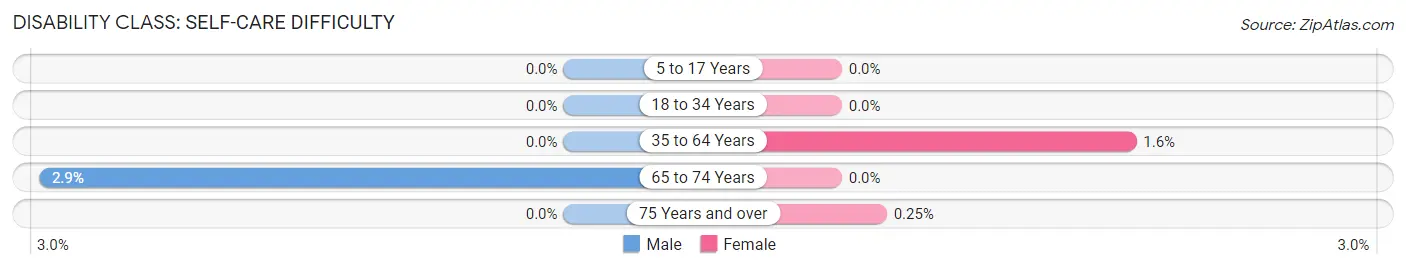
| Age Bracket | Male | Female |
| 5 to 17 Years | 0 (0.0%) | 0 (0.0%) |
| 18 to 34 Years | 0 (0.0%) | 0 (0.0%) |
| 35 to 64 Years | 0 (0.0%) | 27 (1.6%) |
| 65 to 74 Years | 17 (2.9%) | 0 (0.0%) |
| 75 Years and over | 0 (0.0%) | 1 (0.3%) |
Technology Access in St Augustine Beach
Computing Device Access in St Augustine Beach
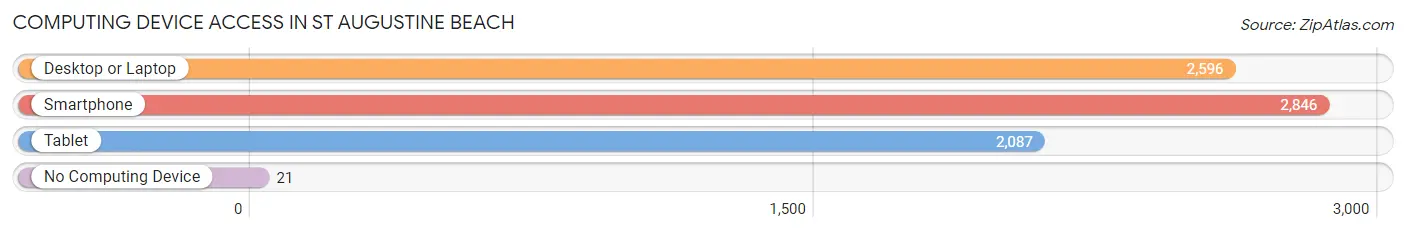
| Device Type | # Households | % Households |
| Desktop or Laptop | 2,596 | 85.2% |
| Smartphone | 2,846 | 93.4% |
| Tablet | 2,087 | 68.5% |
| No Computing Device | 21 | 0.7% |
| Total | 3,047 | 100.0% |
Internet Access in St Augustine Beach
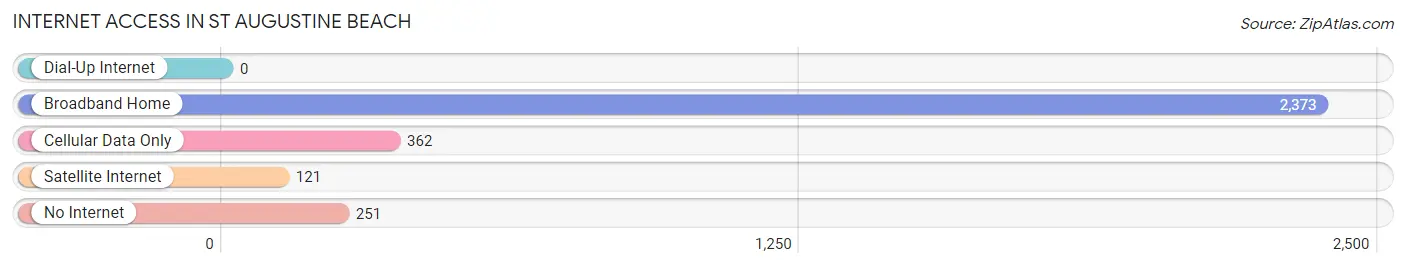
| Internet Type | # Households | % Households |
| Dial-Up Internet | 0 | 0.0% |
| Broadband Home | 2,373 | 77.9% |
| Cellular Data Only | 362 | 11.9% |
| Satellite Internet | 121 | 4.0% |
| No Internet | 251 | 8.2% |
| Total | 3,047 | 100.0% |
St Augustine Beach Summary
St. Augustine Beach is a small city located in St. Johns County, Florida, United States. It is part of the Jacksonville metropolitan area and is situated on Anastasia Island, just south of St. Augustine. The city is known for its beautiful beaches, historic sites, and vibrant culture.
History
St. Augustine Beach was first settled in the late 1800s by a group of fishermen and farmers. The area was originally known as “Anastasia Island” and was part of the Spanish colony of Florida. In 1821, the United States acquired Florida from Spain and the area became part of the Territory of Florida. In 1824, the city of St. Augustine was established and the area became known as St. Augustine Beach.
In the early 1900s, the area began to develop as a tourist destination. The first hotel was built in 1912 and the first beach pavilion was built in 1915. The area continued to grow and by the 1950s, St. Augustine Beach had become a popular destination for tourists.
In the late 1960s, the city was incorporated and the population began to grow rapidly. In the 1970s, the city began to develop its infrastructure and the population continued to grow. By the 1980s, St. Augustine Beach had become a popular destination for tourists and retirees.
Geography
St. Augustine Beach is located in St. Johns County, Florida, United States. It is situated on Anastasia Island, just south of St. Augustine. The city is bordered by the Atlantic Ocean to the east, the Intracoastal Waterway to the west, and the Matanzas River to the south.
The city has a total area of 4.2 square miles, of which 3.9 square miles is land and 0.3 square miles is water. The city has a humid subtropical climate, with hot, humid summers and mild winters.
Economy
St. Augustine Beach has a thriving economy that is largely driven by tourism. The city is home to numerous hotels, restaurants, and attractions that attract visitors from all over the world. The city also has a vibrant retail sector, with numerous shops and boutiques.
The city is also home to a number of businesses that provide services to the local community. These include medical and dental offices, banks, and other professional services.
Demographics
As of the 2010 census, St. Augustine Beach had a population of 6,094. The racial makeup of the city was 94.3% White, 2.2% African American, 0.3% Native American, 0.9% Asian, 0.1% Pacific Islander, 0.9% from other races, and 1.3% from two or more races. Hispanic or Latino of any race were 4.2% of the population.
The median income for a household in the city was $50,945, and the median income for a family was $60,945. The per capita income for the city was $30,945. About 5.2% of families and 7.2% of the population were below the poverty line, including 8.2% of those under age 18 and 4.2% of those age 65 or over.
St. Augustine Beach is a vibrant and diverse city with a rich history and culture. The city is home to numerous attractions and businesses that attract visitors from all over the world. The city has a thriving economy and a growing population, making it an ideal place to live and work.
Common Questions
What is Per Capita Income in St Augustine Beach?
Per Capita income in St Augustine Beach is $62,440.
What is the Median Family Income in St Augustine Beach?
Median Family Income in St Augustine Beach is $125,208.
What is the Median Household income in St Augustine Beach?
Median Household Income in St Augustine Beach is $87,019.
What is Income or Wage Gap in St Augustine Beach?
Income or Wage Gap in St Augustine Beach is 36.9%.
Women in St Augustine Beach earn 63.1 cents for every dollar earned by a man.
What is Family Income Deficit in St Augustine Beach?
Family Income Deficit in St Augustine Beach is $12,578.
Families that are below poverty line in St Augustine Beach earn $12,578 less on average than the poverty threshold level.
What is Inequality or Gini Index in St Augustine Beach?
Inequality or Gini Index in St Augustine Beach is 0.50.
What is the Total Population of St Augustine Beach?
Total Population of St Augustine Beach is 6,774.
What is the Total Male Population of St Augustine Beach?
Total Male Population of St Augustine Beach is 3,342.
What is the Total Female Population of St Augustine Beach?
Total Female Population of St Augustine Beach is 3,432.
What is the Ratio of Males per 100 Females in St Augustine Beach?
There are 97.38 Males per 100 Females in St Augustine Beach.
What is the Ratio of Females per 100 Males in St Augustine Beach?
There are 102.69 Females per 100 Males in St Augustine Beach.
What is the Median Population Age in St Augustine Beach?
Median Population Age in St Augustine Beach is 54.1 Years.
What is the Average Family Size in St Augustine Beach
Average Family Size in St Augustine Beach is 2.8 People.
What is the Average Household Size in St Augustine Beach
Average Household Size in St Augustine Beach is 2.2 People.
How Large is the Labor Force in St Augustine Beach?
There are 3,012 People in the Labor Forcein in St Augustine Beach.
What is the Percentage of People in the Labor Force in St Augustine Beach?
51.6% of People are in the Labor Force in St Augustine Beach.
What is the Unemployment Rate in St Augustine Beach?
Unemployment Rate in St Augustine Beach is 8.1%.