Cities with the Highest Percentage of Maltese Population in the United States
RELATED REPORTS & OPTIONS
Maltese
United States
Compare Cities
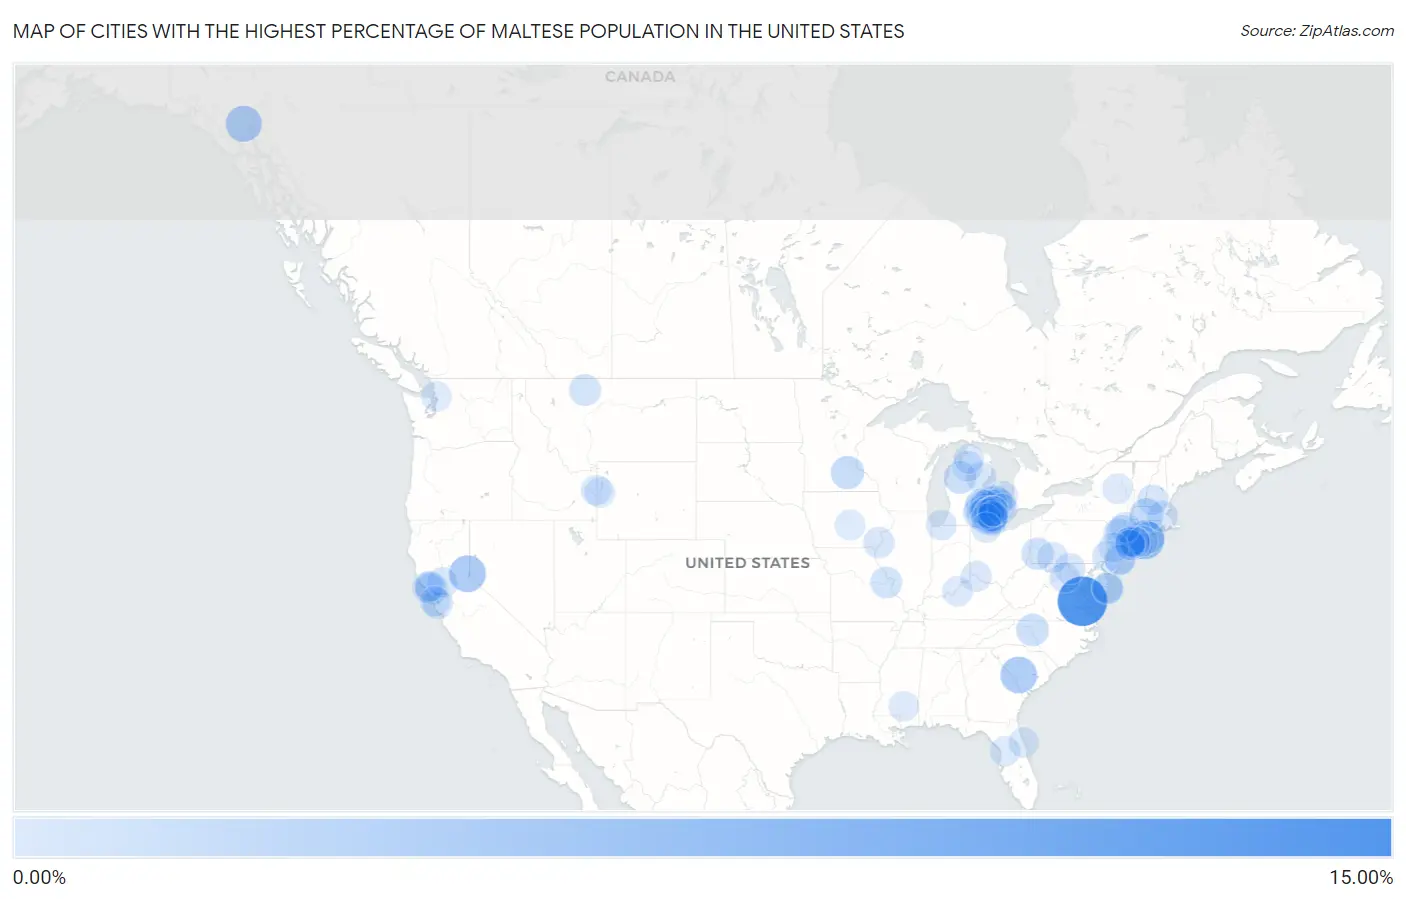
Map of Cities with the Highest Percentage of Maltese Population in the United States
0.00%
15.00%
Cities with the Highest Percentage of Maltese Population in the United States
| City | Maltese | vs State | vs National | |
| 1. | King And Queen Court House | 14.29% | 0.0042%(+14.3)#1 | 0.012%(+14.3)#1 |
| 2. | Mattituck | 6.19% | 0.031%(+6.16)#1 | 0.012%(+6.18)#2 |
| 3. | Van Lear | 5.73% | 0.0024%(+5.73)#1 | 0.012%(+5.72)#3 |
| 4. | Dollar Point | 5.03% | 0.017%(+5.01)#1 | 0.012%(+5.02)#4 |
| 5. | Williston | 4.83% | 0.0050%(+4.83)#1 | 0.012%(+4.82)#5 |
| 6. | Klukwan | 4.48% | 0.00041%(+4.48)#1 | 0.012%(+4.47)#6 |
| 7. | Milford | 3.92% | 0.13%(+3.79)#1 | 0.012%(+3.91)#7 |
| 8. | Almont | 2.80% | 0.13%(+2.67)#2 | 0.012%(+2.78)#8 |
| 9. | Belchertown | 2.72% | 0.0088%(+2.71)#1 | 0.012%(+2.71)#9 |
| 10. | Rockwood | 2.54% | 0.13%(+2.41)#3 | 0.012%(+2.52)#10 |
| 11. | Lonsdale | 2.48% | 0.0055%(+2.47)#1 | 0.012%(+2.46)#11 |
| 12. | Richmond | 2.38% | 0.13%(+2.25)#4 | 0.012%(+2.36)#12 |
| 13. | Taylor Ferry | 2.34% | 0.0018%(+2.34)#1 | 0.012%(+2.33)#13 |
| 14. | Rocky Hill Borough | 2.27% | 0.016%(+2.25)#1 | 0.012%(+2.25)#14 |
| 15. | Wedgewood | 2.00% | 0.13%(+1.87)#5 | 0.012%(+1.99)#15 |
| 16. | Bermuda Run | 1.96% | 0.0068%(+1.95)#1 | 0.012%(+1.94)#16 |
| 17. | Roseland Borough | 1.91% | 0.016%(+1.90)#2 | 0.012%(+1.90)#17 |
| 18. | Eatons Neck | 1.83% | 0.031%(+1.80)#2 | 0.012%(+1.82)#18 |
| 19. | Spring Valley Cdp Lake County | 1.80% | 0.017%(+1.78)#2 | 0.012%(+1.79)#19 |
| 20. | Mcmurray | 1.56% | 0.0066%(+1.56)#1 | 0.012%(+1.55)#20 |
| 21. | Orient | 1.56% | 0.031%(+1.53)#3 | 0.012%(+1.54)#21 |
| 22. | Beaver Dam Lake | 1.55% | 0.031%(+1.52)#4 | 0.012%(+1.53)#22 |
| 23. | Shelby | 1.47% | 0.0068%(+1.46)#1 | 0.012%(+1.46)#23 |
| 24. | Metamora | 1.45% | 0.13%(+1.33)#6 | 0.012%(+1.44)#24 |
| 25. | Cotati | 1.42% | 0.017%(+1.40)#3 | 0.012%(+1.41)#25 |
| 26. | Blue Point | 1.39% | 0.031%(+1.36)#5 | 0.012%(+1.37)#26 |
| 27. | Weldon Spring Heights | 1.38% | 0.0035%(+1.38)#1 | 0.012%(+1.37)#27 |
| 28. | Riverview | 1.33% | 0.13%(+1.20)#7 | 0.012%(+1.32)#28 |
| 29. | Garden City | 1.31% | 0.13%(+1.18)#8 | 0.012%(+1.30)#29 |
| 30. | Fowlerville | 1.29% | 0.13%(+1.16)#9 | 0.012%(+1.28)#30 |
| 31. | Williston Park | 1.17% | 0.031%(+1.14)#6 | 0.012%(+1.15)#31 |
| 32. | Woodhaven | 1.17% | 0.13%(+1.04)#10 | 0.012%(+1.15)#32 |
| 33. | Ocean Pines | 1.15% | 0.0070%(+1.15)#1 | 0.012%(+1.14)#33 |
| 34. | West Ocean City | 1.11% | 0.0070%(+1.10)#2 | 0.012%(+1.09)#34 |
| 35. | Dover | 1.00% | 0.0088%(+0.986)#2 | 0.012%(+0.983)#35 |
| 36. | Beaverdale | 0.98% | 0.0022%(+0.978)#1 | 0.012%(+0.968)#36 |
| 37. | Stockbridge | 0.95% | 0.13%(+0.825)#11 | 0.012%(+0.941)#37 |
| 38. | Hamburg Borough | 0.95% | 0.016%(+0.931)#3 | 0.012%(+0.934)#38 |
| 39. | Silver Ridge | 0.94% | 0.016%(+0.925)#4 | 0.012%(+0.928)#39 |
| 40. | Kirtland Afb | 0.94% | 0.0018%(+0.936)#1 | 0.012%(+0.926)#40 |
| 41. | Gibraltar | 0.93% | 0.13%(+0.802)#12 | 0.012%(+0.917)#41 |
| 42. | Antrim | 0.91% | 0.0093%(+0.900)#1 | 0.012%(+0.897)#42 |
| 43. | Skidway Lake | 0.90% | 0.13%(+0.775)#13 | 0.012%(+0.890)#43 |
| 44. | Florida | 0.89% | 0.031%(+0.855)#7 | 0.012%(+0.873)#44 |
| 45. | Shepherdstown | 0.87% | 0.00078%(+0.868)#1 | 0.012%(+0.856)#45 |
| 46. | Whitmore Lake | 0.86% | 0.13%(+0.732)#14 | 0.012%(+0.847)#46 |
| 47. | Friedens | 0.83% | 0.0066%(+0.827)#2 | 0.012%(+0.821)#47 |
| 48. | Lake Orion | 0.82% | 0.13%(+0.696)#15 | 0.012%(+0.811)#48 |
| 49. | Manistee Lake | 0.82% | 0.13%(+0.692)#16 | 0.012%(+0.807)#49 |
| 50. | Bancroft | 0.80% | 0.13%(+0.672)#17 | 0.012%(+0.788)#50 |
| 51. | Sewell | 0.80% | 0.016%(+0.782)#5 | 0.012%(+0.786)#51 |
| 52. | Chester Heights Borough | 0.79% | 0.0066%(+0.787)#3 | 0.012%(+0.781)#52 |
| 53. | Oreland | 0.78% | 0.0066%(+0.777)#4 | 0.012%(+0.771)#53 |
| 54. | Lexington | 0.75% | 0.13%(+0.625)#18 | 0.012%(+0.740)#54 |
| 55. | Village Of The Branch | 0.74% | 0.031%(+0.713)#8 | 0.012%(+0.732)#55 |
| 56. | Melbourne | 0.73% | 0.0024%(+0.729)#2 | 0.012%(+0.719)#56 |
| 57. | San Carlos | 0.72% | 0.017%(+0.705)#4 | 0.012%(+0.709)#57 |
| 58. | Livonia | 0.71% | 0.13%(+0.585)#19 | 0.012%(+0.701)#58 |
| 59. | Monument Hills | 0.70% | 0.017%(+0.686)#5 | 0.012%(+0.690)#59 |
| 60. | Michiana | 0.70% | 0.13%(+0.574)#20 | 0.012%(+0.689)#60 |
| 61. | Shenandoah Shores | 0.66% | 0.0042%(+0.660)#2 | 0.012%(+0.652)#61 |
| 62. | Hauppauge | 0.66% | 0.031%(+0.631)#9 | 0.012%(+0.649)#62 |
| 63. | Occidental | 0.66% | 0.017%(+0.643)#6 | 0.012%(+0.647)#63 |
| 64. | Cleona Borough | 0.66% | 0.0066%(+0.650)#5 | 0.012%(+0.644)#64 |
| 65. | Linden | 0.65% | 0.13%(+0.527)#21 | 0.012%(+0.642)#65 |
| 66. | Larkfield Wikiup | 0.65% | 0.017%(+0.633)#7 | 0.012%(+0.638)#66 |
| 67. | South Lyon | 0.64% | 0.13%(+0.517)#22 | 0.012%(+0.632)#67 |
| 68. | Lloyd Harbor | 0.64% | 0.031%(+0.613)#10 | 0.012%(+0.631)#68 |
| 69. | Phoenixville Borough | 0.64% | 0.0066%(+0.634)#6 | 0.012%(+0.628)#69 |
| 70. | East Northport | 0.64% | 0.031%(+0.610)#11 | 0.012%(+0.628)#70 |
| 71. | Upper Brookville | 0.64% | 0.031%(+0.608)#12 | 0.012%(+0.626)#71 |
| 72. | Holiday Heights | 0.63% | 0.016%(+0.618)#6 | 0.012%(+0.622)#72 |
| 73. | Pompton Plains | 0.63% | 0.016%(+0.615)#7 | 0.012%(+0.618)#73 |
| 74. | Spackenkill | 0.62% | 0.031%(+0.592)#13 | 0.012%(+0.610)#74 |
| 75. | Strathmoor Manor | 0.62% | 0.0024%(+0.615)#3 | 0.012%(+0.605)#75 |
| 76. | Riverside | 0.61% | 0.031%(+0.581)#14 | 0.012%(+0.599)#76 |
| 77. | Trenton | 0.61% | 0.13%(+0.480)#23 | 0.012%(+0.596)#77 |
| 78. | Milton Cdp Ulster County | 0.60% | 0.031%(+0.569)#15 | 0.012%(+0.587)#78 |
| 79. | Boyne Falls | 0.59% | 0.13%(+0.459)#24 | 0.012%(+0.574)#79 |
| 80. | South Park | 0.58% | 0.0019%(+0.577)#1 | 0.012%(+0.567)#80 |
| 81. | Bradley Gardens | 0.58% | 0.016%(+0.563)#8 | 0.012%(+0.566)#81 |
| 82. | Mingo | 0.58% | 0.0022%(+0.576)#2 | 0.012%(+0.566)#82 |
| 83. | Southgate | 0.58% | 0.13%(+0.450)#25 | 0.012%(+0.565)#83 |
| 84. | Seminary | 0.57% | 0.0019%(+0.570)#1 | 0.012%(+0.559)#84 |
| 85. | Chelsea | 0.57% | 0.13%(+0.442)#26 | 0.012%(+0.557)#85 |
| 86. | San Bruno | 0.56% | 0.017%(+0.545)#8 | 0.012%(+0.550)#86 |
| 87. | Farmington | 0.56% | 0.13%(+0.430)#27 | 0.012%(+0.545)#87 |
| 88. | Victor | 0.56% | 0.0045%(+0.552)#1 | 0.012%(+0.544)#88 |
| 89. | Taylor | 0.54% | 0.13%(+0.416)#28 | 0.012%(+0.531)#89 |
| 90. | Kayak Point | 0.54% | 0.0069%(+0.535)#1 | 0.012%(+0.529)#90 |
| 91. | Plymouth | 0.54% | 0.13%(+0.410)#29 | 0.012%(+0.525)#91 |
| 92. | Inverness Highlands North | 0.53% | 0.011%(+0.521)#1 | 0.012%(+0.520)#92 |
| 93. | Algonac | 0.53% | 0.13%(+0.400)#30 | 0.012%(+0.516)#93 |
| 94. | North Bellmore | 0.53% | 0.031%(+0.496)#16 | 0.012%(+0.514)#94 |
| 95. | Ormond By The Sea | 0.52% | 0.011%(+0.514)#2 | 0.012%(+0.512)#95 |
| 96. | Milan | 0.52% | 0.13%(+0.392)#31 | 0.012%(+0.508)#96 |
| 97. | Speculator | 0.52% | 0.031%(+0.485)#17 | 0.012%(+0.503)#97 |
| 98. | Lathrup Village | 0.52% | 0.13%(+0.388)#32 | 0.012%(+0.503)#98 |
| 99. | Berkley | 0.51% | 0.13%(+0.387)#33 | 0.012%(+0.502)#99 |
| 100. | Holland | 0.51% | 0.0035%(+0.509)#1 | 0.012%(+0.500)#100 |
Common Questions
What are the Top 10 Cities with the Highest Percentage of Maltese Population in the United States?
Top 10 Cities with the Highest Percentage of Maltese Population in the United States are:
What city has the Highest Percentage of Maltese Population in the United States?
King And Queen Court House has the Highest Percentage of Maltese Population in the United States with 14.29%.
What is the Percentage of Maltese Population in the United States?
Percentage of Maltese Population in the United States is 0.012%.