Cities with the Highest Percentage of Senegalese Population in the United States
RELATED REPORTS & OPTIONS
Senegalese
United States
Compare Cities
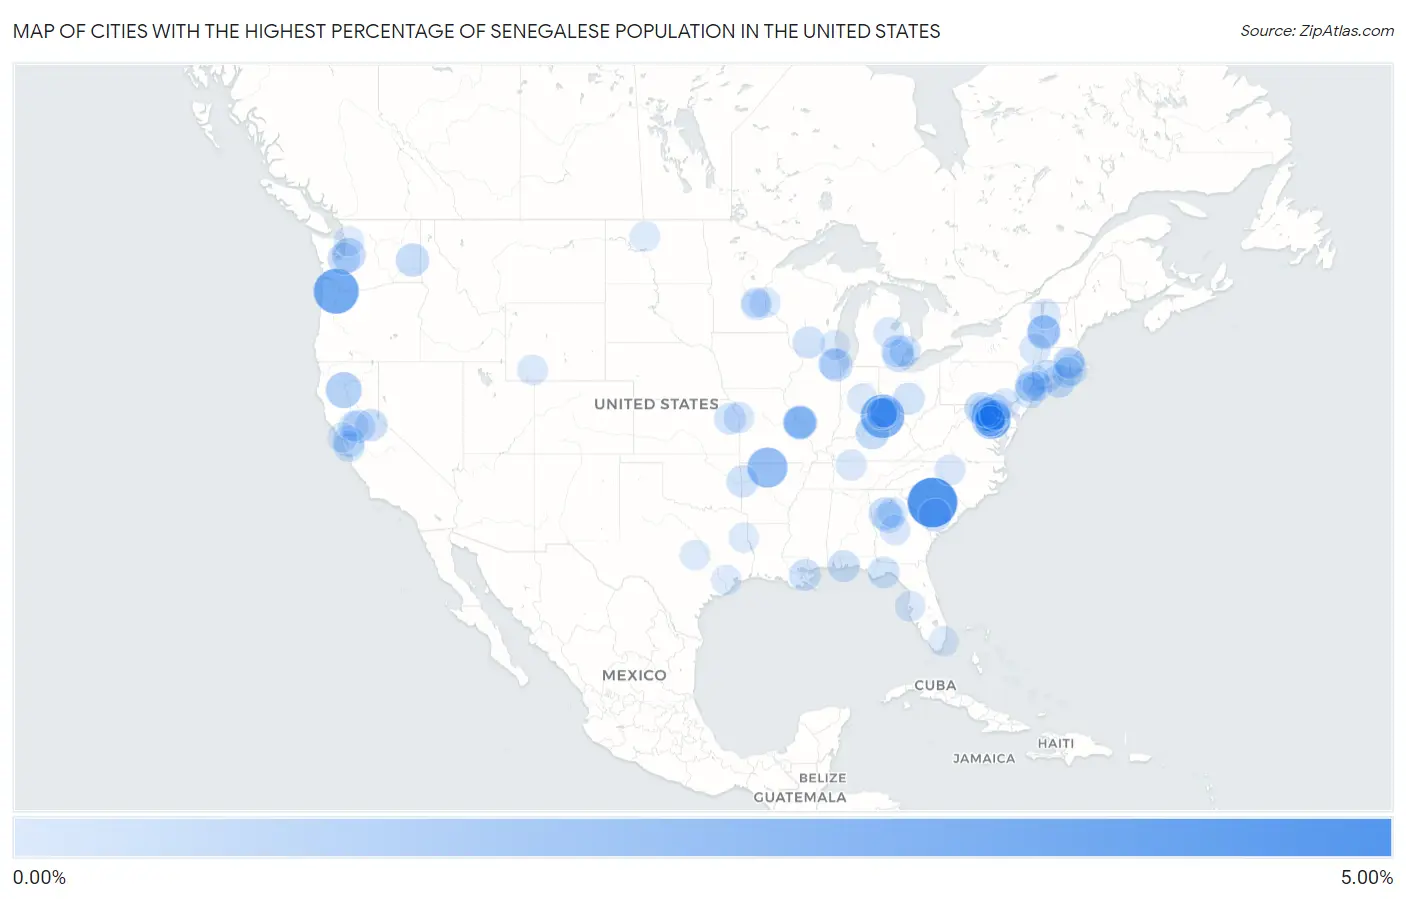
Map of Cities with the Highest Percentage of Senegalese Population in the United States
0.00%
5.00%
Cities with the Highest Percentage of Senegalese Population in the United States
| City | Senegalese | vs State | vs National | |
| 1. | Blythewood | 4.83% | 0.0062%(+4.82)#1 | 0.0080%(+4.82)#1 |
| 2. | North Plains | 3.66% | 0.0099%(+3.65)#1 | 0.0080%(+3.65)#2 |
| 3. | Delshire | 3.30% | 0.014%(+3.29)#1 | 0.0080%(+3.29)#3 |
| 4. | Flippin | 2.49% | 0.0055%(+2.48)#1 | 0.0080%(+2.48)#4 |
| 5. | Coral Hills | 2.11% | 0.030%(+2.08)#1 | 0.0080%(+2.11)#5 |
| 6. | Kettering | 1.52% | 0.030%(+1.49)#2 | 0.0080%(+1.51)#6 |
| 7. | Centerville | 1.45% | 0.0032%(+1.45)#1 | 0.0080%(+1.44)#7 |
| 8. | Leisure World | 1.29% | 0.030%(+1.26)#3 | 0.0080%(+1.28)#8 |
| 9. | Reading | 1.25% | 0.014%(+1.24)#2 | 0.0080%(+1.25)#9 |
| 10. | Kinloch | 1.03% | 0.0046%(+1.03)#1 | 0.0080%(+1.02)#10 |
| 11. | Shelbyville | 0.94% | 0.0095%(+0.930)#1 | 0.0080%(+0.932)#11 |
| 12. | Covington | 0.92% | 0.0068%(+0.911)#1 | 0.0080%(+0.910)#12 |
| 13. | Myersville | 0.84% | 0.030%(+0.813)#4 | 0.0080%(+0.834)#13 |
| 14. | Edmundson | 0.82% | 0.0046%(+0.812)#2 | 0.0080%(+0.809)#14 |
| 15. | St John | 0.82% | 0.0068%(+0.810)#2 | 0.0080%(+0.809)#15 |
| 16. | Four Square Mile | 0.81% | 0.012%(+0.796)#1 | 0.0080%(+0.800)#16 |
| 17. | Poultney | 0.80% | 0.011%(+0.789)#1 | 0.0080%(+0.792)#17 |
| 18. | Brookdale | 0.76% | 0.0062%(+0.756)#2 | 0.0080%(+0.754)#18 |
| 19. | Berwyn | 0.73% | 0.0060%(+0.724)#1 | 0.0080%(+0.722)#19 |
| 20. | White Oak | 0.72% | 0.030%(+0.693)#5 | 0.0080%(+0.715)#20 |
| 21. | East Hampton | 0.71% | 0.026%(+0.682)#1 | 0.0080%(+0.701)#21 |
| 22. | La Riviera | 0.70% | 0.0032%(+0.701)#2 | 0.0080%(+0.696)#22 |
| 23. | Summerfield | 0.70% | 0.030%(+0.667)#6 | 0.0080%(+0.688)#23 |
| 24. | Montgomery Village | 0.68% | 0.030%(+0.655)#7 | 0.0080%(+0.677)#24 |
| 25. | Riverdale | 0.67% | 0.0083%(+0.661)#1 | 0.0080%(+0.662)#25 |
| 26. | Castleton | 0.66% | 0.011%(+0.652)#2 | 0.0080%(+0.655)#26 |
| 27. | Woodlawn Cdp Fairfax County | 0.64% | 0.0059%(+0.639)#1 | 0.0080%(+0.636)#27 |
| 28. | Midland | 0.63% | 0.0068%(+0.621)#3 | 0.0080%(+0.620)#28 |
| 29. | West Haven | 0.63% | 0.013%(+0.614)#1 | 0.0080%(+0.619)#29 |
| 30. | Timonium | 0.61% | 0.030%(+0.582)#8 | 0.0080%(+0.603)#30 |
| 31. | Grizzly Flats | 0.58% | 0.0032%(+0.579)#3 | 0.0080%(+0.574)#31 |
| 32. | Van Buren | 0.56% | 0.0055%(+0.559)#2 | 0.0080%(+0.556)#32 |
| 33. | Wayne | 0.56% | 0.0057%(+0.558)#1 | 0.0080%(+0.555)#33 |
| 34. | Burtonsville | 0.56% | 0.030%(+0.532)#9 | 0.0080%(+0.554)#34 |
| 35. | Edinboro Borough | 0.54% | 0.0054%(+0.539)#1 | 0.0080%(+0.537)#35 |
| 36. | Mount Horeb | 0.54% | 0.0050%(+0.539)#1 | 0.0080%(+0.536)#36 |
| 37. | Walled Lake | 0.54% | 0.0057%(+0.531)#2 | 0.0080%(+0.529)#37 |
| 38. | Timberlane | 0.53% | 0.0034%(+0.528)#1 | 0.0080%(+0.523)#38 |
| 39. | Pataskala | 0.53% | 0.014%(+0.513)#3 | 0.0080%(+0.519)#39 |
| 40. | West Pensacola | 0.52% | 0.0029%(+0.515)#1 | 0.0080%(+0.510)#40 |
| 41. | Kennesaw State University | 0.49% | 0.0083%(+0.484)#2 | 0.0080%(+0.484)#41 |
| 42. | Darby Borough | 0.48% | 0.0054%(+0.472)#2 | 0.0080%(+0.469)#42 |
| 43. | Sopchoppy | 0.47% | 0.0029%(+0.467)#2 | 0.0080%(+0.461)#43 |
| 44. | St Ann | 0.46% | 0.0046%(+0.460)#3 | 0.0080%(+0.456)#44 |
| 45. | Tappan | 0.46% | 0.026%(+0.430)#2 | 0.0080%(+0.448)#45 |
| 46. | Lawrence | 0.45% | 0.016%(+0.432)#1 | 0.0080%(+0.440)#46 |
| 47. | Ashland | 0.43% | 0.0032%(+0.429)#4 | 0.0080%(+0.424)#47 |
| 48. | Fraser | 0.41% | 0.0057%(+0.403)#3 | 0.0080%(+0.401)#48 |
| 49. | Mountain View | 0.41% | 0.0032%(+0.402)#5 | 0.0080%(+0.397)#49 |
| 50. | Strathmore | 0.39% | 0.012%(+0.379)#1 | 0.0080%(+0.383)#50 |
| 51. | Brentwood | 0.37% | 0.030%(+0.340)#10 | 0.0080%(+0.362)#51 |
| 52. | Melville | 0.36% | 0.049%(+0.316)#1 | 0.0080%(+0.357)#52 |
| 53. | Northbrook | 0.36% | 0.014%(+0.343)#4 | 0.0080%(+0.349)#53 |
| 54. | William Paterson University Of New Jersey | 0.35% | 0.012%(+0.340)#2 | 0.0080%(+0.344)#54 |
| 55. | Siena College | 0.35% | 0.026%(+0.323)#3 | 0.0080%(+0.341)#55 |
| 56. | Locust Grove | 0.34% | 0.0083%(+0.333)#3 | 0.0080%(+0.334)#56 |
| 57. | Pawtucket | 0.34% | 0.049%(+0.292)#2 | 0.0080%(+0.332)#57 |
| 58. | Temple Hills | 0.34% | 0.030%(+0.307)#11 | 0.0080%(+0.329)#58 |
| 59. | Baltimore Highlands | 0.33% | 0.030%(+0.303)#12 | 0.0080%(+0.325)#59 |
| 60. | White Oak | 0.33% | 0.014%(+0.316)#5 | 0.0080%(+0.322)#60 |
| 61. | Villa Park | 0.32% | 0.0060%(+0.315)#2 | 0.0080%(+0.313)#61 |
| 62. | Woonsocket | 0.31% | 0.049%(+0.265)#3 | 0.0080%(+0.306)#62 |
| 63. | Millersville | 0.31% | 0.0087%(+0.301)#1 | 0.0080%(+0.301)#63 |
| 64. | Albany | 0.30% | 0.026%(+0.274)#4 | 0.0080%(+0.292)#64 |
| 65. | Merriam | 0.26% | 0.016%(+0.246)#2 | 0.0080%(+0.254)#65 |
| 66. | Adelphi | 0.26% | 0.030%(+0.230)#13 | 0.0080%(+0.252)#66 |
| 67. | Kingston | 0.26% | 0.049%(+0.210)#4 | 0.0080%(+0.251)#67 |
| 68. | Greensboro | 0.26% | 0.020%(+0.237)#1 | 0.0080%(+0.249)#68 |
| 69. | Town N Country | 0.24% | 0.0029%(+0.239)#3 | 0.0080%(+0.233)#69 |
| 70. | Rock Springs | 0.24% | 0.0097%(+0.230)#1 | 0.0080%(+0.232)#70 |
| 71. | Laurel | 0.22% | 0.030%(+0.187)#14 | 0.0080%(+0.208)#71 |
| 72. | Noblesville | 0.22% | 0.011%(+0.205)#1 | 0.0080%(+0.208)#72 |
| 73. | Bayonne | 0.21% | 0.012%(+0.199)#3 | 0.0080%(+0.203)#73 |
| 74. | Oak Park Heights | 0.21% | 0.0030%(+0.206)#1 | 0.0080%(+0.201)#74 |
| 75. | Hopkins | 0.21% | 0.0030%(+0.205)#2 | 0.0080%(+0.200)#75 |
| 76. | Lincoln University | 0.20% | 0.0054%(+0.196)#3 | 0.0080%(+0.194)#76 |
| 77. | Ballenger Creek | 0.20% | 0.030%(+0.172)#15 | 0.0080%(+0.193)#77 |
| 78. | Glassmanor | 0.20% | 0.030%(+0.166)#16 | 0.0080%(+0.188)#78 |
| 79. | Warner Robins | 0.19% | 0.0083%(+0.186)#4 | 0.0080%(+0.186)#79 |
| 80. | University Of California Davis | 0.18% | 0.0032%(+0.179)#6 | 0.0080%(+0.174)#80 |
| 81. | Forest Park | 0.18% | 0.014%(+0.166)#6 | 0.0080%(+0.172)#81 |
| 82. | Essex Junction | 0.18% | 0.011%(+0.167)#3 | 0.0080%(+0.170)#82 |
| 83. | Freeland | 0.18% | 0.0057%(+0.171)#4 | 0.0080%(+0.169)#83 |
| 84. | Montclair State University | 0.18% | 0.012%(+0.163)#4 | 0.0080%(+0.167)#84 |
| 85. | Amherst | 0.17% | 0.0049%(+0.166)#1 | 0.0080%(+0.163)#85 |
| 86. | Fort Hood | 0.17% | 0.0048%(+0.164)#1 | 0.0080%(+0.161)#86 |
| 87. | Stafford | 0.17% | 0.0048%(+0.163)#2 | 0.0080%(+0.160)#87 |
| 88. | Lake Stevens | 0.16% | 0.0068%(+0.158)#4 | 0.0080%(+0.157)#88 |
| 89. | Damascus | 0.16% | 0.030%(+0.130)#17 | 0.0080%(+0.152)#89 |
| 90. | Sharonville | 0.15% | 0.014%(+0.136)#7 | 0.0080%(+0.142)#90 |
| 91. | Newark | 0.15% | 0.012%(+0.136)#5 | 0.0080%(+0.140)#91 |
| 92. | New Hope | 0.15% | 0.0030%(+0.145)#3 | 0.0080%(+0.140)#92 |
| 93. | Oxford | 0.15% | 0.0083%(+0.139)#5 | 0.0080%(+0.140)#93 |
| 94. | Oak Creek | 0.15% | 0.0050%(+0.141)#2 | 0.0080%(+0.138)#94 |
| 95. | Brownsville | 0.15% | 0.0029%(+0.143)#4 | 0.0080%(+0.138)#95 |
| 96. | Minot | 0.14% | 0.018%(+0.122)#1 | 0.0080%(+0.131)#96 |
| 97. | Ferndale | 0.14% | 0.030%(+0.108)#18 | 0.0080%(+0.130)#97 |
| 98. | Carthage | 0.14% | 0.0048%(+0.133)#3 | 0.0080%(+0.129)#98 |
| 99. | West Hempstead | 0.14% | 0.026%(+0.111)#5 | 0.0080%(+0.129)#99 |
| 100. | Kentfield | 0.13% | 0.0032%(+0.132)#7 | 0.0080%(+0.127)#100 |
Common Questions
What are the Top 10 Cities with the Highest Percentage of Senegalese Population in the United States?
Top 10 Cities with the Highest Percentage of Senegalese Population in the United States are:
#1
4.83%
#2
3.66%
#3
3.30%
#4
2.49%
#5
2.11%
#6
1.52%
#7
1.45%
#8
1.29%
#9
1.25%
#10
1.03%
What city has the Highest Percentage of Senegalese Population in the United States?
Blythewood has the Highest Percentage of Senegalese Population in the United States with 4.83%.
What is the Percentage of Senegalese Population in the United States?
Percentage of Senegalese Population in the United States is 0.0080%.