Atoka, OK Map & Demographics
Atoka Map
Atoka Overview
$26,230
PER CAPITA INCOME
$51,106
AVG FAMILY INCOME
$40,362
AVG HOUSEHOLD INCOME
16.8%
WAGE / INCOME GAP [ % ]
83.2¢/ $1
WAGE / INCOME GAP [ $ ]
0.59
INEQUALITY / GINI INDEX
3,160
TOTAL POPULATION
1,696
MALE POPULATION
1,464
FEMALE POPULATION
115.85
MALES / 100 FEMALES
86.32
FEMALES / 100 MALES
37.5
MEDIAN AGE
3.7
AVG FAMILY SIZE
2.9
AVG HOUSEHOLD SIZE
1,016
LABOR FORCE [ PEOPLE ]
41.8%
PERCENT IN LABOR FORCE
7.2%
UNEMPLOYMENT RATE
Atoka Zip Codes
Atoka Area Codes
Income in Atoka
Income Overview in Atoka
Per Capita Income in Atoka is $26,230, while median incomes of families and households are $51,106 and $40,362 respectively.
| Characteristic | Number | Measure |
| Per Capita Income | 3,160 | $26,230 |
| Median Family Income | 671 | $51,106 |
| Mean Family Income | 671 | $93,102 |
| Median Household Income | 1,052 | $40,362 |
| Mean Household Income | 1,052 | $69,376 |
| Income Deficit | 671 | $0 |
| Wage / Income Gap (%) | 3,160 | 16.83% |
| Wage / Income Gap ($) | 3,160 | 83.17¢ per $1 |
| Gini / Inequality Index | 3,160 | 0.59 |
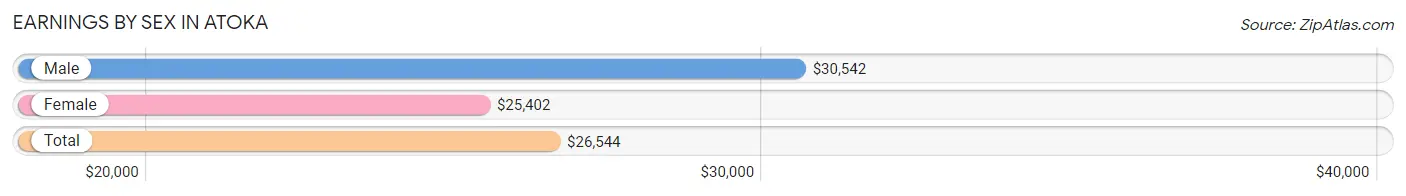
Earnings by Sex in Atoka
Average Earnings in Atoka are $26,544, $30,542 for men and $25,402 for women, a difference of 16.8%.
| Sex | Number | Average Earnings |
| Male | 558 (50.0%) | $30,542 |
| Female | 558 (50.0%) | $25,402 |
| Total | 1,116 (100.0%) | $26,544 |
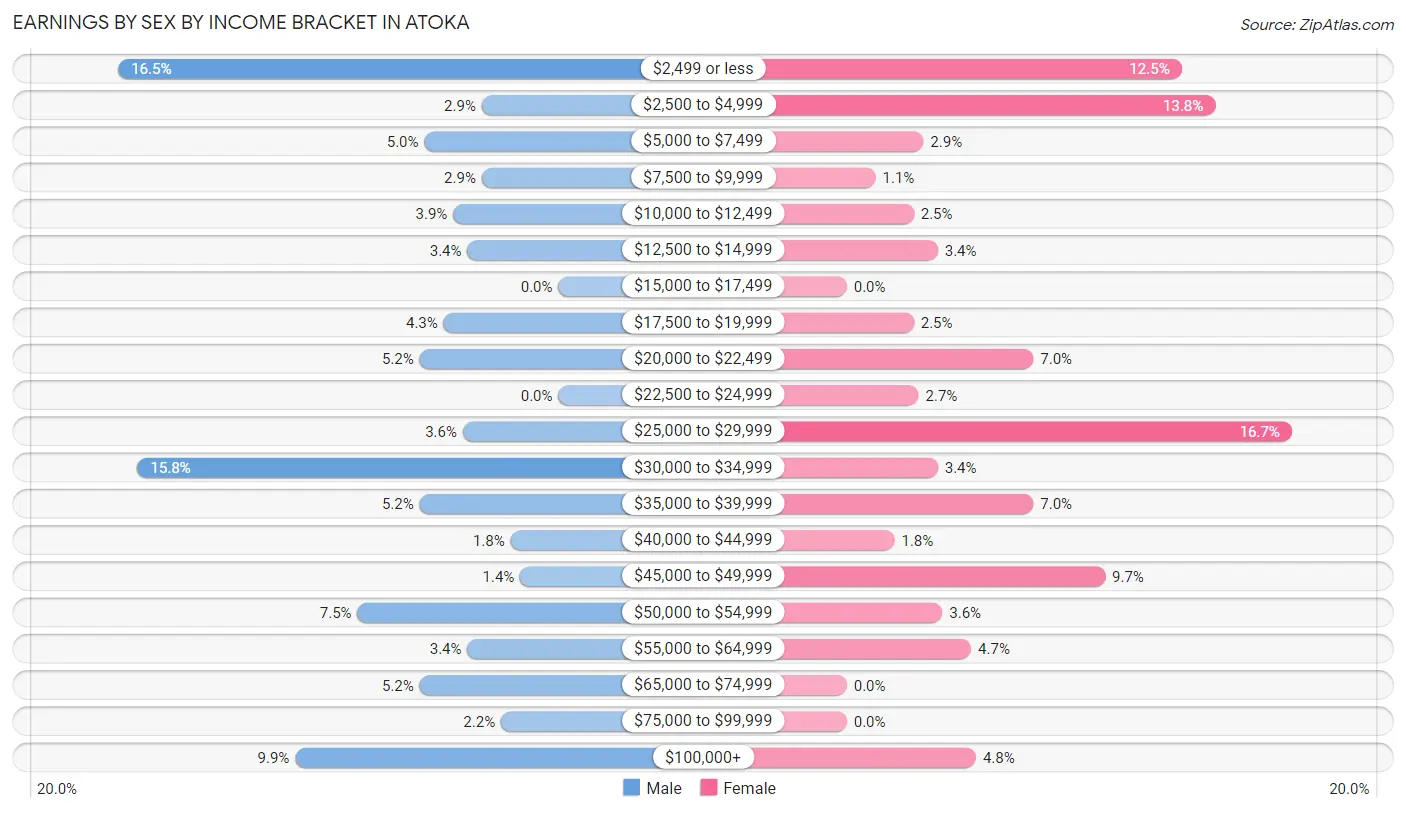
Earnings by Sex by Income Bracket in Atoka
The most common earnings brackets in Atoka are $2,499 or less for men (92 | 16.5%) and $25,000 to $29,999 for women (93 | 16.7%).
| Income | Male | Female |
| $2,499 or less | 92 (16.5%) | 70 (12.5%) |
| $2,500 to $4,999 | 16 (2.9%) | 77 (13.8%) |
| $5,000 to $7,499 | 28 (5.0%) | 16 (2.9%) |
| $7,500 to $9,999 | 16 (2.9%) | 6 (1.1%) |
| $10,000 to $12,499 | 22 (3.9%) | 14 (2.5%) |
| $12,500 to $14,999 | 19 (3.4%) | 19 (3.4%) |
| $15,000 to $17,499 | 0 (0.0%) | 0 (0.0%) |
| $17,500 to $19,999 | 24 (4.3%) | 14 (2.5%) |
| $20,000 to $22,499 | 29 (5.2%) | 39 (7.0%) |
| $22,500 to $24,999 | 0 (0.0%) | 15 (2.7%) |
| $25,000 to $29,999 | 20 (3.6%) | 93 (16.7%) |
| $30,000 to $34,999 | 88 (15.8%) | 19 (3.4%) |
| $35,000 to $39,999 | 29 (5.2%) | 39 (7.0%) |
| $40,000 to $44,999 | 10 (1.8%) | 10 (1.8%) |
| $45,000 to $49,999 | 8 (1.4%) | 54 (9.7%) |
| $50,000 to $54,999 | 42 (7.5%) | 20 (3.6%) |
| $55,000 to $64,999 | 19 (3.4%) | 26 (4.7%) |
| $65,000 to $74,999 | 29 (5.2%) | 0 (0.0%) |
| $75,000 to $99,999 | 12 (2.1%) | 0 (0.0%) |
| $100,000+ | 55 (9.9%) | 27 (4.8%) |
| Total | 558 (100.0%) | 558 (100.0%) |
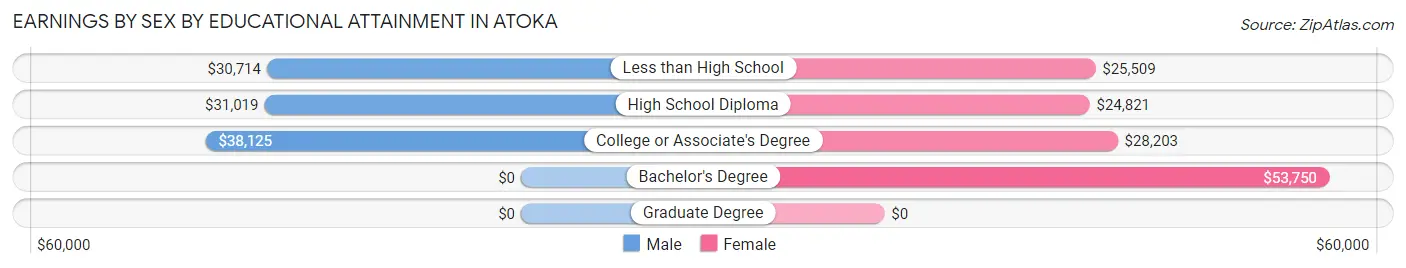
Earnings by Sex by Educational Attainment in Atoka
Average earnings in Atoka are $33,527 for men and $27,232 for women, a difference of 18.8%. Men with an educational attainment of college or associate's degree enjoy the highest average annual earnings of $38,125, while those with less than high school education earn the least with $30,714. Women with an educational attainment of bachelor's degree earn the most with the average annual earnings of $53,750, while those with high school diploma education have the smallest earnings of $24,821.
| Educational Attainment | Male Income | Female Income |
| Less than High School | $30,714 | $25,509 |
| High School Diploma | $31,019 | $24,821 |
| College or Associate's Degree | $38,125 | $28,203 |
| Bachelor's Degree | - | - |
| Graduate Degree | - | - |
| Total | $33,527 | $27,232 |
Family Income in Atoka
Family Income Brackets in Atoka
According to the Atoka family income data, there are 163 families falling into the $35,000 to $49,999 income range, which is the most common income bracket and makes up 24.3% of all families. Conversely, the $10,000 to $14,999 income bracket is the least frequent group with only 14 families (2.1%) belonging to this category.
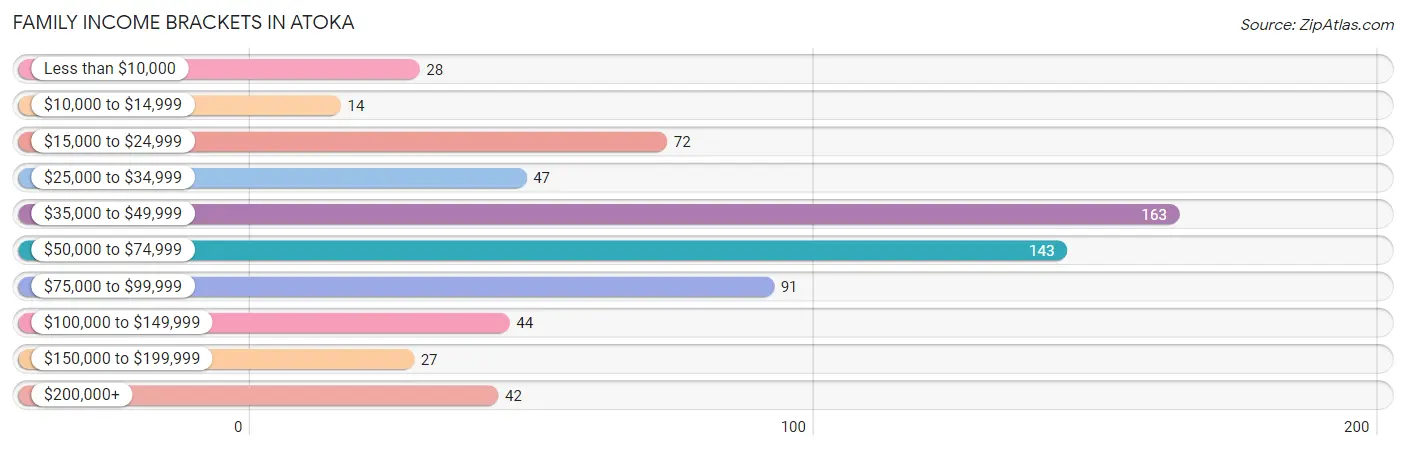
| Income Bracket | # Families | % Families |
| Less than $10,000 | 28 | 4.2% |
| $10,000 to $14,999 | 14 | 2.1% |
| $15,000 to $24,999 | 72 | 10.7% |
| $25,000 to $34,999 | 47 | 7.0% |
| $35,000 to $49,999 | 163 | 24.3% |
| $50,000 to $74,999 | 143 | 21.3% |
| $75,000 to $99,999 | 91 | 13.6% |
| $100,000 to $149,999 | 44 | 6.6% |
| $150,000 to $199,999 | 27 | 4.0% |
| $200,000+ | 42 | 6.3% |
Family Income by Famaliy Size in Atoka
4-person families (128 | 19.1%) account for the highest median family income in Atoka with $92,826 per family, while 4-person families (128 | 19.1%) have the highest median income of $23,206 per family member.
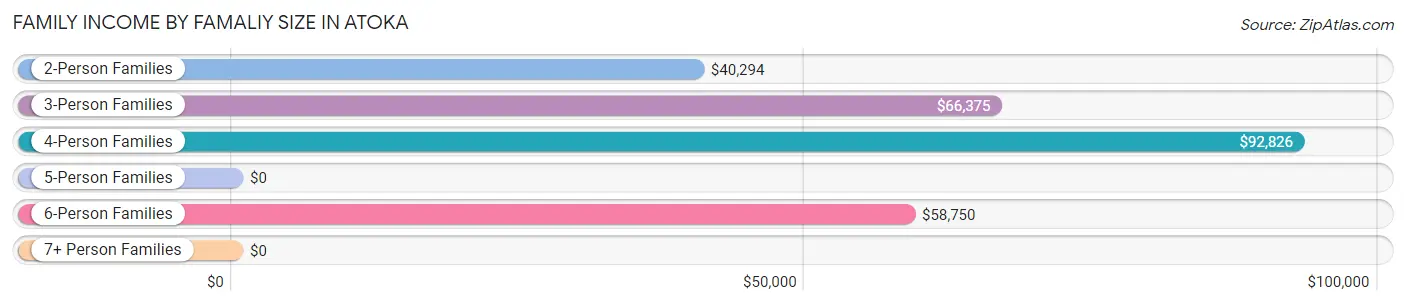
| Income Bracket | # Families | Median Income |
| 2-Person Families | 340 (50.7%) | $40,294 |
| 3-Person Families | 109 (16.2%) | $66,375 |
| 4-Person Families | 128 (19.1%) | $92,826 |
| 5-Person Families | 42 (6.3%) | $0 |
| 6-Person Families | 52 (7.7%) | $58,750 |
| 7+ Person Families | 0 (0.0%) | $0 |
| Total | 671 (100.0%) | $51,106 |
Family Income by Number of Earners in Atoka
The median family income in Atoka is $51,106, with families comprising 3+ earners (68) having the highest median family income of $117,222, while families with 1 earner (202) have the lowest median family income of $33,125, accounting for 10.1% and 30.1% of families, respectively.
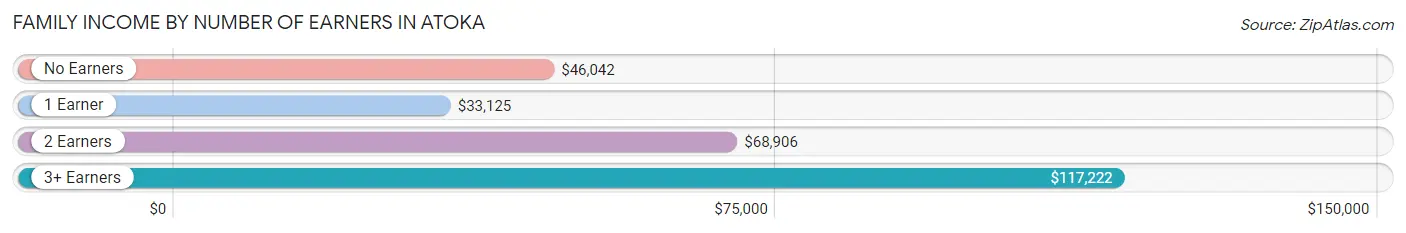
| Number of Earners | # Families | Median Income |
| No Earners | 197 (29.4%) | $46,042 |
| 1 Earner | 202 (30.1%) | $33,125 |
| 2 Earners | 204 (30.4%) | $68,906 |
| 3+ Earners | 68 (10.1%) | $117,222 |
| Total | 671 (100.0%) | $51,106 |
Household Income in Atoka
Household Income Brackets in Atoka
With 220 households falling in the category, the $35,000 to $49,999 income range is the most frequent in Atoka, accounting for 20.9% of all households. In contrast, only 27 households (2.6%) fall into the $150,000 to $199,999 income bracket, making it the least populous group.
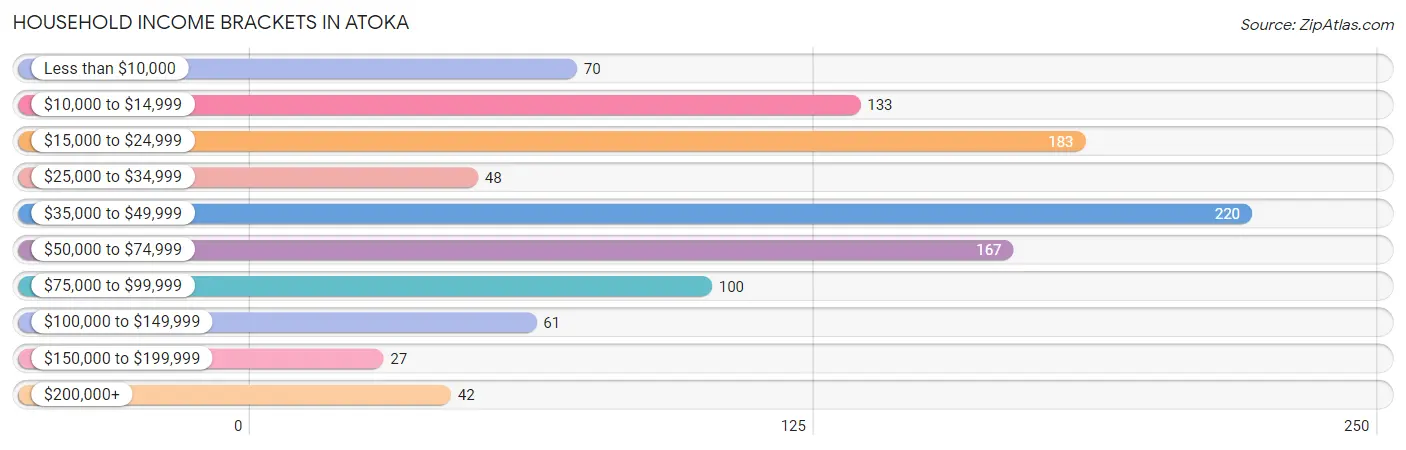
| Income Bracket | # Households | % Households |
| Less than $10,000 | 70 | 6.7% |
| $10,000 to $14,999 | 133 | 12.6% |
| $15,000 to $24,999 | 183 | 17.4% |
| $25,000 to $34,999 | 48 | 4.6% |
| $35,000 to $49,999 | 220 | 20.9% |
| $50,000 to $74,999 | 167 | 15.9% |
| $75,000 to $99,999 | 100 | 9.5% |
| $100,000 to $149,999 | 61 | 5.8% |
| $150,000 to $199,999 | 27 | 2.6% |
| $200,000+ | 42 | 4.0% |
Household Income by Householder Age in Atoka
The median household income in Atoka is $40,362, with the highest median household income of $46,500 found in the 25 to 44 years age bracket for the primary householder. A total of 362 households (34.4%) fall into this category. Meanwhile, the 15 to 24 years age bracket for the primary householder has the lowest median household income of $19,940, with 41 households (3.9%) in this group.
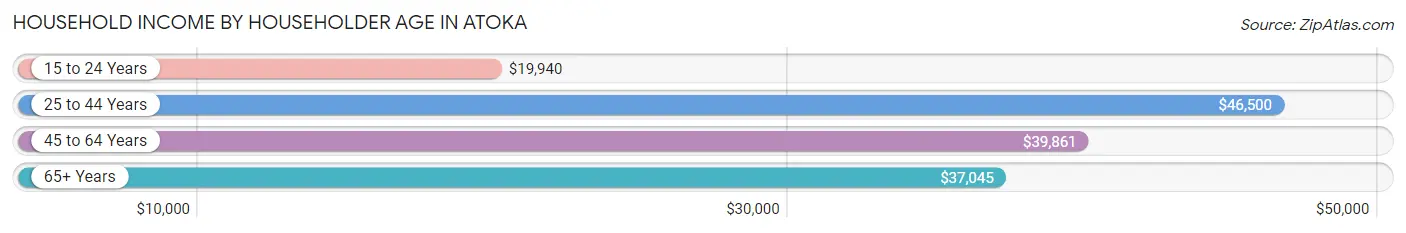
| Income Bracket | # Households | Median Income |
| 15 to 24 Years | 41 (3.9%) | $19,940 |
| 25 to 44 Years | 362 (34.4%) | $46,500 |
| 45 to 64 Years | 387 (36.8%) | $39,861 |
| 65+ Years | 262 (24.9%) | $37,045 |
| Total | 1,052 (100.0%) | $40,362 |
Poverty in Atoka
Income Below Poverty by Sex and Age in Atoka
With 25.5% poverty level for males and 24.6% for females among the residents of Atoka, 16 and 17 year old males and 45 to 54 year old females are the most vulnerable to poverty, with 22 males (95.7%) and 56 females (41.5%) in their respective age groups living below the poverty level.
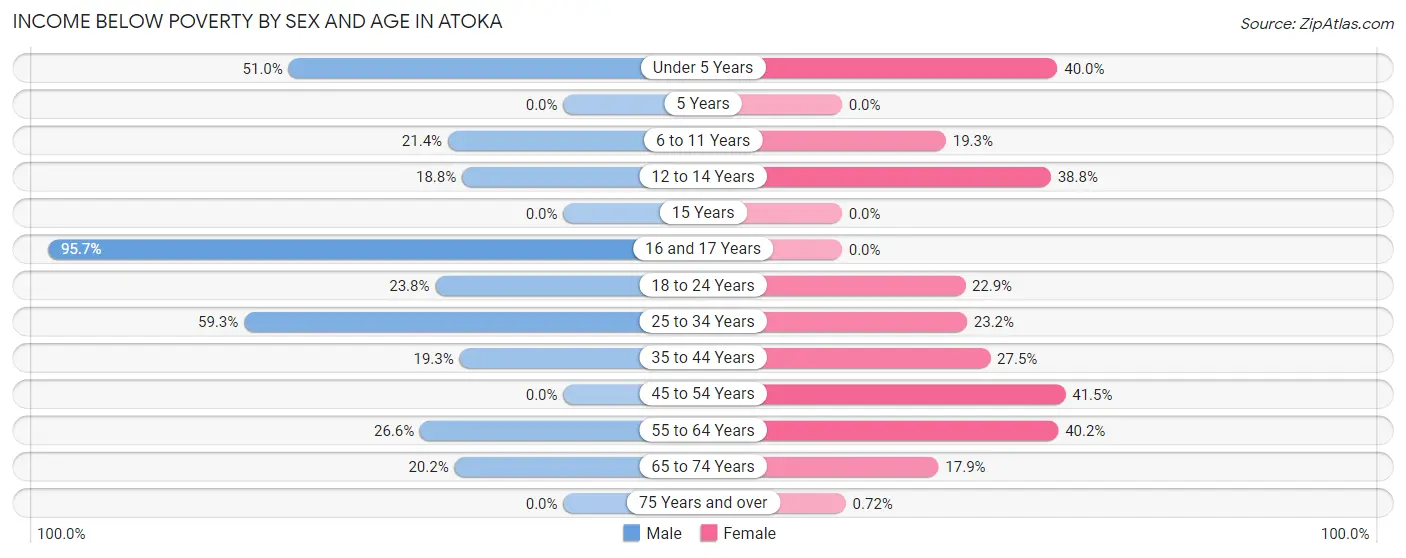
| Age Bracket | Male | Female |
| Under 5 Years | 51 (51.0%) | 12 (40.0%) |
| 5 Years | 0 (0.0%) | 0 (0.0%) |
| 6 to 11 Years | 42 (21.4%) | 11 (19.3%) |
| 12 to 14 Years | 22 (18.8%) | 19 (38.8%) |
| 15 Years | 0 (0.0%) | 0 (0.0%) |
| 16 and 17 Years | 22 (95.7%) | 0 (0.0%) |
| 18 to 24 Years | 29 (23.8%) | 32 (22.9%) |
| 25 to 34 Years | 128 (59.3%) | 39 (23.2%) |
| 35 to 44 Years | 37 (19.3%) | 57 (27.5%) |
| 45 to 54 Years | 0 (0.0%) | 56 (41.5%) |
| 55 to 64 Years | 54 (26.6%) | 94 (40.2%) |
| 65 to 74 Years | 19 (20.2%) | 26 (17.9%) |
| 75 Years and over | 0 (0.0%) | 1 (0.7%) |
| Total | 404 (25.5%) | 347 (24.6%) |
Income Above Poverty by Sex and Age in Atoka
According to the poverty statistics in Atoka, males aged 5 years and females aged 5 years are the age groups that are most secure financially, with 100.0% of males and 100.0% of females in these age groups living above the poverty line.
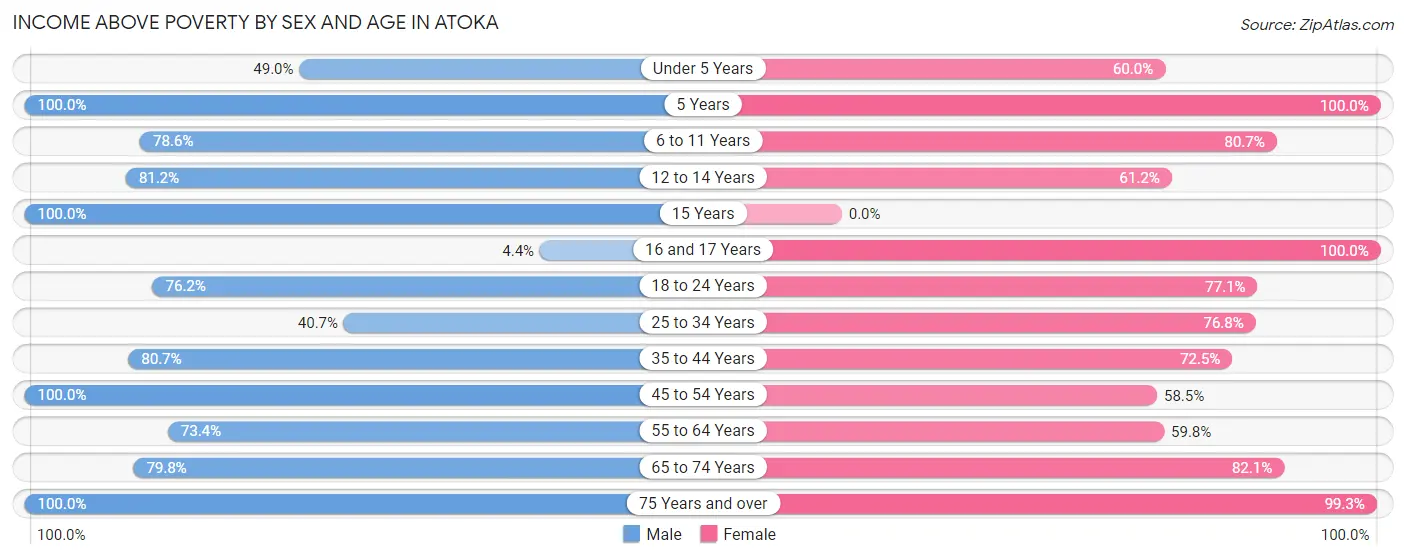
| Age Bracket | Male | Female |
| Under 5 Years | 49 (49.0%) | 18 (60.0%) |
| 5 Years | 42 (100.0%) | 26 (100.0%) |
| 6 to 11 Years | 154 (78.6%) | 46 (80.7%) |
| 12 to 14 Years | 95 (81.2%) | 30 (61.2%) |
| 15 Years | 49 (100.0%) | 0 (0.0%) |
| 16 and 17 Years | 1 (4.3%) | 83 (100.0%) |
| 18 to 24 Years | 93 (76.2%) | 108 (77.1%) |
| 25 to 34 Years | 88 (40.7%) | 129 (76.8%) |
| 35 to 44 Years | 155 (80.7%) | 150 (72.5%) |
| 45 to 54 Years | 152 (100.0%) | 79 (58.5%) |
| 55 to 64 Years | 149 (73.4%) | 140 (59.8%) |
| 65 to 74 Years | 75 (79.8%) | 119 (82.1%) |
| 75 Years and over | 81 (100.0%) | 138 (99.3%) |
| Total | 1,183 (74.5%) | 1,066 (75.4%) |
Income Below Poverty Among Married-Couple Families in Atoka
The poverty statistics for married-couple families in Atoka show that 7.7% or 33 of the total 428 families live below the poverty line. Families with 3 or 4 children have the highest poverty rate of 14.9%, comprising of 7 families. On the other hand, families with 1 or 2 children have the lowest poverty rate of 3.0%, which includes 4 families.
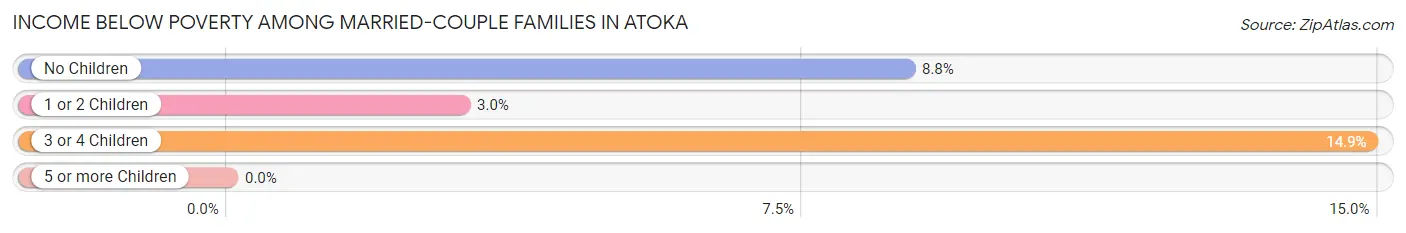
| Children | Above Poverty | Below Poverty |
| No Children | 227 (91.2%) | 22 (8.8%) |
| 1 or 2 Children | 128 (97.0%) | 4 (3.0%) |
| 3 or 4 Children | 40 (85.1%) | 7 (14.9%) |
| 5 or more Children | 0 (0.0%) | 0 (0.0%) |
| Total | 395 (92.3%) | 33 (7.7%) |
Income Below Poverty Among Single-Parent Households in Atoka
According to the poverty data in Atoka, 34.2% or 14 single-father households and 35.1% or 71 single-mother households are living below the poverty line. Among single-father households, those with no children have the highest poverty rate, with 13 households (50.0%) experiencing poverty. Likewise, among single-mother households, those with 1 or 2 children have the highest poverty rate, with 59 households (45.4%) falling below the poverty line.
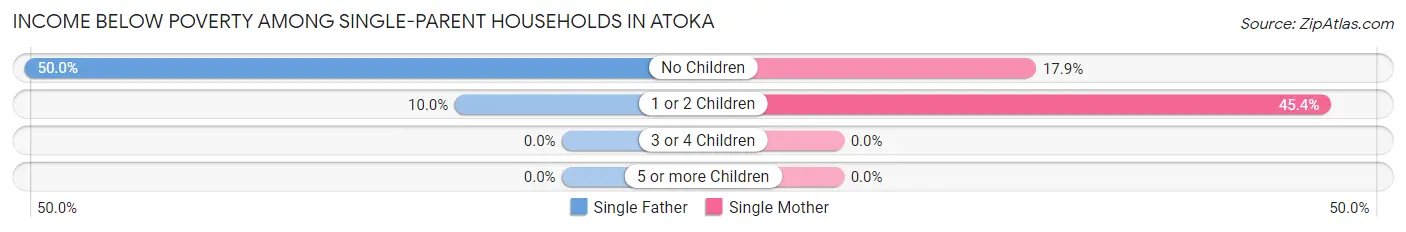
| Children | Single Father | Single Mother |
| No Children | 13 (50.0%) | 12 (17.9%) |
| 1 or 2 Children | 1 (10.0%) | 59 (45.4%) |
| 3 or 4 Children | 0 (0.0%) | 0 (0.0%) |
| 5 or more Children | 0 (0.0%) | 0 (0.0%) |
| Total | 14 (34.2%) | 71 (35.1%) |
Income Below Poverty Among Married-Couple vs Single-Parent Households in Atoka
The poverty data for Atoka shows that 33 of the married-couple family households (7.7%) and 85 of the single-parent households (35.0%) are living below the poverty level. Within the married-couple family households, those with 3 or 4 children have the highest poverty rate, with 7 households (14.9%) falling below the poverty line. Among the single-parent households, those with 1 or 2 children have the highest poverty rate, with 60 household (42.9%) living below poverty.
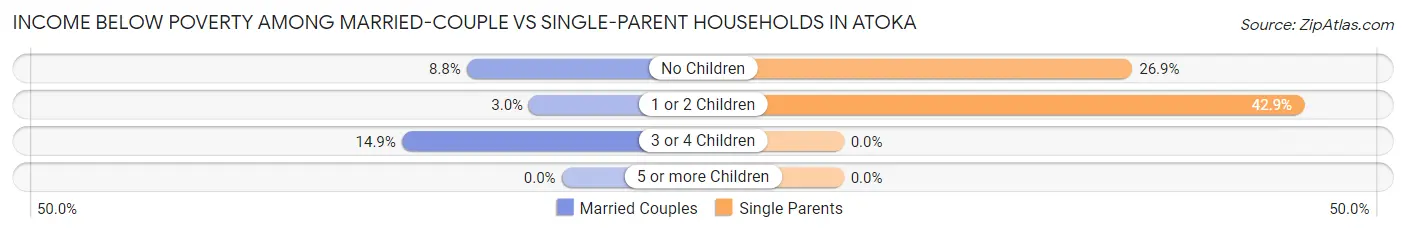
| Children | Married-Couple Families | Single-Parent Households |
| No Children | 22 (8.8%) | 25 (26.9%) |
| 1 or 2 Children | 4 (3.0%) | 60 (42.9%) |
| 3 or 4 Children | 7 (14.9%) | 0 (0.0%) |
| 5 or more Children | 0 (0.0%) | 0 (0.0%) |
| Total | 33 (7.7%) | 85 (35.0%) |
Race in Atoka
The most populous races in Atoka are White / Caucasian (1,922 | 60.8%), Two or more Races (531 | 16.8%), and Native / Alaskan (452 | 14.3%).
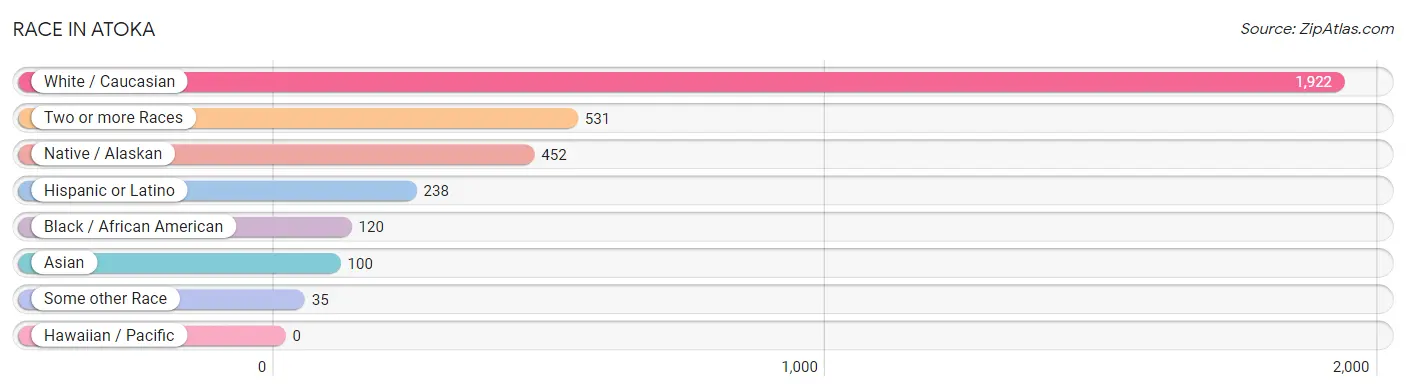
| Race | # Population | % Population |
| Asian | 100 | 3.2% |
| Black / African American | 120 | 3.8% |
| Hawaiian / Pacific | 0 | 0.0% |
| Hispanic or Latino | 238 | 7.5% |
| Native / Alaskan | 452 | 14.3% |
| White / Caucasian | 1,922 | 60.8% |
| Two or more Races | 531 | 16.8% |
| Some other Race | 35 | 1.1% |
| Total | 3,160 | 100.0% |
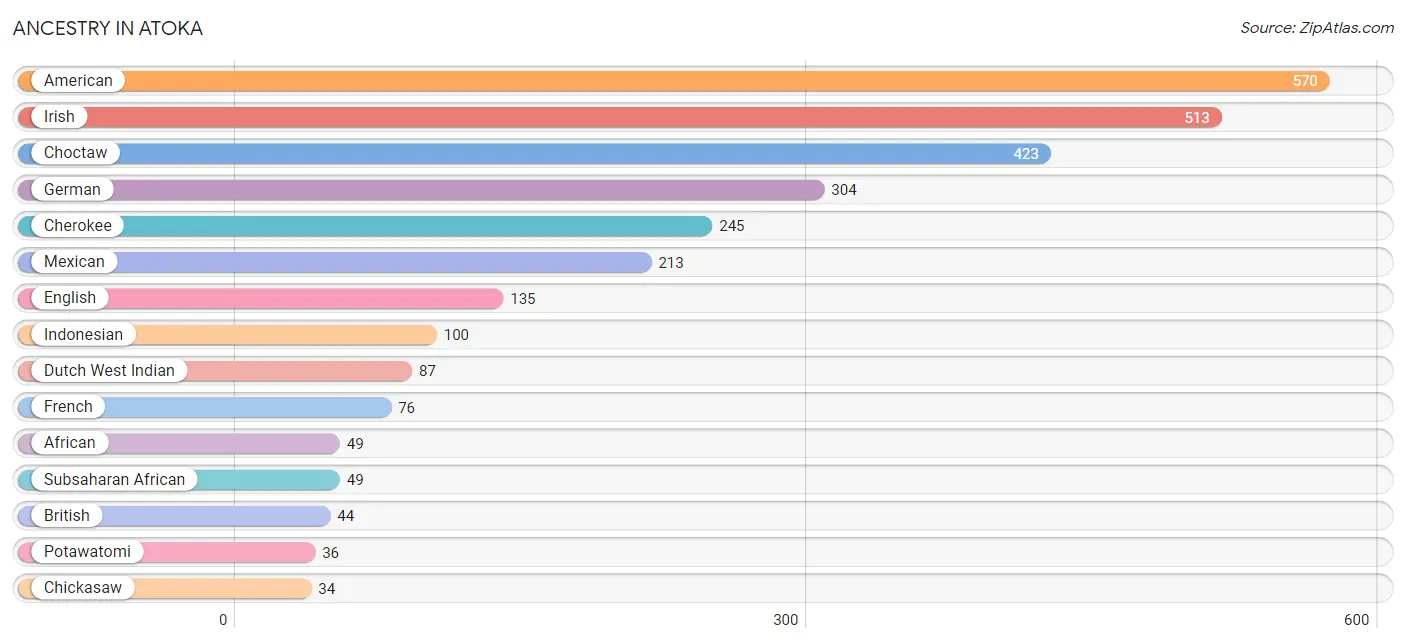
Ancestry in Atoka
The most populous ancestries reported in Atoka are American (570 | 18.0%), Irish (513 | 16.2%), Choctaw (423 | 13.4%), German (304 | 9.6%), and Cherokee (245 | 7.7%), together accounting for 65.0% of all Atoka residents.
| Ancestry | # Population | % Population |
| African | 49 | 1.5% |
| American | 570 | 18.0% |
| Apache | 7 | 0.2% |
| Arab | 10 | 0.3% |
| Blackfeet | 8 | 0.3% |
| Brazilian | 20 | 0.6% |
| British | 44 | 1.4% |
| Cherokee | 245 | 7.7% |
| Chickasaw | 34 | 1.1% |
| Choctaw | 423 | 13.4% |
| Creek | 18 | 0.6% |
| Dutch | 10 | 0.3% |
| Dutch West Indian | 87 | 2.8% |
| English | 135 | 4.3% |
| European | 4 | 0.1% |
| French | 76 | 2.4% |
| German | 304 | 9.6% |
| Indonesian | 100 | 3.2% |
| Irish | 513 | 16.2% |
| Italian | 33 | 1.0% |
| Lebanese | 10 | 0.3% |
| Mexican | 213 | 6.7% |
| Potawatomi | 36 | 1.1% |
| Puerto Rican | 4 | 0.1% |
| Scottish | 32 | 1.0% |
| Sioux | 7 | 0.2% |
| Spaniard | 21 | 0.7% |
| Subsaharan African | 49 | 1.5% |
| Welsh | 23 | 0.7% | View All 29 Rows |
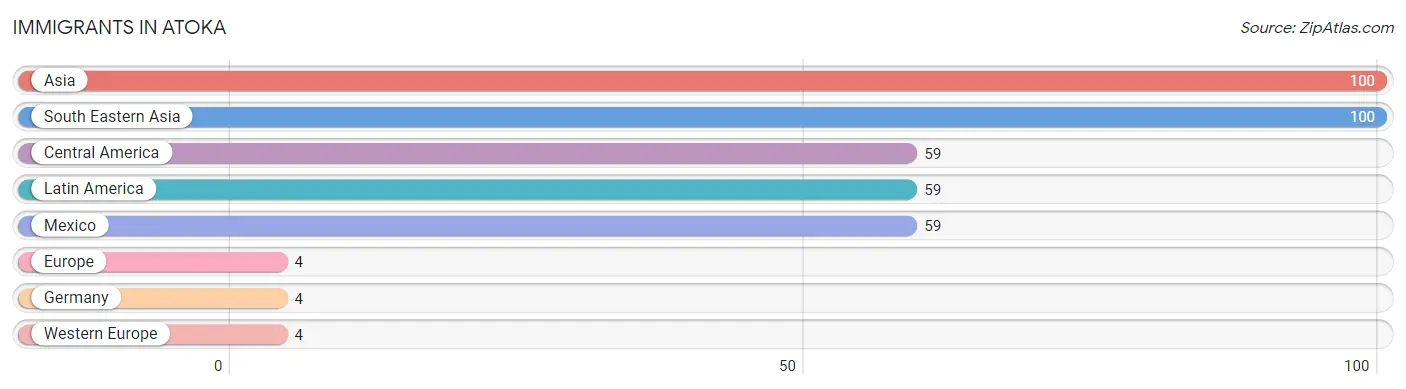
Immigrants in Atoka
The most numerous immigrant groups reported in Atoka came from Asia (100 | 3.2%), South Eastern Asia (100 | 3.2%), Central America (59 | 1.9%), Latin America (59 | 1.9%), and Mexico (59 | 1.9%), together accounting for 11.9% of all Atoka residents.
| Immigration Origin | # Population | % Population |
| Asia | 100 | 3.2% |
| Central America | 59 | 1.9% |
| Europe | 4 | 0.1% |
| Germany | 4 | 0.1% |
| Latin America | 59 | 1.9% |
| Mexico | 59 | 1.9% |
| South Eastern Asia | 100 | 3.2% |
| Western Europe | 4 | 0.1% | View All 8 Rows |
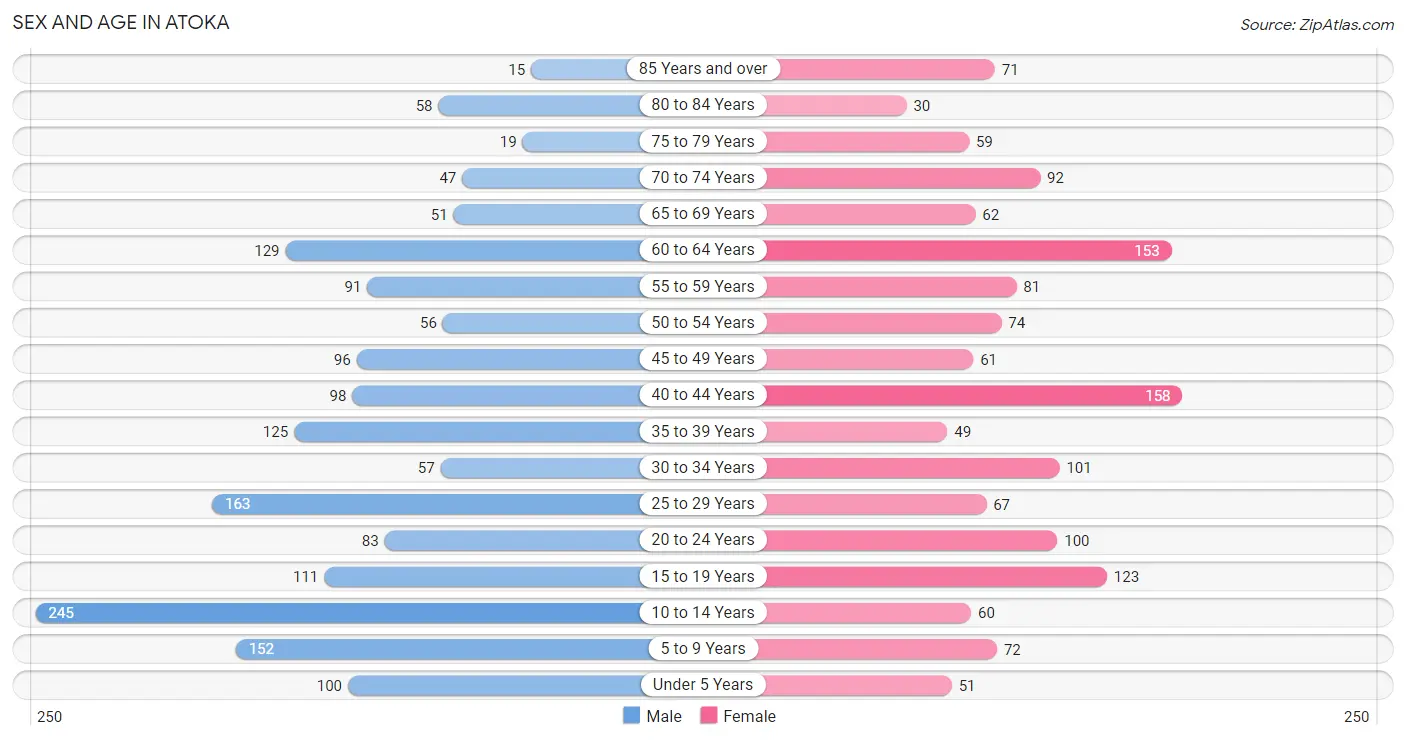
Sex and Age in Atoka
Sex and Age in Atoka
The most populous age groups in Atoka are 10 to 14 Years (245 | 14.4%) for men and 40 to 44 Years (158 | 10.8%) for women.
| Age Bracket | Male | Female |
| Under 5 Years | 100 (5.9%) | 51 (3.5%) |
| 5 to 9 Years | 152 (9.0%) | 72 (4.9%) |
| 10 to 14 Years | 245 (14.4%) | 60 (4.1%) |
| 15 to 19 Years | 111 (6.5%) | 123 (8.4%) |
| 20 to 24 Years | 83 (4.9%) | 100 (6.8%) |
| 25 to 29 Years | 163 (9.6%) | 67 (4.6%) |
| 30 to 34 Years | 57 (3.4%) | 101 (6.9%) |
| 35 to 39 Years | 125 (7.4%) | 49 (3.4%) |
| 40 to 44 Years | 98 (5.8%) | 158 (10.8%) |
| 45 to 49 Years | 96 (5.7%) | 61 (4.2%) |
| 50 to 54 Years | 56 (3.3%) | 74 (5.1%) |
| 55 to 59 Years | 91 (5.4%) | 81 (5.5%) |
| 60 to 64 Years | 129 (7.6%) | 153 (10.4%) |
| 65 to 69 Years | 51 (3.0%) | 62 (4.2%) |
| 70 to 74 Years | 47 (2.8%) | 92 (6.3%) |
| 75 to 79 Years | 19 (1.1%) | 59 (4.0%) |
| 80 to 84 Years | 58 (3.4%) | 30 (2.1%) |
| 85 Years and over | 15 (0.9%) | 71 (4.9%) |
| Total | 1,696 (100.0%) | 1,464 (100.0%) |
Families and Households in Atoka
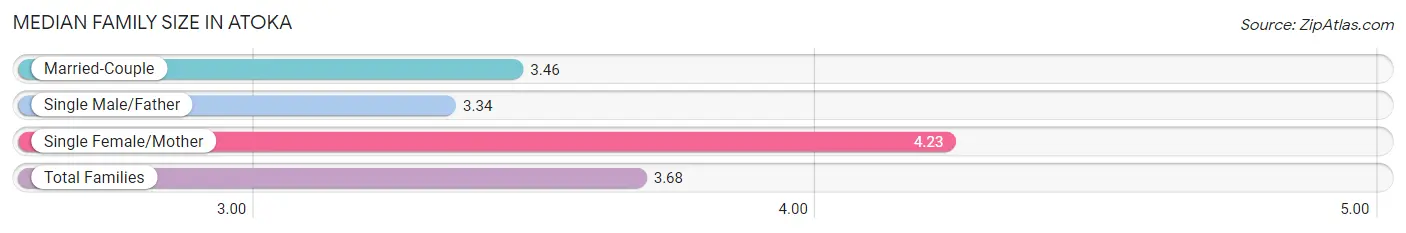
Median Family Size in Atoka
The median family size in Atoka is 3.68 persons per family, with single female/mother families (202 | 30.1%) accounting for the largest median family size of 4.23 persons per family. On the other hand, single male/father families (41 | 6.1%) represent the smallest median family size with 3.34 persons per family.
| Family Type | # Families | Family Size |
| Married-Couple | 428 (63.8%) | 3.46 |
| Single Male/Father | 41 (6.1%) | 3.34 |
| Single Female/Mother | 202 (30.1%) | 4.23 |
| Total Families | 671 (100.0%) | 3.68 |
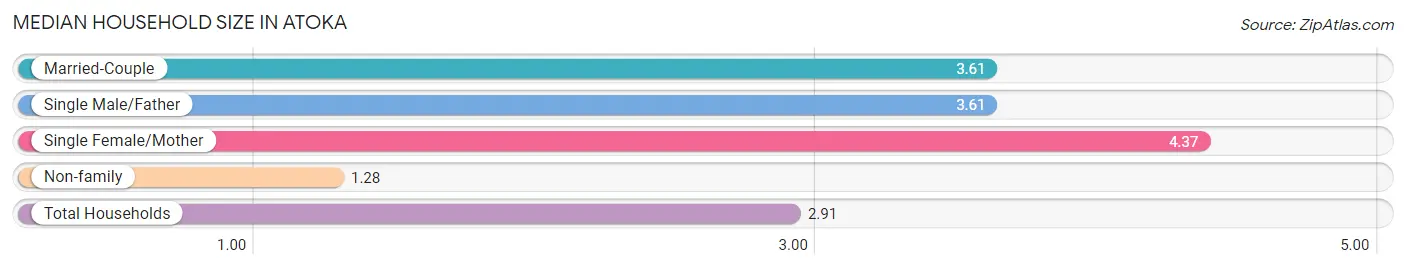
Median Household Size in Atoka
The median household size in Atoka is 2.91 persons per household, with single female/mother households (202 | 19.2%) accounting for the largest median household size of 4.37 persons per household. non-family households (381 | 36.2%) represent the smallest median household size with 1.28 persons per household.
| Household Type | # Households | Household Size |
| Married-Couple | 428 (40.7%) | 3.61 |
| Single Male/Father | 41 (3.9%) | 3.61 |
| Single Female/Mother | 202 (19.2%) | 4.37 |
| Non-family | 381 (36.2%) | 1.28 |
| Total Households | 1,052 (100.0%) | 2.91 |
Household Size by Marriage Status in Atoka
Out of a total of 1,052 households in Atoka, 671 (63.8%) are family households, while 381 (36.2%) are nonfamily households. The most numerous type of family households are 2-person households, comprising 323, and the most common type of nonfamily households are 1-person households, comprising 325.
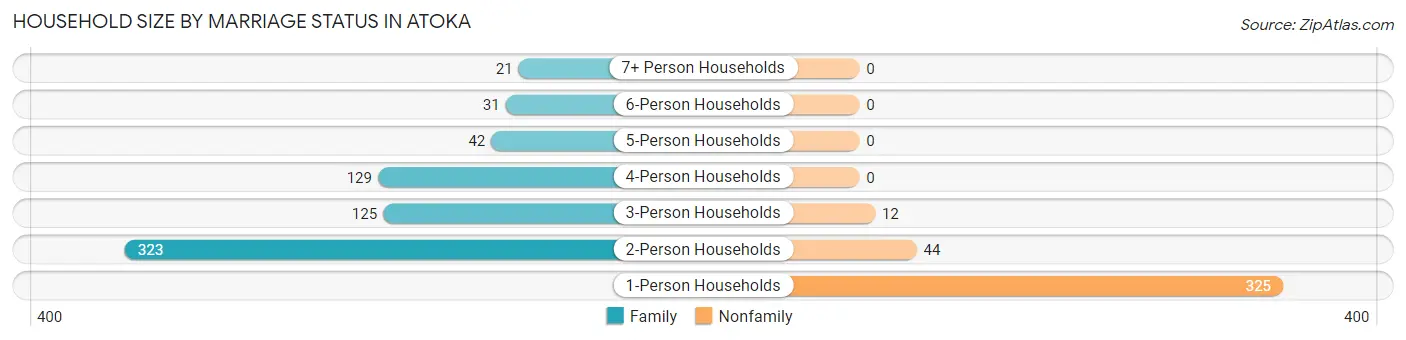
| Household Size | Family Households | Nonfamily Households |
| 1-Person Households | - | 325 (30.9%) |
| 2-Person Households | 323 (30.7%) | 44 (4.2%) |
| 3-Person Households | 125 (11.9%) | 12 (1.1%) |
| 4-Person Households | 129 (12.3%) | 0 (0.0%) |
| 5-Person Households | 42 (4.0%) | 0 (0.0%) |
| 6-Person Households | 31 (2.9%) | 0 (0.0%) |
| 7+ Person Households | 21 (2.0%) | 0 (0.0%) |
| Total | 671 (63.8%) | 381 (36.2%) |
Female Fertility in Atoka
Fertility by Age in Atoka
Average fertility rate in Atoka is 87.0 births per 1,000 women. Women in the age bracket of 35 to 50 years have the highest fertility rate with 143.0 births per 1,000 women. Women in the age bracket of 35 to 50 years acount for 67.2% of all women with births.
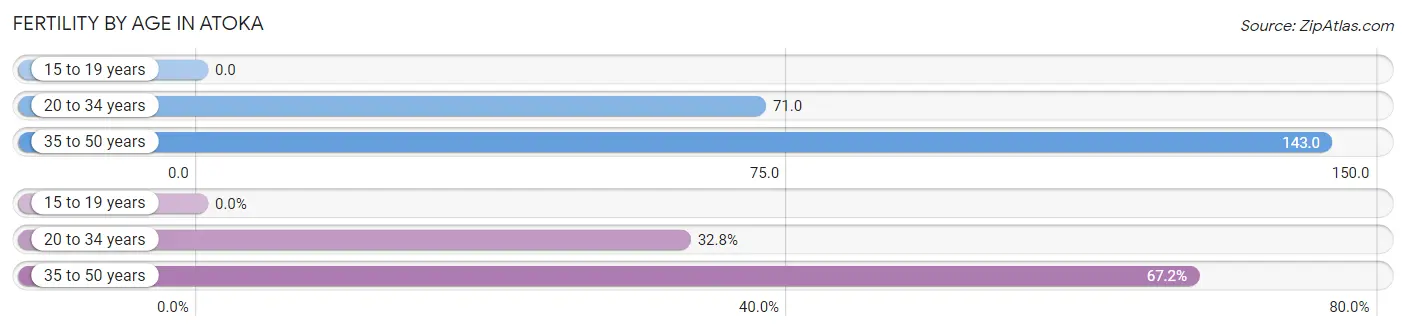
| Age Bracket | Women with Births | Births / 1,000 Women |
| 15 to 19 years | 0 (0.0%) | 0.0 |
| 20 to 34 years | 19 (32.8%) | 71.0 |
| 35 to 50 years | 39 (67.2%) | 143.0 |
| Total | 58 (100.0%) | 87.0 |
Fertility by Age by Marriage Status in Atoka
60.3% of women with births (58) in Atoka are married. The highest percentage of unmarried women with births falls into 20 to 34 years age bracket with 52.6% of them unmarried at the time of birth, while the lowest percentage of unmarried women with births belong to 35 to 50 years age bracket with 33.3% of them unmarried.
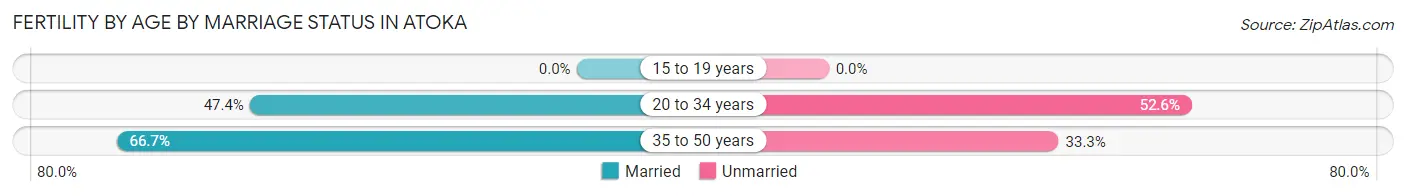
| Age Bracket | Married | Unmarried |
| 15 to 19 years | 0 (0.0%) | 0 (0.0%) |
| 20 to 34 years | 9 (47.4%) | 10 (52.6%) |
| 35 to 50 years | 26 (66.7%) | 13 (33.3%) |
| Total | 35 (60.3%) | 23 (39.7%) |
Fertility by Education in Atoka
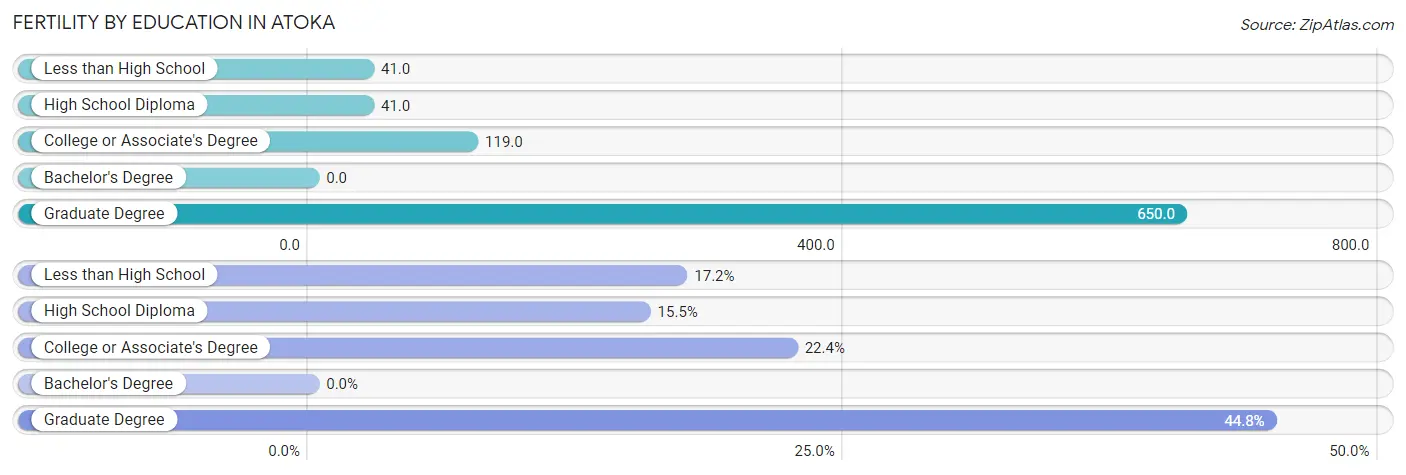
| Educational Attainment | Women with Births | Births / 1,000 Women |
| Less than High School | 10 (17.2%) | 41.0 |
| High School Diploma | 9 (15.5%) | 41.0 |
| College or Associate's Degree | 13 (22.4%) | 119.0 |
| Bachelor's Degree | 0 (0.0%) | 0.0 |
| Graduate Degree | 26 (44.8%) | 650.0 |
| Total | 58 (100.0%) | 87.0 |
Fertility by Education by Marriage Status in Atoka
39.7% of women with births in Atoka are unmarried. Women with the educational attainment of high school diploma are most likely to be married with 100.0% of them married at childbirth, while women with the educational attainment of less than high school are least likely to be married with 100.0% of them unmarried at childbirth.
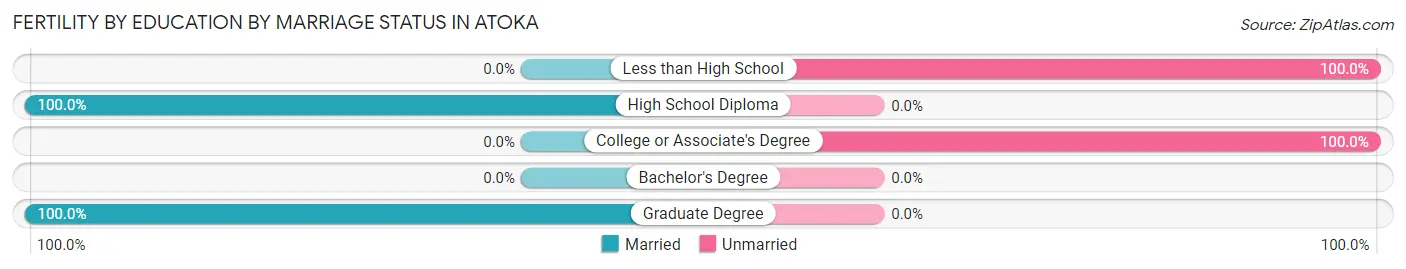
| Educational Attainment | Married | Unmarried |
| Less than High School | 0 (0.0%) | 10 (100.0%) |
| High School Diploma | 9 (100.0%) | 0 (0.0%) |
| College or Associate's Degree | 0 (0.0%) | 13 (100.0%) |
| Bachelor's Degree | 0 (0.0%) | 0 (0.0%) |
| Graduate Degree | 26 (100.0%) | 0 (0.0%) |
| Total | 35 (60.3%) | 23 (39.7%) |
Employment Characteristics in Atoka
Employment by Class of Employer in Atoka
Among the 933 employed individuals in Atoka, private company employees (612 | 65.6%), state government employees (76 | 8.2%), and not-for-profit organizations (67 | 7.2%) make up the most common classes of employment.
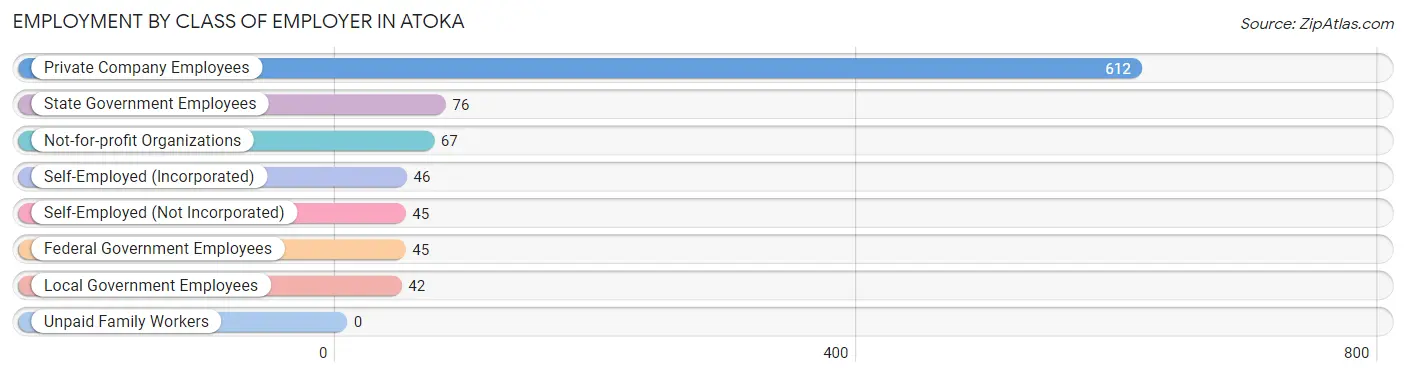
| Employer Class | # Employees | % Employees |
| Private Company Employees | 612 | 65.6% |
| Self-Employed (Incorporated) | 46 | 4.9% |
| Self-Employed (Not Incorporated) | 45 | 4.8% |
| Not-for-profit Organizations | 67 | 7.2% |
| Local Government Employees | 42 | 4.5% |
| State Government Employees | 76 | 8.2% |
| Federal Government Employees | 45 | 4.8% |
| Unpaid Family Workers | 0 | 0.0% |
| Total | 933 | 100.0% |
Employment Status by Age in Atoka
According to the labor force statistics for Atoka, out of the total population over 16 years of age (2,431), 41.8% or 1,016 individuals are in the labor force, with 7.2% or 73 of them unemployed. The age group with the highest labor force participation rate is 16 to 19 years, with 69.7% or 129 individuals in the labor force. Within the labor force, the 45 to 54 years age range has the highest percentage of unemployed individuals, with 31.2% or 49 of them being unemployed.
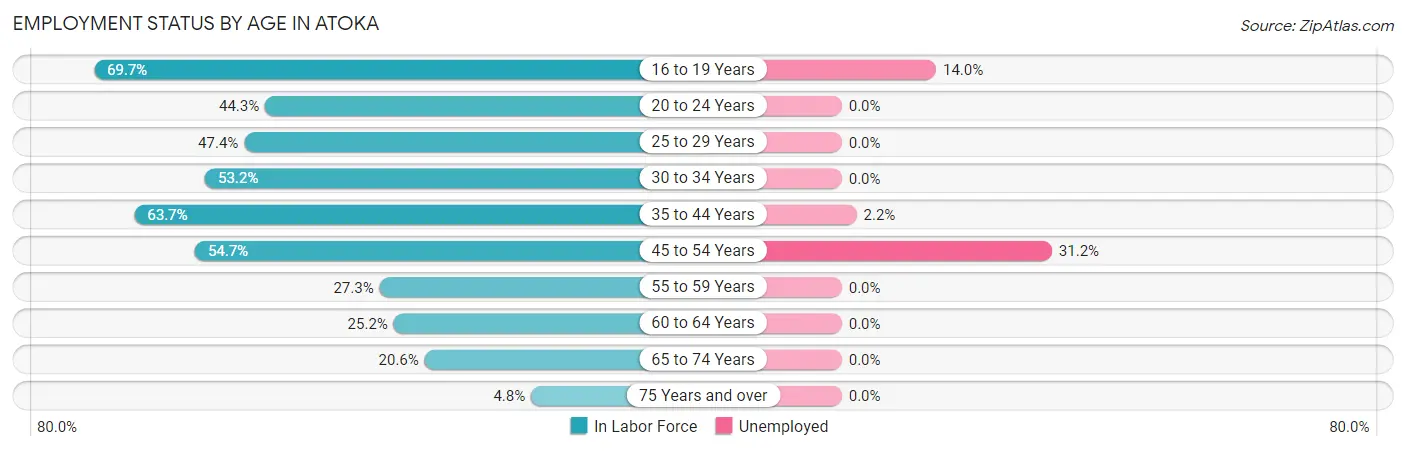
| Age Bracket | In Labor Force | Unemployed |
| 16 to 19 Years | 129 (69.7%) | 18 (14.0%) |
| 20 to 24 Years | 81 (44.3%) | 0 (0.0%) |
| 25 to 29 Years | 109 (47.4%) | 0 (0.0%) |
| 30 to 34 Years | 84 (53.2%) | 0 (0.0%) |
| 35 to 44 Years | 274 (63.7%) | 6 (2.2%) |
| 45 to 54 Years | 157 (54.7%) | 49 (31.2%) |
| 55 to 59 Years | 47 (27.3%) | 0 (0.0%) |
| 60 to 64 Years | 71 (25.2%) | 0 (0.0%) |
| 65 to 74 Years | 52 (20.6%) | 0 (0.0%) |
| 75 Years and over | 12 (4.8%) | 0 (0.0%) |
| Total | 1,016 (41.8%) | 73 (7.2%) |
Employment Status by Educational Attainment in Atoka
According to labor force statistics for Atoka, 47.6% of individuals (742) out of the total population between 25 and 64 years of age (1,559) are in the labor force, with 7.4% or 55 of them being unemployed. The group with the highest labor force participation rate are those with the educational attainment of bachelor's degree or higher, with 95.8% or 161 individuals in the labor force. Within the labor force, individuals with less than high school education have the highest percentage of unemployment, with 23.0% or 45 of them being unemployed.
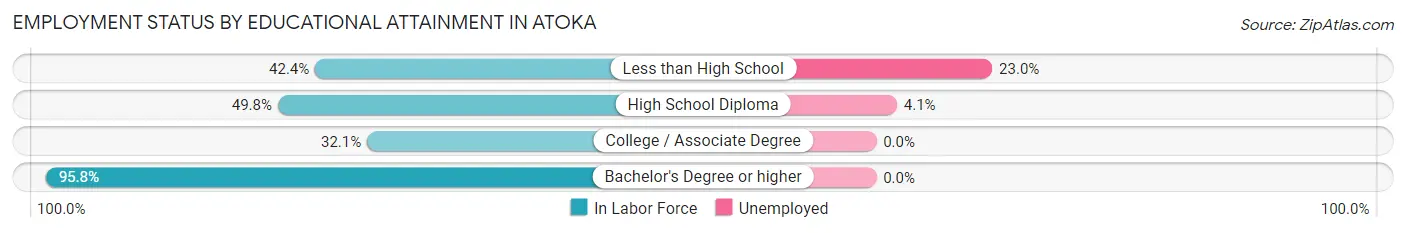
| Educational Attainment | In Labor Force | Unemployed |
| Less than High School | 196 (42.4%) | 106 (23.0%) |
| High School Diploma | 244 (49.8%) | 20 (4.1%) |
| College / Associate Degree | 141 (32.1%) | 0 (0.0%) |
| Bachelor's Degree or higher | 161 (95.8%) | 0 (0.0%) |
| Total | 742 (47.6%) | 115 (7.4%) |
Employment Occupations by Sex in Atoka
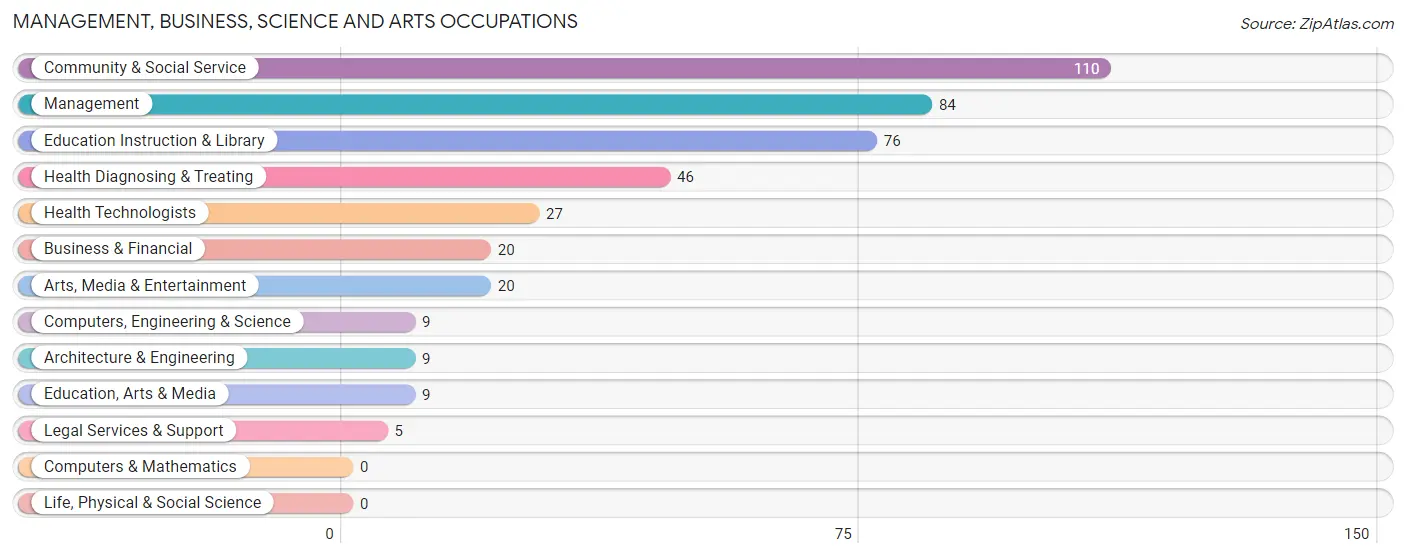
Management, Business, Science and Arts Occupations
The most common Management, Business, Science and Arts occupations in Atoka are Community & Social Service (110 | 11.7%), Management (84 | 8.9%), Education Instruction & Library (76 | 8.1%), Health Diagnosing & Treating (46 | 4.9%), and Health Technologists (27 | 2.9%).
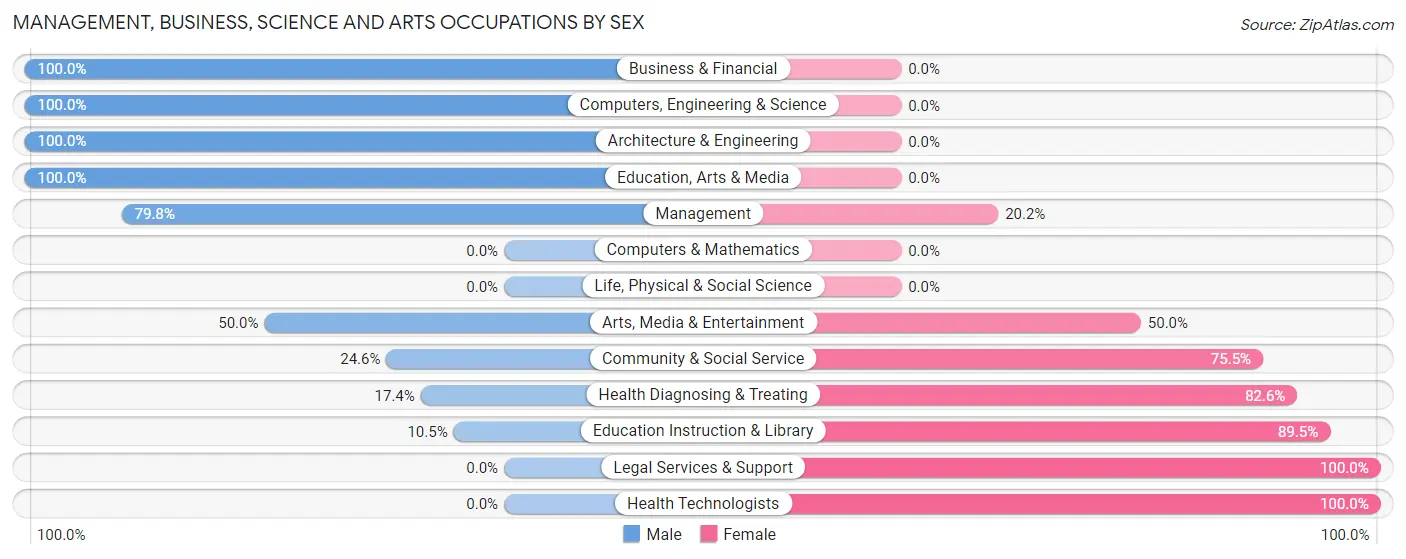
Management, Business, Science and Arts Occupations by Sex
Within the Management, Business, Science and Arts occupations in Atoka, the most male-oriented occupations are Business & Financial (100.0%), Computers, Engineering & Science (100.0%), and Architecture & Engineering (100.0%), while the most female-oriented occupations are Legal Services & Support (100.0%), Health Technologists (100.0%), and Education Instruction & Library (89.5%).
| Occupation | Male | Female |
| Management | 67 (79.8%) | 17 (20.2%) |
| Business & Financial | 20 (100.0%) | 0 (0.0%) |
| Computers, Engineering & Science | 9 (100.0%) | 0 (0.0%) |
| Computers & Mathematics | 0 (0.0%) | 0 (0.0%) |
| Architecture & Engineering | 9 (100.0%) | 0 (0.0%) |
| Life, Physical & Social Science | 0 (0.0%) | 0 (0.0%) |
| Community & Social Service | 27 (24.5%) | 83 (75.4%) |
| Education, Arts & Media | 9 (100.0%) | 0 (0.0%) |
| Legal Services & Support | 0 (0.0%) | 5 (100.0%) |
| Education Instruction & Library | 8 (10.5%) | 68 (89.5%) |
| Arts, Media & Entertainment | 10 (50.0%) | 10 (50.0%) |
| Health Diagnosing & Treating | 8 (17.4%) | 38 (82.6%) |
| Health Technologists | 0 (0.0%) | 27 (100.0%) |
| Total (Category) | 131 (48.7%) | 138 (51.3%) |
| Total (Overall) | 500 (53.0%) | 443 (47.0%) |
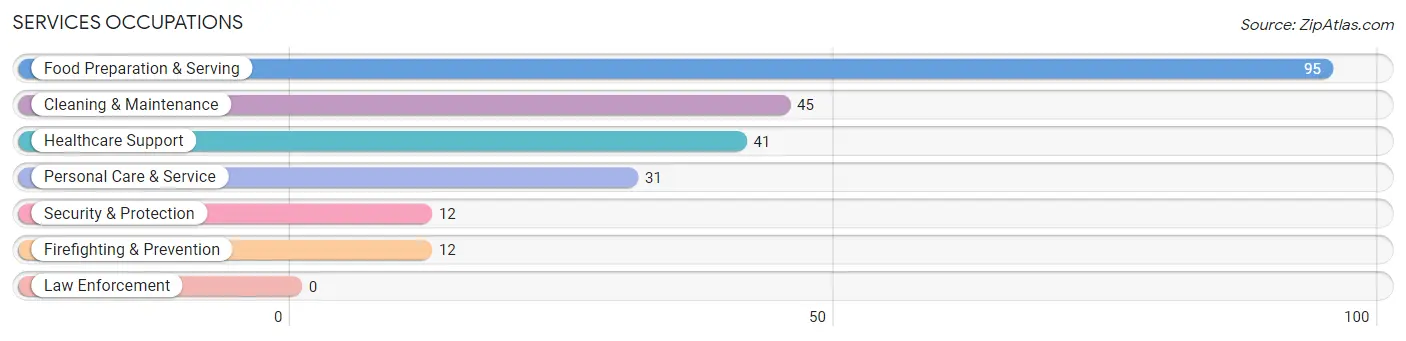
Services Occupations
The most common Services occupations in Atoka are Food Preparation & Serving (95 | 10.1%), Cleaning & Maintenance (45 | 4.8%), Healthcare Support (41 | 4.3%), Personal Care & Service (31 | 3.3%), and Security & Protection (12 | 1.3%).
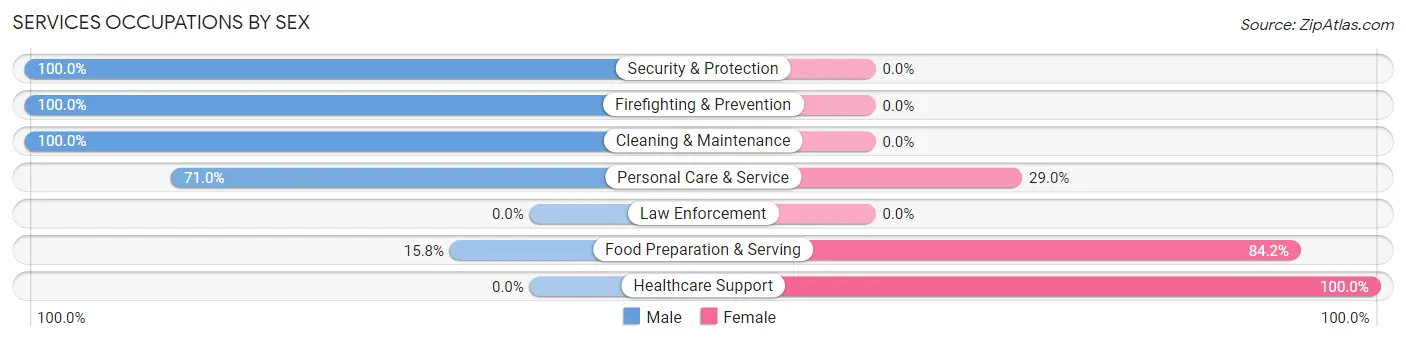
Services Occupations by Sex
Within the Services occupations in Atoka, the most male-oriented occupations are Security & Protection (100.0%), Firefighting & Prevention (100.0%), and Cleaning & Maintenance (100.0%), while the most female-oriented occupations are Healthcare Support (100.0%), Food Preparation & Serving (84.2%), and Personal Care & Service (29.0%).
| Occupation | Male | Female |
| Healthcare Support | 0 (0.0%) | 41 (100.0%) |
| Security & Protection | 12 (100.0%) | 0 (0.0%) |
| Firefighting & Prevention | 12 (100.0%) | 0 (0.0%) |
| Law Enforcement | 0 (0.0%) | 0 (0.0%) |
| Food Preparation & Serving | 15 (15.8%) | 80 (84.2%) |
| Cleaning & Maintenance | 45 (100.0%) | 0 (0.0%) |
| Personal Care & Service | 22 (71.0%) | 9 (29.0%) |
| Total (Category) | 94 (42.0%) | 130 (58.0%) |
| Total (Overall) | 500 (53.0%) | 443 (47.0%) |
Sales and Office Occupations
The most common Sales and Office occupations in Atoka are Sales & Related (122 | 12.9%), and Office & Administration (98 | 10.4%).
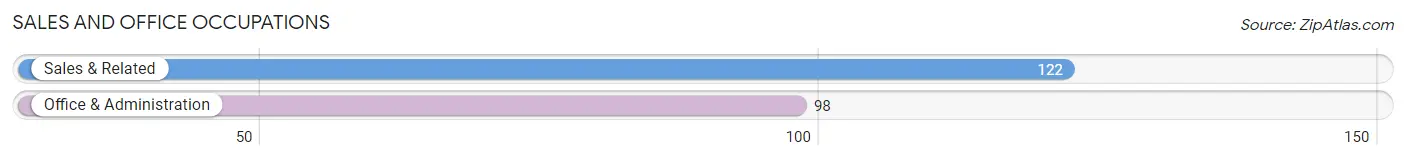
Sales and Office Occupations by Sex
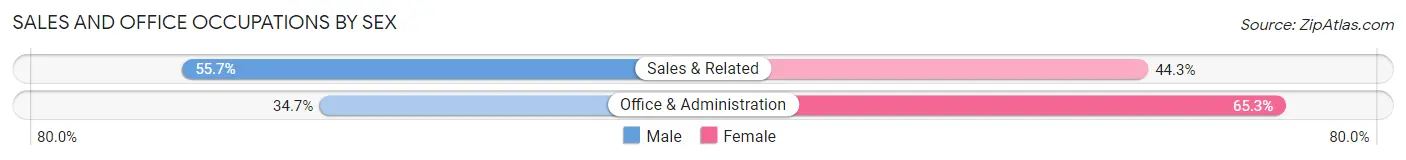
| Occupation | Male | Female |
| Sales & Related | 68 (55.7%) | 54 (44.3%) |
| Office & Administration | 34 (34.7%) | 64 (65.3%) |
| Total (Category) | 102 (46.4%) | 118 (53.6%) |
| Total (Overall) | 500 (53.0%) | 443 (47.0%) |
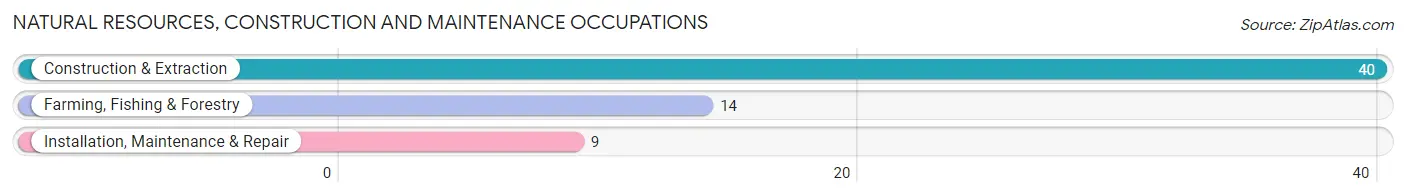
Natural Resources, Construction and Maintenance Occupations
The most common Natural Resources, Construction and Maintenance occupations in Atoka are Construction & Extraction (40 | 4.2%), Farming, Fishing & Forestry (14 | 1.5%), and Installation, Maintenance & Repair (9 | 0.9%).
Natural Resources, Construction and Maintenance Occupations by Sex
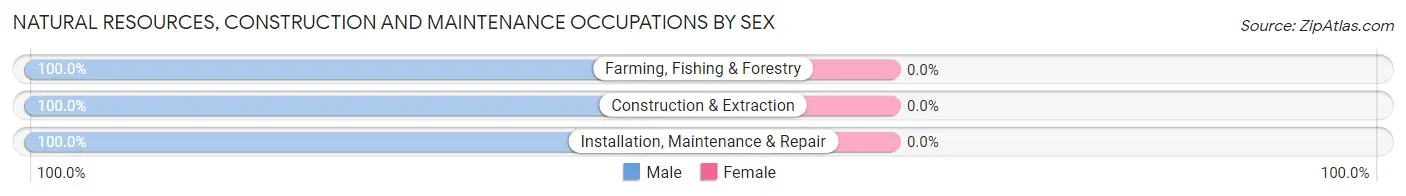
| Occupation | Male | Female |
| Farming, Fishing & Forestry | 14 (100.0%) | 0 (0.0%) |
| Construction & Extraction | 40 (100.0%) | 0 (0.0%) |
| Installation, Maintenance & Repair | 9 (100.0%) | 0 (0.0%) |
| Total (Category) | 63 (100.0%) | 0 (0.0%) |
| Total (Overall) | 500 (53.0%) | 443 (47.0%) |
Production, Transportation and Moving Occupations
The most common Production, Transportation and Moving occupations in Atoka are Production (88 | 9.3%), Material Moving (60 | 6.4%), and Transportation (19 | 2.0%).
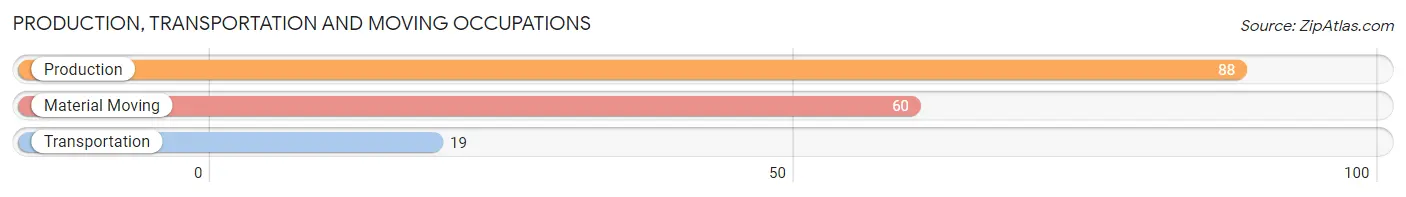
Production, Transportation and Moving Occupations by Sex
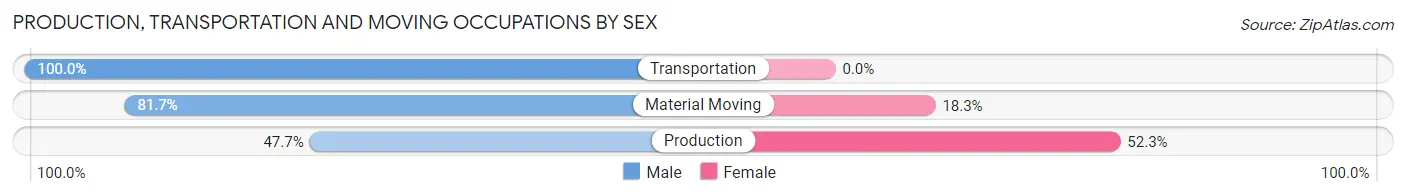
| Occupation | Male | Female |
| Production | 42 (47.7%) | 46 (52.3%) |
| Transportation | 19 (100.0%) | 0 (0.0%) |
| Material Moving | 49 (81.7%) | 11 (18.3%) |
| Total (Category) | 110 (65.9%) | 57 (34.1%) |
| Total (Overall) | 500 (53.0%) | 443 (47.0%) |
Employment Industries by Sex in Atoka
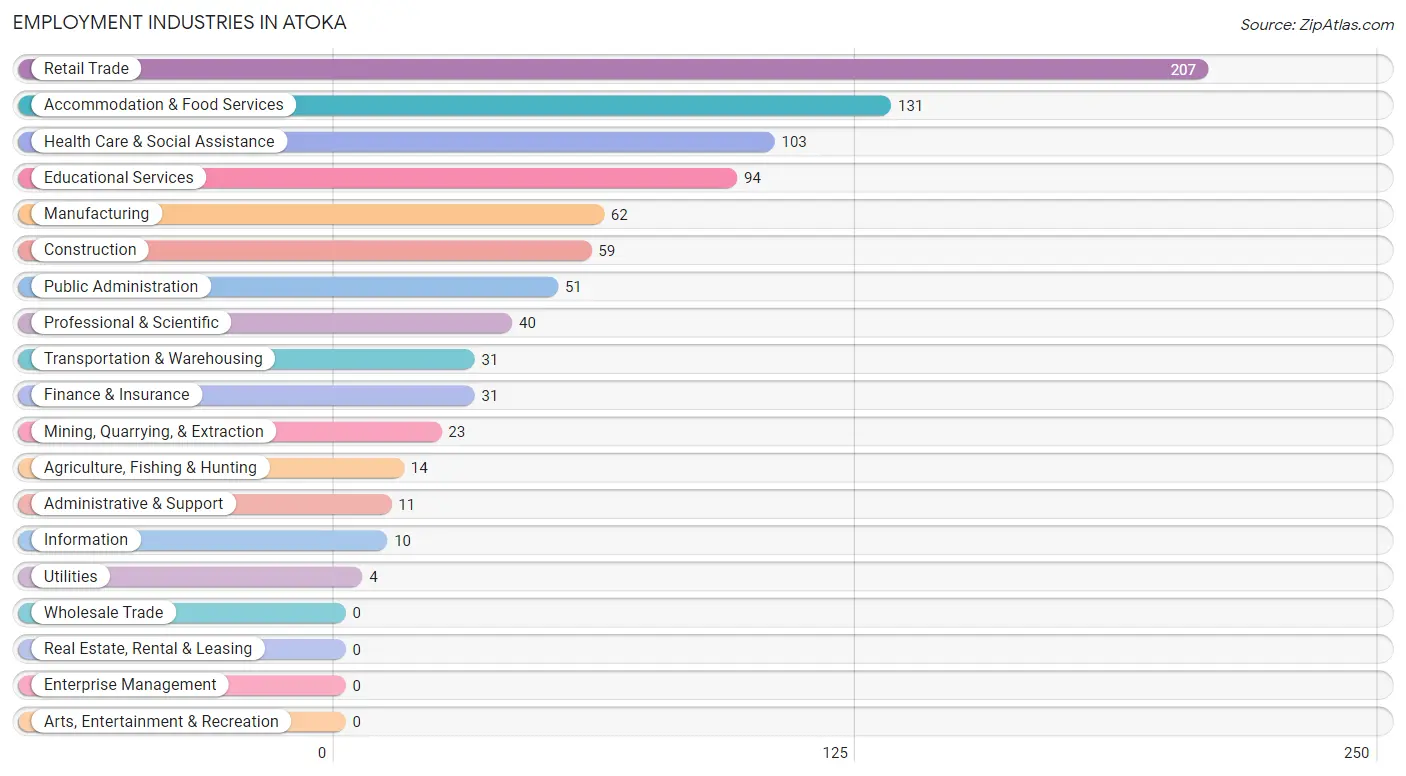
Employment Industries in Atoka
The major employment industries in Atoka include Retail Trade (207 | 22.0%), Accommodation & Food Services (131 | 13.9%), Health Care & Social Assistance (103 | 10.9%), Educational Services (94 | 10.0%), and Manufacturing (62 | 6.6%).
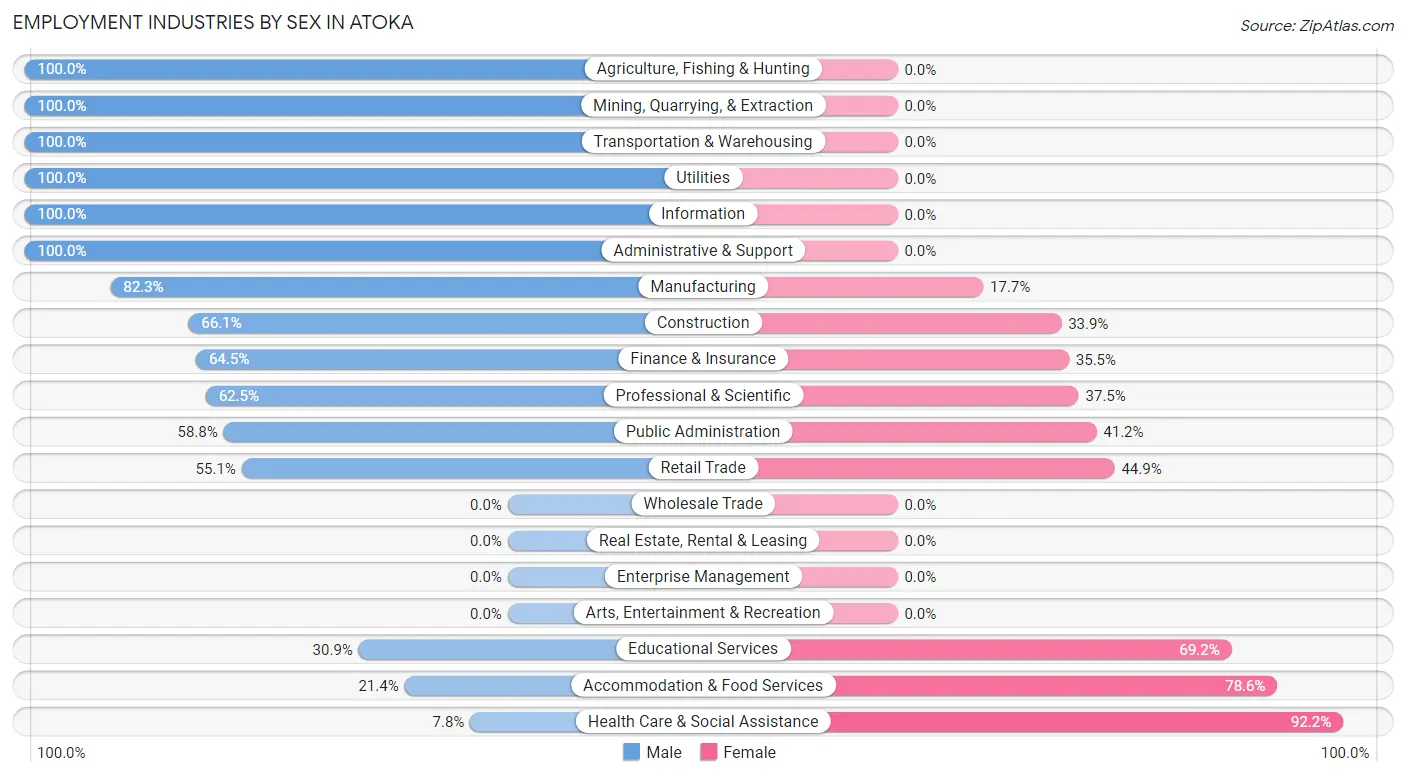
Employment Industries by Sex in Atoka
The Atoka industries that see more men than women are Agriculture, Fishing & Hunting (100.0%), Mining, Quarrying, & Extraction (100.0%), and Transportation & Warehousing (100.0%), whereas the industries that tend to have a higher number of women are Health Care & Social Assistance (92.2%), Accommodation & Food Services (78.6%), and Educational Services (69.2%).
| Industry | Male | Female |
| Agriculture, Fishing & Hunting | 14 (100.0%) | 0 (0.0%) |
| Mining, Quarrying, & Extraction | 23 (100.0%) | 0 (0.0%) |
| Construction | 39 (66.1%) | 20 (33.9%) |
| Manufacturing | 51 (82.3%) | 11 (17.7%) |
| Wholesale Trade | 0 (0.0%) | 0 (0.0%) |
| Retail Trade | 114 (55.1%) | 93 (44.9%) |
| Transportation & Warehousing | 31 (100.0%) | 0 (0.0%) |
| Utilities | 4 (100.0%) | 0 (0.0%) |
| Information | 10 (100.0%) | 0 (0.0%) |
| Finance & Insurance | 20 (64.5%) | 11 (35.5%) |
| Real Estate, Rental & Leasing | 0 (0.0%) | 0 (0.0%) |
| Professional & Scientific | 25 (62.5%) | 15 (37.5%) |
| Enterprise Management | 0 (0.0%) | 0 (0.0%) |
| Administrative & Support | 11 (100.0%) | 0 (0.0%) |
| Educational Services | 29 (30.8%) | 65 (69.2%) |
| Health Care & Social Assistance | 8 (7.8%) | 95 (92.2%) |
| Arts, Entertainment & Recreation | 0 (0.0%) | 0 (0.0%) |
| Accommodation & Food Services | 28 (21.4%) | 103 (78.6%) |
| Public Administration | 30 (58.8%) | 21 (41.2%) |
| Total | 500 (53.0%) | 443 (47.0%) |
Education in Atoka
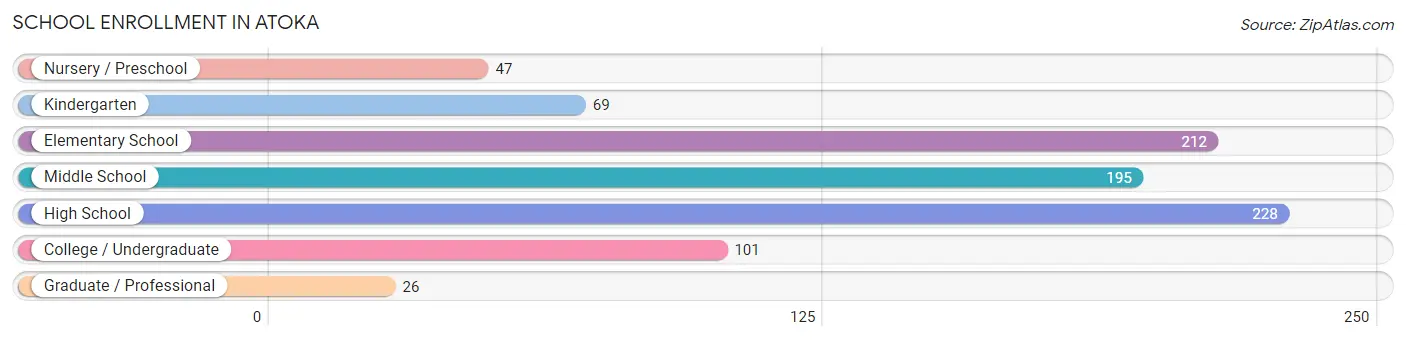
School Enrollment in Atoka
The most common levels of schooling among the 878 students in Atoka are high school (228 | 26.0%), elementary school (212 | 24.1%), and middle school (195 | 22.2%).
| School Level | # Students | % Students |
| Nursery / Preschool | 47 | 5.3% |
| Kindergarten | 69 | 7.9% |
| Elementary School | 212 | 24.1% |
| Middle School | 195 | 22.2% |
| High School | 228 | 26.0% |
| College / Undergraduate | 101 | 11.5% |
| Graduate / Professional | 26 | 3.0% |
| Total | 878 | 100.0% |
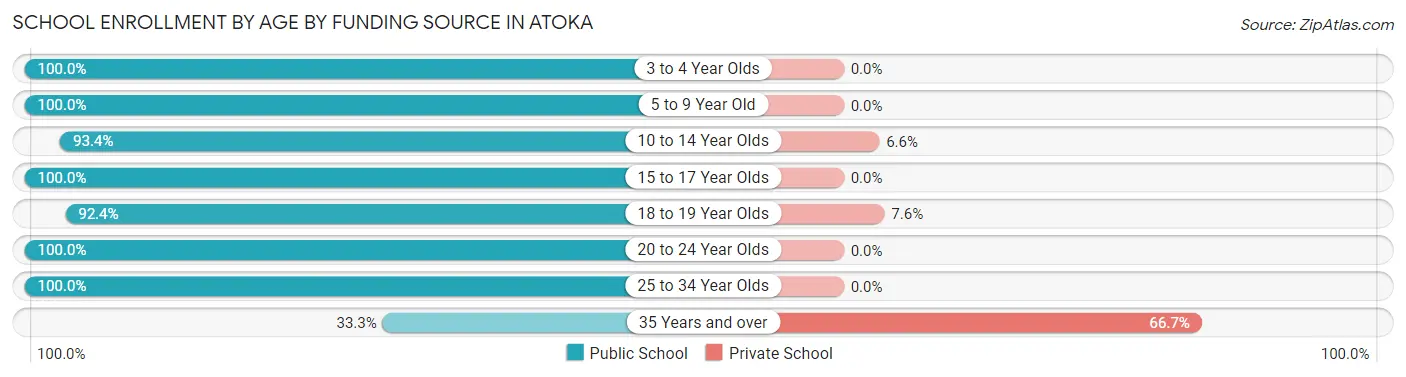
School Enrollment by Age by Funding Source in Atoka
Out of a total of 878 students who are enrolled in schools in Atoka, 51 (5.8%) attend a private institution, while the remaining 827 (94.2%) are enrolled in public schools. The age group of 35 years and over has the highest likelihood of being enrolled in private schools, with 26 (66.7% in the age bracket) enrolled. Conversely, the age group of 3 to 4 year olds has the lowest likelihood of being enrolled in a private school, with 31 (100.0% in the age bracket) attending a public institution.
| Age Bracket | Public School | Private School |
| 3 to 4 Year Olds | 31 (100.0%) | 0 (0.0%) |
| 5 to 9 Year Old | 206 (100.0%) | 0 (0.0%) |
| 10 to 14 Year Olds | 268 (93.4%) | 19 (6.6%) |
| 15 to 17 Year Olds | 155 (100.0%) | 0 (0.0%) |
| 18 to 19 Year Olds | 73 (92.4%) | 6 (7.6%) |
| 20 to 24 Year Olds | 27 (100.0%) | 0 (0.0%) |
| 25 to 34 Year Olds | 54 (100.0%) | 0 (0.0%) |
| 35 Years and over | 13 (33.3%) | 26 (66.7%) |
| Total | 827 (94.2%) | 51 (5.8%) |
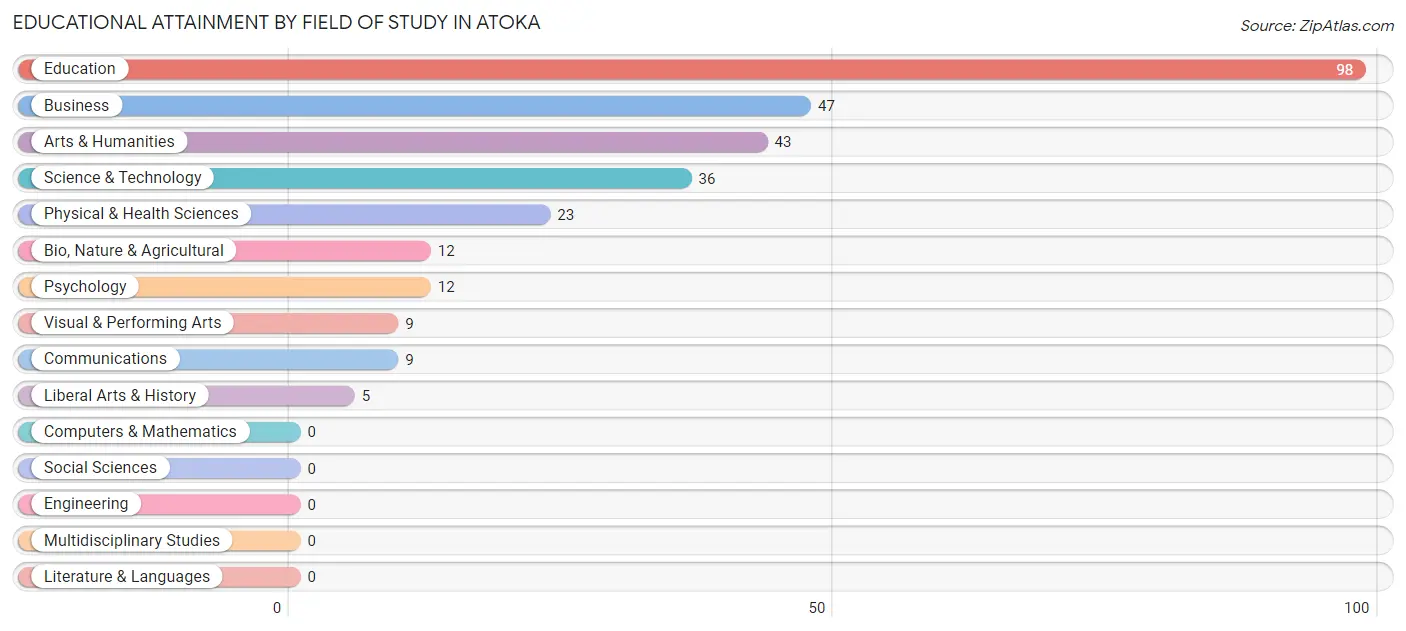
Educational Attainment by Field of Study in Atoka
Education (98 | 33.3%), business (47 | 16.0%), arts & humanities (43 | 14.6%), science & technology (36 | 12.2%), and physical & health sciences (23 | 7.8%) are the most common fields of study among 294 individuals in Atoka who have obtained a bachelor's degree or higher.
| Field of Study | # Graduates | % Graduates |
| Computers & Mathematics | 0 | 0.0% |
| Bio, Nature & Agricultural | 12 | 4.1% |
| Physical & Health Sciences | 23 | 7.8% |
| Psychology | 12 | 4.1% |
| Social Sciences | 0 | 0.0% |
| Engineering | 0 | 0.0% |
| Multidisciplinary Studies | 0 | 0.0% |
| Science & Technology | 36 | 12.2% |
| Business | 47 | 16.0% |
| Education | 98 | 33.3% |
| Literature & Languages | 0 | 0.0% |
| Liberal Arts & History | 5 | 1.7% |
| Visual & Performing Arts | 9 | 3.1% |
| Communications | 9 | 3.1% |
| Arts & Humanities | 43 | 14.6% |
| Total | 294 | 100.0% |
Transportation & Commute in Atoka
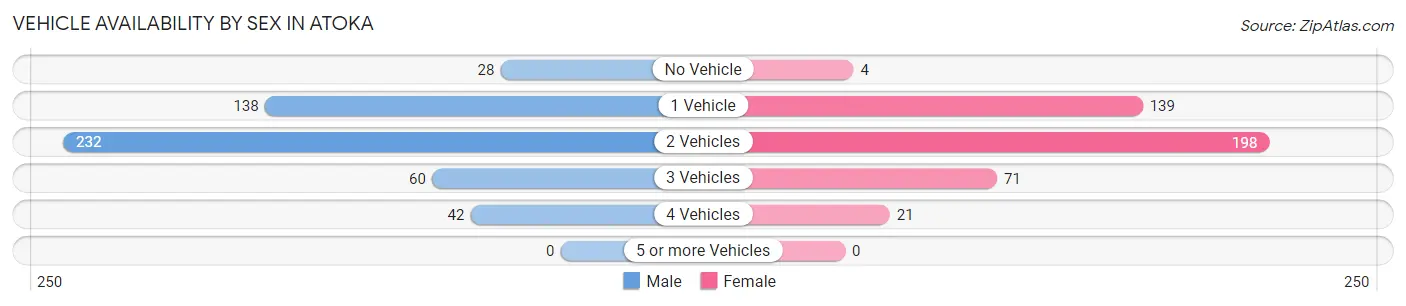
Vehicle Availability by Sex in Atoka
The most prevalent vehicle ownership categories in Atoka are males with 2 vehicles (232, accounting for 46.4%) and females with 2 vehicles (198, making up 53.6%).
| Vehicles Available | Male | Female |
| No Vehicle | 28 (5.6%) | 4 (0.9%) |
| 1 Vehicle | 138 (27.6%) | 139 (32.1%) |
| 2 Vehicles | 232 (46.4%) | 198 (45.7%) |
| 3 Vehicles | 60 (12.0%) | 71 (16.4%) |
| 4 Vehicles | 42 (8.4%) | 21 (4.9%) |
| 5 or more Vehicles | 0 (0.0%) | 0 (0.0%) |
| Total | 500 (100.0%) | 433 (100.0%) |
Commute Time in Atoka
The most frequently occuring commute durations in Atoka are 5 to 9 minutes (305 commuters, 33.9%), 10 to 14 minutes (130 commuters, 14.4%), and less than 5 minutes (122 commuters, 13.6%).
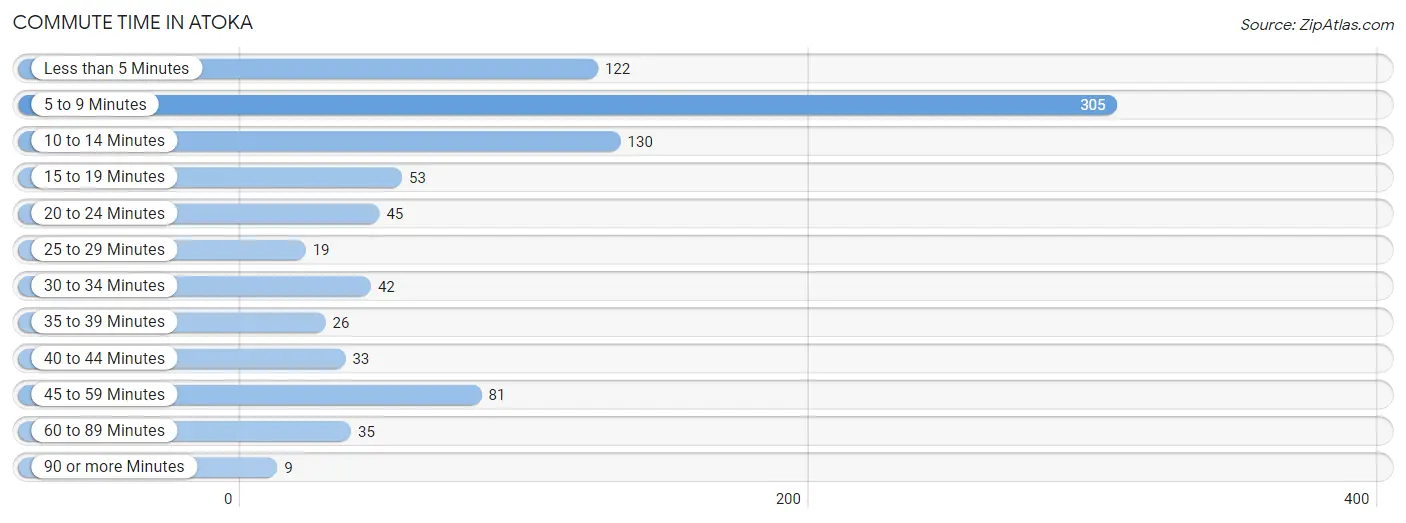
| Commute Time | # Commuters | % Commuters |
| Less than 5 Minutes | 122 | 13.6% |
| 5 to 9 Minutes | 305 | 33.9% |
| 10 to 14 Minutes | 130 | 14.4% |
| 15 to 19 Minutes | 53 | 5.9% |
| 20 to 24 Minutes | 45 | 5.0% |
| 25 to 29 Minutes | 19 | 2.1% |
| 30 to 34 Minutes | 42 | 4.7% |
| 35 to 39 Minutes | 26 | 2.9% |
| 40 to 44 Minutes | 33 | 3.7% |
| 45 to 59 Minutes | 81 | 9.0% |
| 60 to 89 Minutes | 35 | 3.9% |
| 90 or more Minutes | 9 | 1.0% |
Commute Time by Sex in Atoka
The most common commute times in Atoka are 5 to 9 minutes (123 commuters, 26.1%) for males and 5 to 9 minutes (182 commuters, 42.5%) for females.
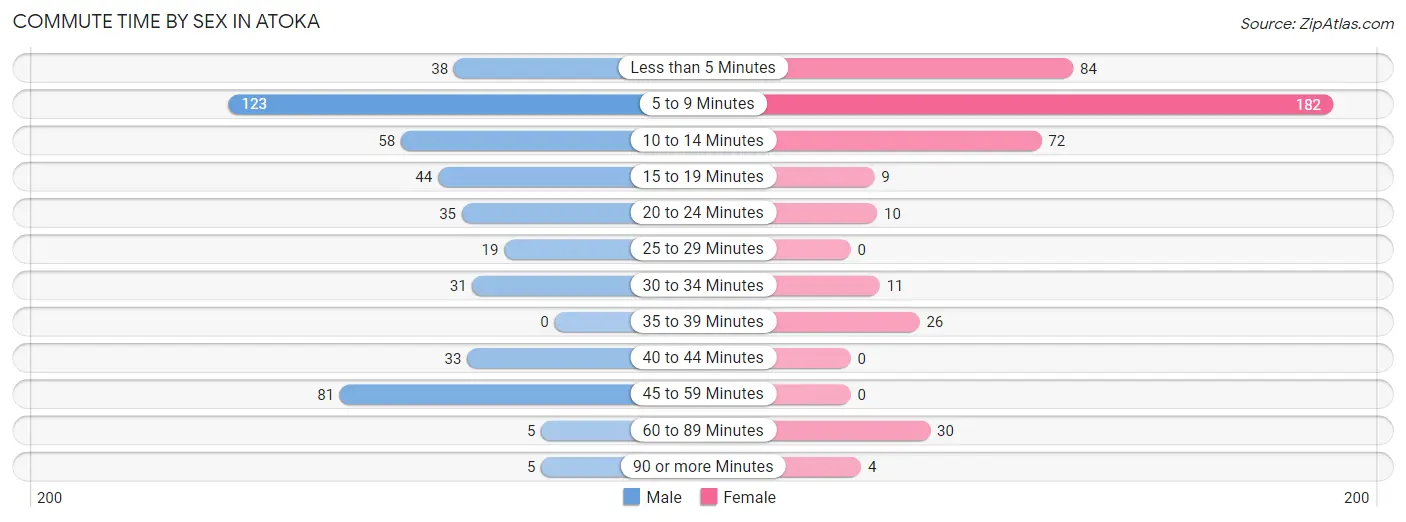
| Commute Time | Male | Female |
| Less than 5 Minutes | 38 (8.1%) | 84 (19.6%) |
| 5 to 9 Minutes | 123 (26.1%) | 182 (42.5%) |
| 10 to 14 Minutes | 58 (12.3%) | 72 (16.8%) |
| 15 to 19 Minutes | 44 (9.3%) | 9 (2.1%) |
| 20 to 24 Minutes | 35 (7.4%) | 10 (2.3%) |
| 25 to 29 Minutes | 19 (4.0%) | 0 (0.0%) |
| 30 to 34 Minutes | 31 (6.6%) | 11 (2.6%) |
| 35 to 39 Minutes | 0 (0.0%) | 26 (6.1%) |
| 40 to 44 Minutes | 33 (7.0%) | 0 (0.0%) |
| 45 to 59 Minutes | 81 (17.2%) | 0 (0.0%) |
| 60 to 89 Minutes | 5 (1.1%) | 30 (7.0%) |
| 90 or more Minutes | 5 (1.1%) | 4 (0.9%) |
Time of Departure to Work by Sex in Atoka
The most frequent times of departure to work in Atoka are 7:00 AM to 7:29 AM (79, 16.7%) for males and 7:00 AM to 7:29 AM (97, 22.7%) for females.
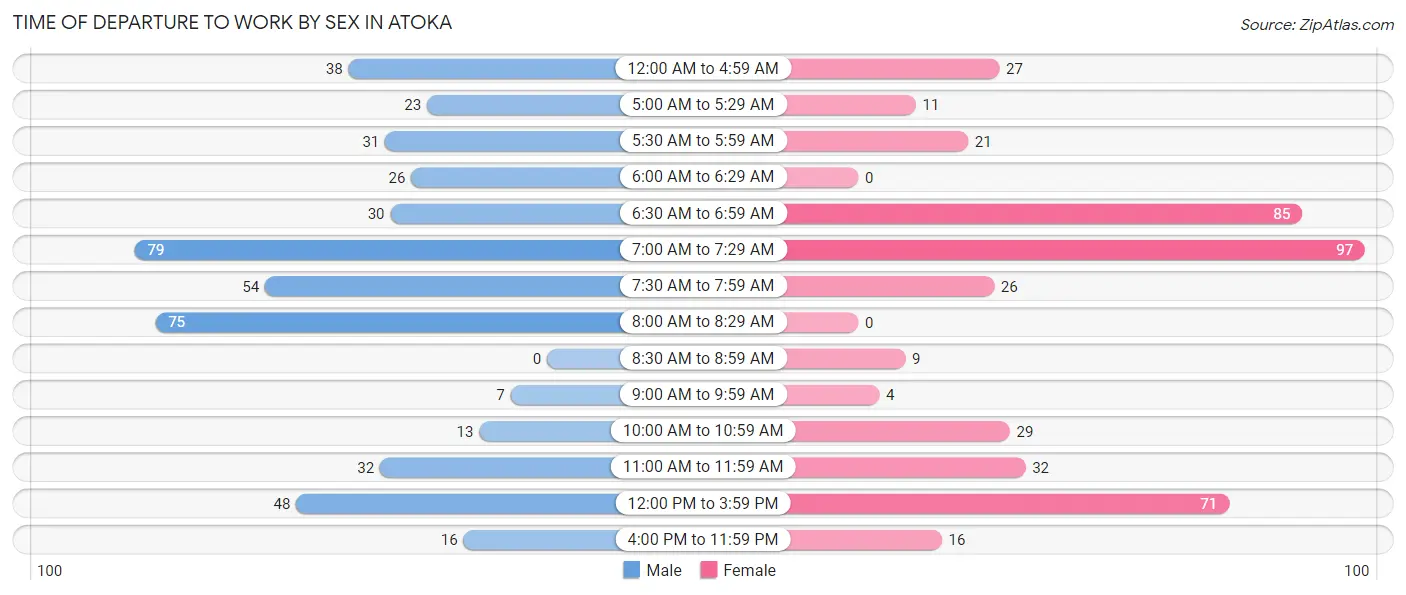
| Time of Departure | Male | Female |
| 12:00 AM to 4:59 AM | 38 (8.1%) | 27 (6.3%) |
| 5:00 AM to 5:29 AM | 23 (4.9%) | 11 (2.6%) |
| 5:30 AM to 5:59 AM | 31 (6.6%) | 21 (4.9%) |
| 6:00 AM to 6:29 AM | 26 (5.5%) | 0 (0.0%) |
| 6:30 AM to 6:59 AM | 30 (6.4%) | 85 (19.9%) |
| 7:00 AM to 7:29 AM | 79 (16.7%) | 97 (22.7%) |
| 7:30 AM to 7:59 AM | 54 (11.4%) | 26 (6.1%) |
| 8:00 AM to 8:29 AM | 75 (15.9%) | 0 (0.0%) |
| 8:30 AM to 8:59 AM | 0 (0.0%) | 9 (2.1%) |
| 9:00 AM to 9:59 AM | 7 (1.5%) | 4 (0.9%) |
| 10:00 AM to 10:59 AM | 13 (2.8%) | 29 (6.8%) |
| 11:00 AM to 11:59 AM | 32 (6.8%) | 32 (7.5%) |
| 12:00 PM to 3:59 PM | 48 (10.2%) | 71 (16.6%) |
| 4:00 PM to 11:59 PM | 16 (3.4%) | 16 (3.7%) |
| Total | 472 (100.0%) | 428 (100.0%) |
Housing Occupancy in Atoka
Occupancy by Ownership in Atoka
Of the total 1,052 dwellings in Atoka, owner-occupied units account for 640 (60.8%), while renter-occupied units make up 412 (39.2%).
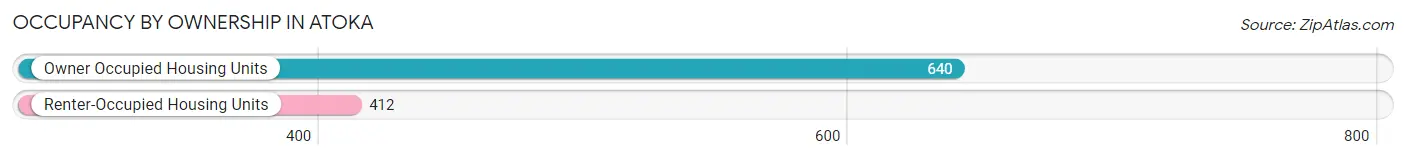
| Occupancy | # Housing Units | % Housing Units |
| Owner Occupied Housing Units | 640 | 60.8% |
| Renter-Occupied Housing Units | 412 | 39.2% |
| Total Occupied Housing Units | 1,052 | 100.0% |
Occupancy by Household Size in Atoka
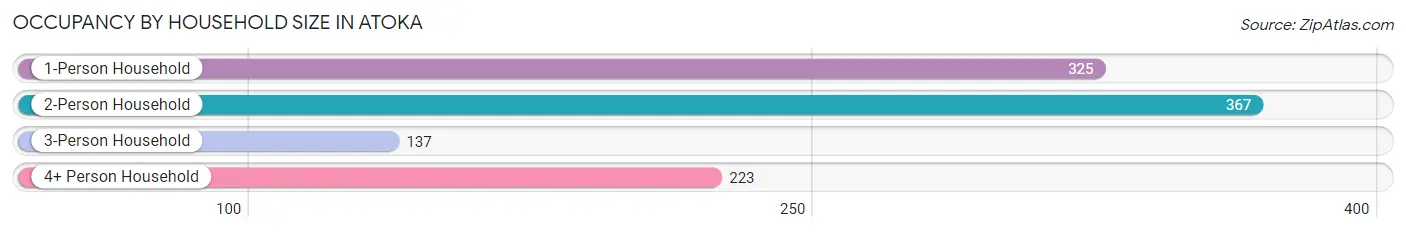
| Household Size | # Housing Units | % Housing Units |
| 1-Person Household | 325 | 30.9% |
| 2-Person Household | 367 | 34.9% |
| 3-Person Household | 137 | 13.0% |
| 4+ Person Household | 223 | 21.2% |
| Total Housing Units | 1,052 | 100.0% |
Occupancy by Ownership by Household Size in Atoka
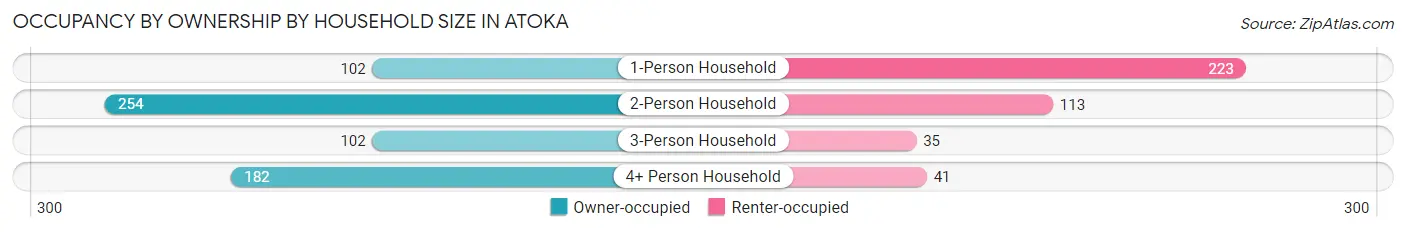
| Household Size | Owner-occupied | Renter-occupied |
| 1-Person Household | 102 (31.4%) | 223 (68.6%) |
| 2-Person Household | 254 (69.2%) | 113 (30.8%) |
| 3-Person Household | 102 (74.5%) | 35 (25.6%) |
| 4+ Person Household | 182 (81.6%) | 41 (18.4%) |
| Total Housing Units | 640 (60.8%) | 412 (39.2%) |
Occupancy by Educational Attainment in Atoka
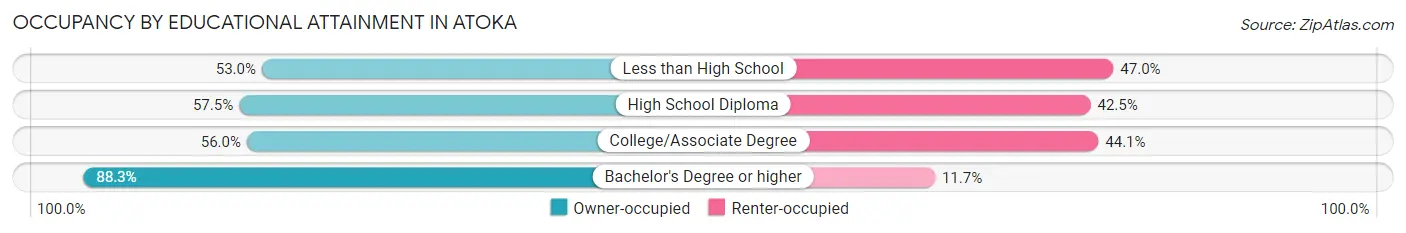
| Household Size | Owner-occupied | Renter-occupied |
| Less than High School | 116 (53.0%) | 103 (47.0%) |
| High School Diploma | 192 (57.5%) | 142 (42.5%) |
| College/Associate Degree | 188 (55.9%) | 148 (44.1%) |
| Bachelor's Degree or higher | 144 (88.3%) | 19 (11.7%) |
Occupancy by Age of Householder in Atoka
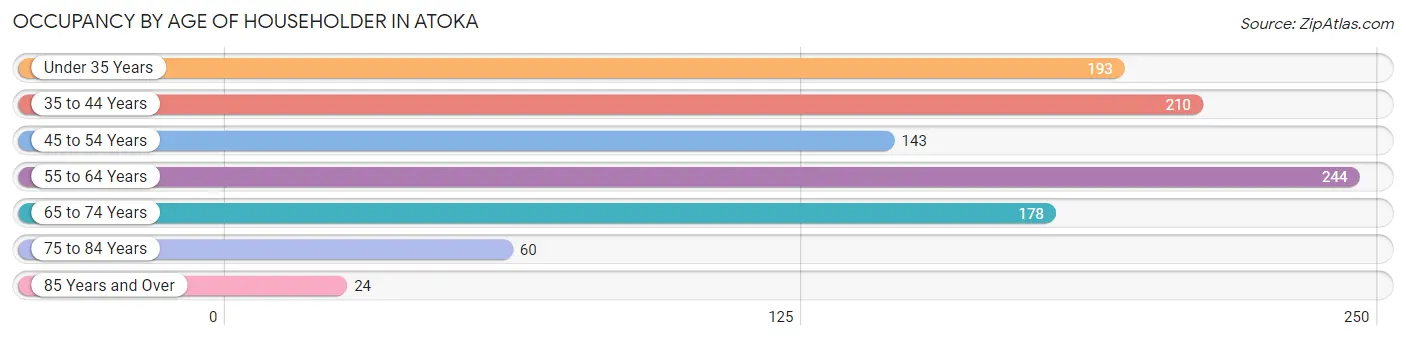
| Age Bracket | # Households | % Households |
| Under 35 Years | 193 | 18.3% |
| 35 to 44 Years | 210 | 20.0% |
| 45 to 54 Years | 143 | 13.6% |
| 55 to 64 Years | 244 | 23.2% |
| 65 to 74 Years | 178 | 16.9% |
| 75 to 84 Years | 60 | 5.7% |
| 85 Years and Over | 24 | 2.3% |
| Total | 1,052 | 100.0% |
Housing Finances in Atoka
Median Income by Occupancy in Atoka
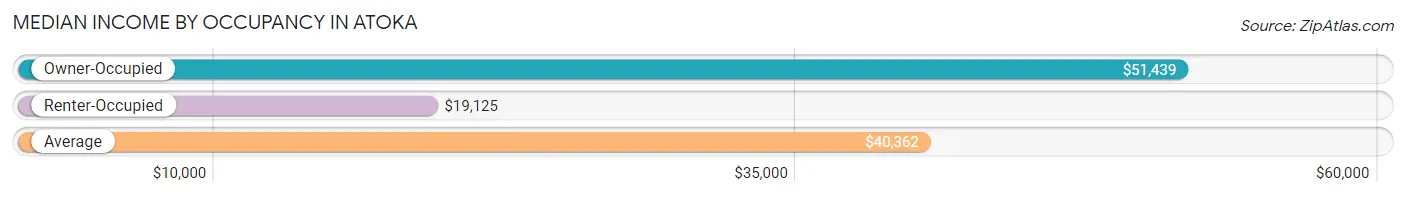
| Occupancy Type | # Households | Median Income |
| Owner-Occupied | 640 (60.8%) | $51,439 |
| Renter-Occupied | 412 (39.2%) | $19,125 |
| Average | 1,052 (100.0%) | $40,362 |
Occupancy by Householder Income Bracket in Atoka
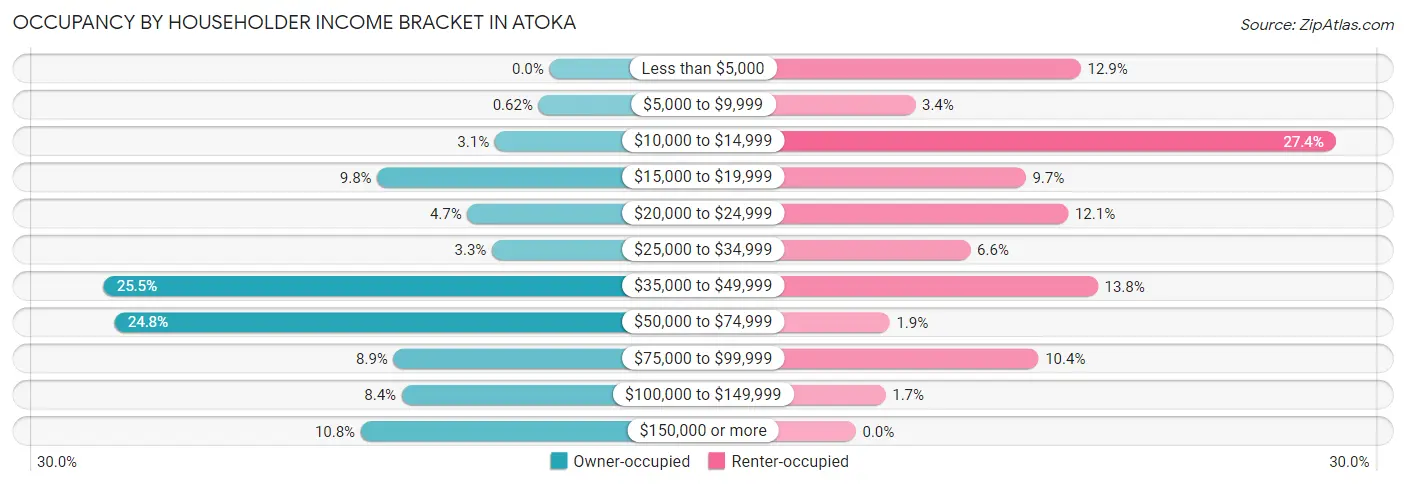
| Income Bracket | Owner-occupied | Renter-occupied |
| Less than $5,000 | 0 (0.0%) | 53 (12.9%) |
| $5,000 to $9,999 | 4 (0.6%) | 14 (3.4%) |
| $10,000 to $14,999 | 20 (3.1%) | 113 (27.4%) |
| $15,000 to $19,999 | 63 (9.8%) | 40 (9.7%) |
| $20,000 to $24,999 | 30 (4.7%) | 50 (12.1%) |
| $25,000 to $34,999 | 21 (3.3%) | 27 (6.6%) |
| $35,000 to $49,999 | 163 (25.5%) | 57 (13.8%) |
| $50,000 to $74,999 | 159 (24.8%) | 8 (1.9%) |
| $75,000 to $99,999 | 57 (8.9%) | 43 (10.4%) |
| $100,000 to $149,999 | 54 (8.4%) | 7 (1.7%) |
| $150,000 or more | 69 (10.8%) | 0 (0.0%) |
| Total | 640 (100.0%) | 412 (100.0%) |
Monthly Housing Cost Tiers in Atoka
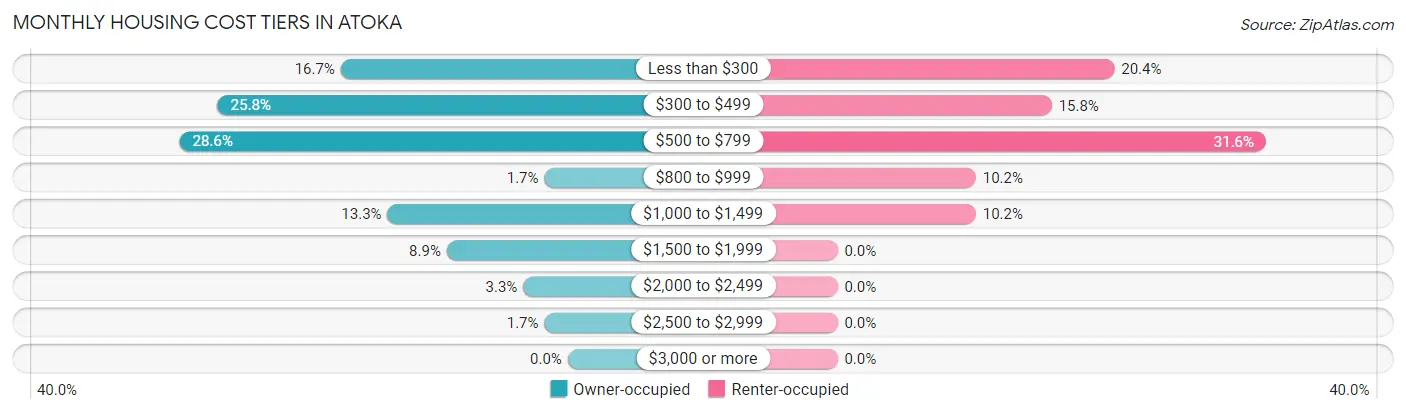
| Monthly Cost | Owner-occupied | Renter-occupied |
| Less than $300 | 107 (16.7%) | 84 (20.4%) |
| $300 to $499 | 165 (25.8%) | 65 (15.8%) |
| $500 to $799 | 183 (28.6%) | 130 (31.6%) |
| $800 to $999 | 11 (1.7%) | 42 (10.2%) |
| $1,000 to $1,499 | 85 (13.3%) | 42 (10.2%) |
| $1,500 to $1,999 | 57 (8.9%) | 0 (0.0%) |
| $2,000 to $2,499 | 21 (3.3%) | 0 (0.0%) |
| $2,500 to $2,999 | 11 (1.7%) | 0 (0.0%) |
| $3,000 or more | 0 (0.0%) | 0 (0.0%) |
| Total | 640 (100.0%) | 412 (100.0%) |
Physical Housing Characteristics in Atoka
Housing Structures in Atoka
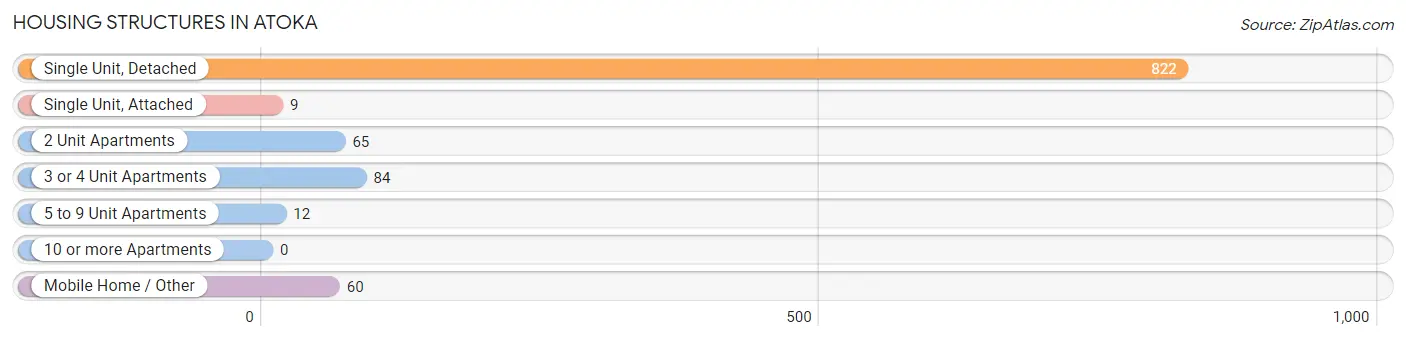
| Structure Type | # Housing Units | % Housing Units |
| Single Unit, Detached | 822 | 78.1% |
| Single Unit, Attached | 9 | 0.9% |
| 2 Unit Apartments | 65 | 6.2% |
| 3 or 4 Unit Apartments | 84 | 8.0% |
| 5 to 9 Unit Apartments | 12 | 1.1% |
| 10 or more Apartments | 0 | 0.0% |
| Mobile Home / Other | 60 | 5.7% |
| Total | 1,052 | 100.0% |
Housing Structures by Occupancy in Atoka
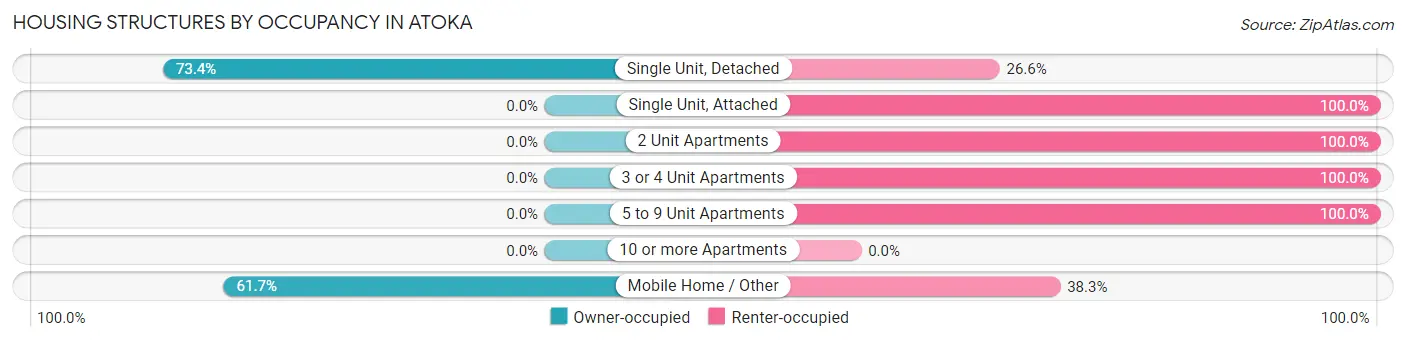
| Structure Type | Owner-occupied | Renter-occupied |
| Single Unit, Detached | 603 (73.4%) | 219 (26.6%) |
| Single Unit, Attached | 0 (0.0%) | 9 (100.0%) |
| 2 Unit Apartments | 0 (0.0%) | 65 (100.0%) |
| 3 or 4 Unit Apartments | 0 (0.0%) | 84 (100.0%) |
| 5 to 9 Unit Apartments | 0 (0.0%) | 12 (100.0%) |
| 10 or more Apartments | 0 (0.0%) | 0 (0.0%) |
| Mobile Home / Other | 37 (61.7%) | 23 (38.3%) |
| Total | 640 (60.8%) | 412 (39.2%) |
Housing Structures by Number of Rooms in Atoka
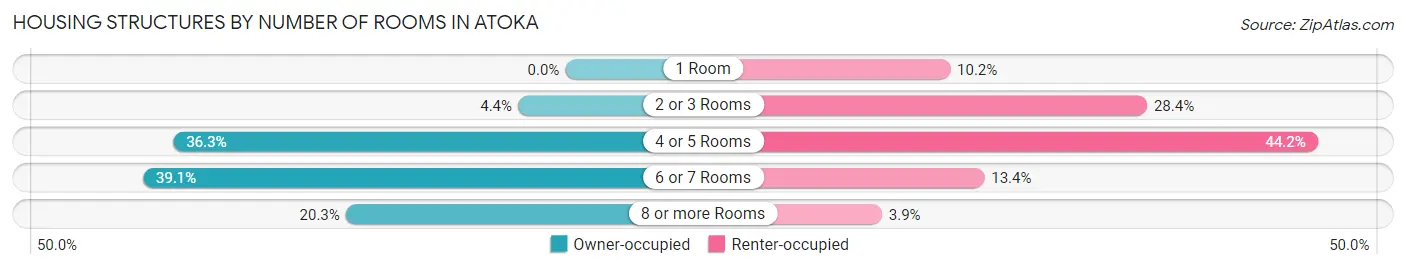
| Number of Rooms | Owner-occupied | Renter-occupied |
| 1 Room | 0 (0.0%) | 42 (10.2%) |
| 2 or 3 Rooms | 28 (4.4%) | 117 (28.4%) |
| 4 or 5 Rooms | 232 (36.2%) | 182 (44.2%) |
| 6 or 7 Rooms | 250 (39.1%) | 55 (13.4%) |
| 8 or more Rooms | 130 (20.3%) | 16 (3.9%) |
| Total | 640 (100.0%) | 412 (100.0%) |
Housing Structure by Heating Type in Atoka
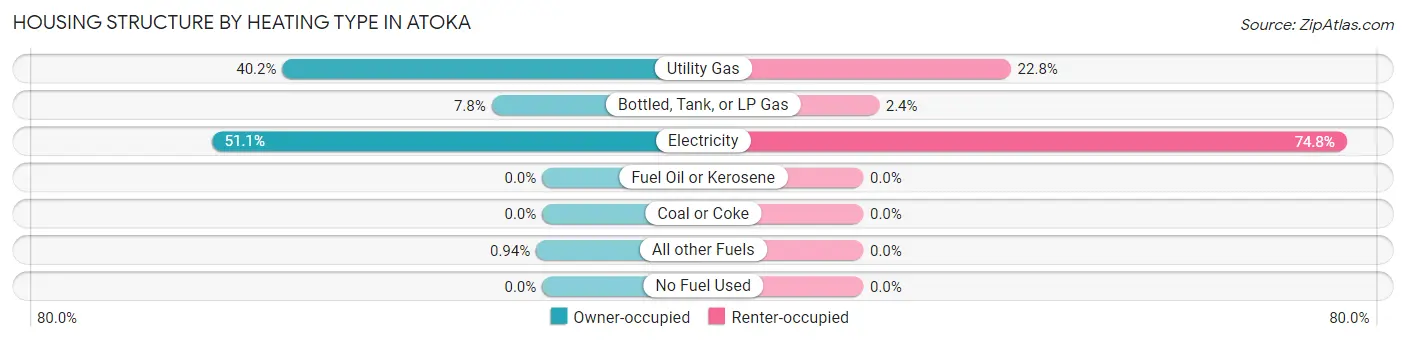
| Heating Type | Owner-occupied | Renter-occupied |
| Utility Gas | 257 (40.2%) | 94 (22.8%) |
| Bottled, Tank, or LP Gas | 50 (7.8%) | 10 (2.4%) |
| Electricity | 327 (51.1%) | 308 (74.8%) |
| Fuel Oil or Kerosene | 0 (0.0%) | 0 (0.0%) |
| Coal or Coke | 0 (0.0%) | 0 (0.0%) |
| All other Fuels | 6 (0.9%) | 0 (0.0%) |
| No Fuel Used | 0 (0.0%) | 0 (0.0%) |
| Total | 640 (100.0%) | 412 (100.0%) |
Household Vehicle Usage in Atoka
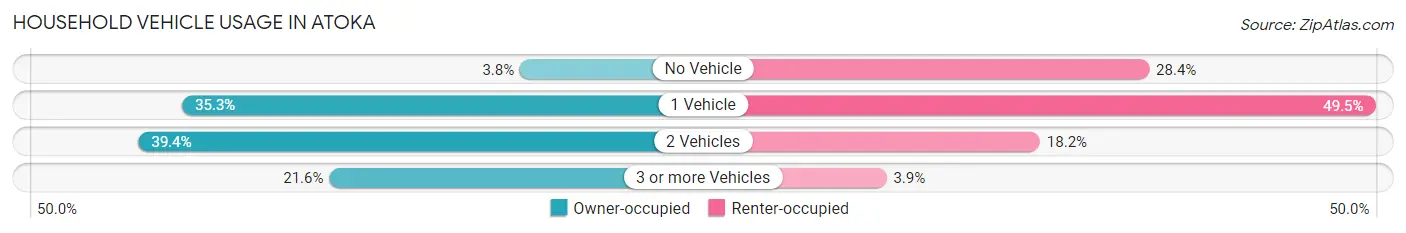
| Vehicles per Household | Owner-occupied | Renter-occupied |
| No Vehicle | 24 (3.7%) | 117 (28.4%) |
| 1 Vehicle | 226 (35.3%) | 204 (49.5%) |
| 2 Vehicles | 252 (39.4%) | 75 (18.2%) |
| 3 or more Vehicles | 138 (21.6%) | 16 (3.9%) |
| Total | 640 (100.0%) | 412 (100.0%) |
Real Estate & Mortgages in Atoka
Real Estate and Mortgage Overview in Atoka
| Characteristic | Without Mortgage | With Mortgage |
| Housing Units | 386 | 254 |
| Median Property Value | $89,000 | $121,100 |
| Median Household Income | $40,076 | $36 |
| Monthly Housing Costs | $399 | $0 |
| Real Estate Taxes | $518 | $26 |
Property Value by Mortgage Status in Atoka
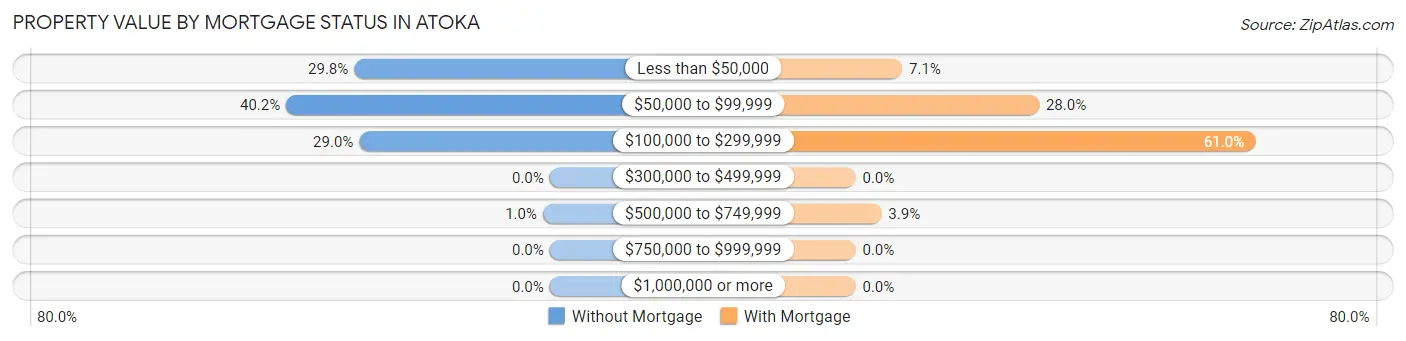
| Property Value | Without Mortgage | With Mortgage |
| Less than $50,000 | 115 (29.8%) | 18 (7.1%) |
| $50,000 to $99,999 | 155 (40.2%) | 71 (28.0%) |
| $100,000 to $299,999 | 112 (29.0%) | 155 (61.0%) |
| $300,000 to $499,999 | 0 (0.0%) | 0 (0.0%) |
| $500,000 to $749,999 | 4 (1.0%) | 10 (3.9%) |
| $750,000 to $999,999 | 0 (0.0%) | 0 (0.0%) |
| $1,000,000 or more | 0 (0.0%) | 0 (0.0%) |
| Total | 386 (100.0%) | 254 (100.0%) |
Household Income by Mortgage Status in Atoka
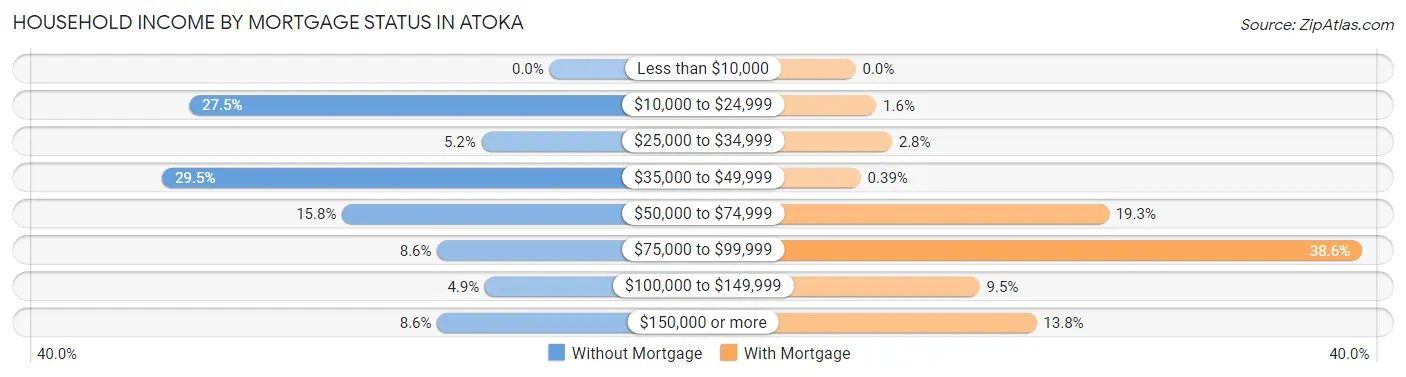
| Household Income | Without Mortgage | With Mortgage |
| Less than $10,000 | 0 (0.0%) | 0 (0.0%) |
| $10,000 to $24,999 | 106 (27.5%) | 4 (1.6%) |
| $25,000 to $34,999 | 20 (5.2%) | 7 (2.8%) |
| $35,000 to $49,999 | 114 (29.5%) | 1 (0.4%) |
| $50,000 to $74,999 | 61 (15.8%) | 49 (19.3%) |
| $75,000 to $99,999 | 33 (8.6%) | 98 (38.6%) |
| $100,000 to $149,999 | 19 (4.9%) | 24 (9.5%) |
| $150,000 or more | 33 (8.6%) | 35 (13.8%) |
| Total | 386 (100.0%) | 254 (100.0%) |
Property Value to Household Income Ratio in Atoka
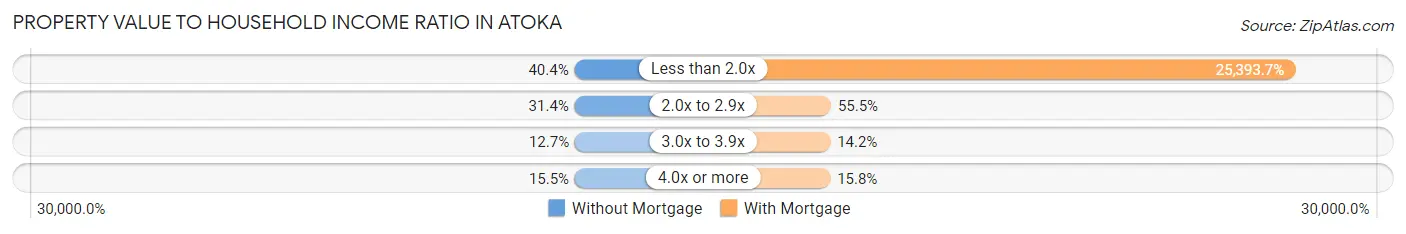
| Value-to-Income Ratio | Without Mortgage | With Mortgage |
| Less than 2.0x | 156 (40.4%) | 64,500 (25,393.7%) |
| 2.0x to 2.9x | 121 (31.4%) | 141 (55.5%) |
| 3.0x to 3.9x | 49 (12.7%) | 36 (14.2%) |
| 4.0x or more | 60 (15.5%) | 40 (15.8%) |
| Total | 386 (100.0%) | 254 (100.0%) |
Real Estate Taxes by Mortgage Status in Atoka
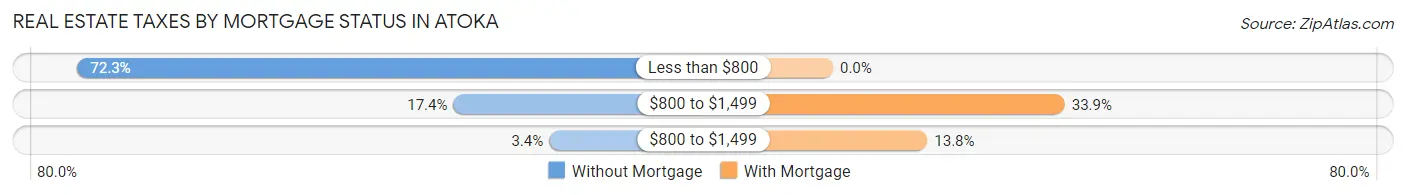
| Property Taxes | Without Mortgage | With Mortgage |
| Less than $800 | 279 (72.3%) | 0 (0.0%) |
| $800 to $1,499 | 67 (17.4%) | 86 (33.9%) |
| $800 to $1,499 | 13 (3.4%) | 35 (13.8%) |
| Total | 386 (100.0%) | 254 (100.0%) |
Health & Disability in Atoka
Health Insurance Coverage by Age in Atoka
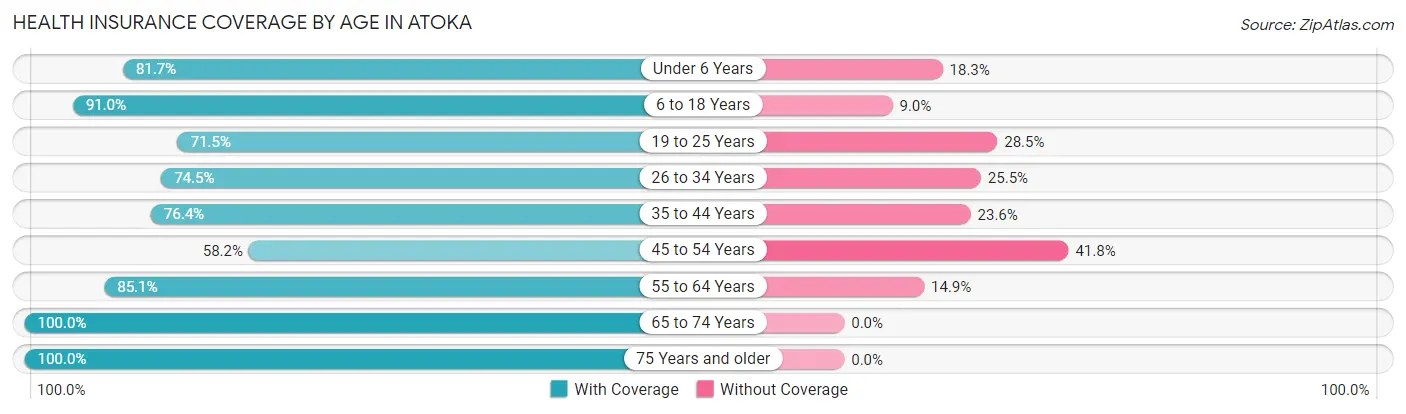
| Age Bracket | With Coverage | Without Coverage |
| Under 6 Years | 196 (81.7%) | 44 (18.3%) |
| 6 to 18 Years | 597 (91.0%) | 59 (9.0%) |
| 19 to 25 Years | 233 (71.5%) | 93 (28.5%) |
| 26 to 34 Years | 193 (74.5%) | 66 (25.5%) |
| 35 to 44 Years | 305 (76.4%) | 94 (23.6%) |
| 45 to 54 Years | 167 (58.2%) | 120 (41.8%) |
| 55 to 64 Years | 372 (85.1%) | 65 (14.9%) |
| 65 to 74 Years | 239 (100.0%) | 0 (0.0%) |
| 75 Years and older | 220 (100.0%) | 0 (0.0%) |
| Total | 2,522 (82.3%) | 541 (17.7%) |
Health Insurance Coverage by Citizenship Status in Atoka
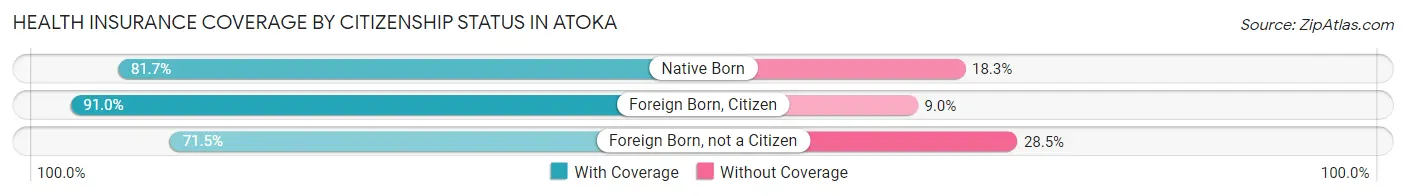
| Citizenship Status | With Coverage | Without Coverage |
| Native Born | 196 (81.7%) | 44 (18.3%) |
| Foreign Born, Citizen | 597 (91.0%) | 59 (9.0%) |
| Foreign Born, not a Citizen | 233 (71.5%) | 93 (28.5%) |
Health Insurance Coverage by Household Income in Atoka
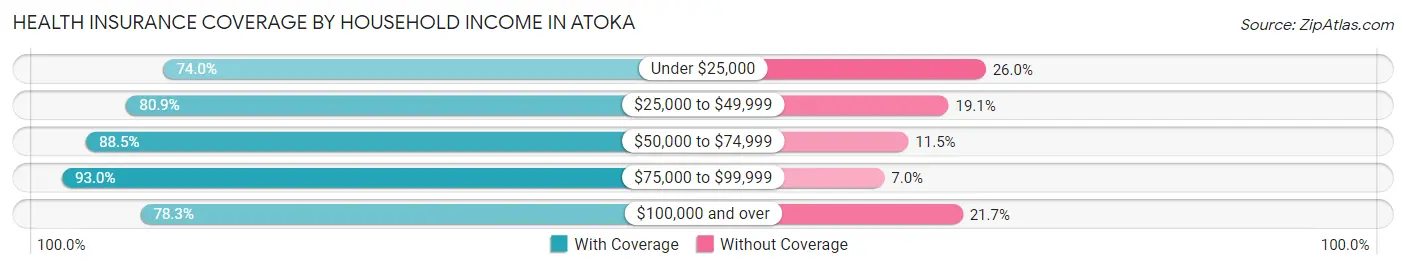
| Household Income | With Coverage | Without Coverage |
| Under $25,000 | 520 (74.0%) | 183 (26.0%) |
| $25,000 to $49,999 | 577 (80.9%) | 136 (19.1%) |
| $50,000 to $74,999 | 544 (88.5%) | 71 (11.5%) |
| $75,000 to $99,999 | 463 (93.0%) | 35 (7.0%) |
| $100,000 and over | 418 (78.3%) | 116 (21.7%) |
Public vs Private Health Insurance Coverage by Age in Atoka
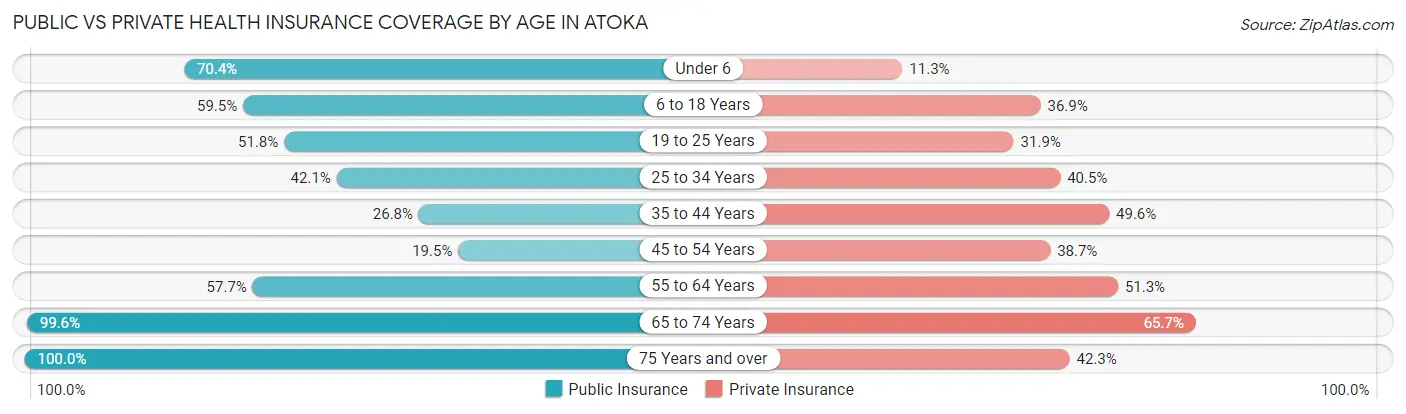
| Age Bracket | Public Insurance | Private Insurance |
| Under 6 | 169 (70.4%) | 27 (11.3%) |
| 6 to 18 Years | 390 (59.5%) | 242 (36.9%) |
| 19 to 25 Years | 169 (51.8%) | 104 (31.9%) |
| 25 to 34 Years | 109 (42.1%) | 105 (40.5%) |
| 35 to 44 Years | 107 (26.8%) | 198 (49.6%) |
| 45 to 54 Years | 56 (19.5%) | 111 (38.7%) |
| 55 to 64 Years | 252 (57.7%) | 224 (51.3%) |
| 65 to 74 Years | 238 (99.6%) | 157 (65.7%) |
| 75 Years and over | 220 (100.0%) | 93 (42.3%) |
| Total | 1,710 (55.8%) | 1,261 (41.2%) |
Disability Status by Sex by Age in Atoka
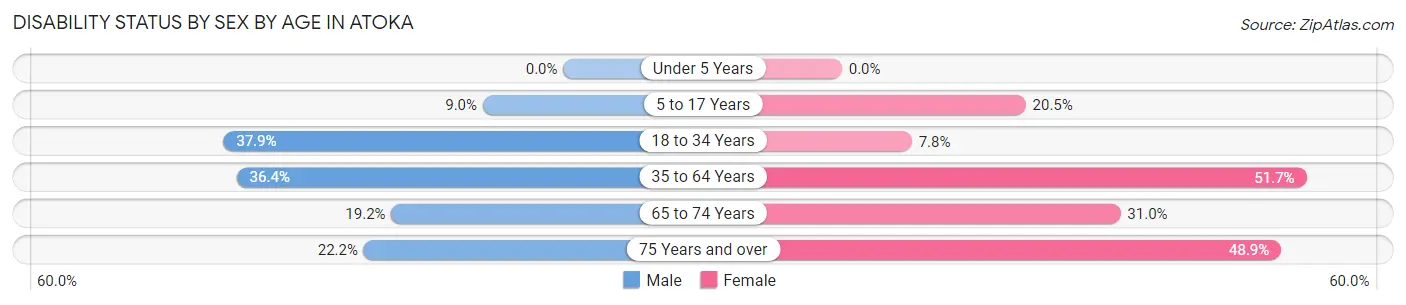
| Age Bracket | Male | Female |
| Under 5 Years | 0 (0.0%) | 0 (0.0%) |
| 5 to 17 Years | 42 (9.0%) | 44 (20.5%) |
| 18 to 34 Years | 128 (37.9%) | 24 (7.8%) |
| 35 to 64 Years | 199 (36.4%) | 298 (51.7%) |
| 65 to 74 Years | 18 (19.2%) | 45 (31.0%) |
| 75 Years and over | 18 (22.2%) | 68 (48.9%) |
Disability Class by Sex by Age in Atoka
Disability Class: Hearing Difficulty
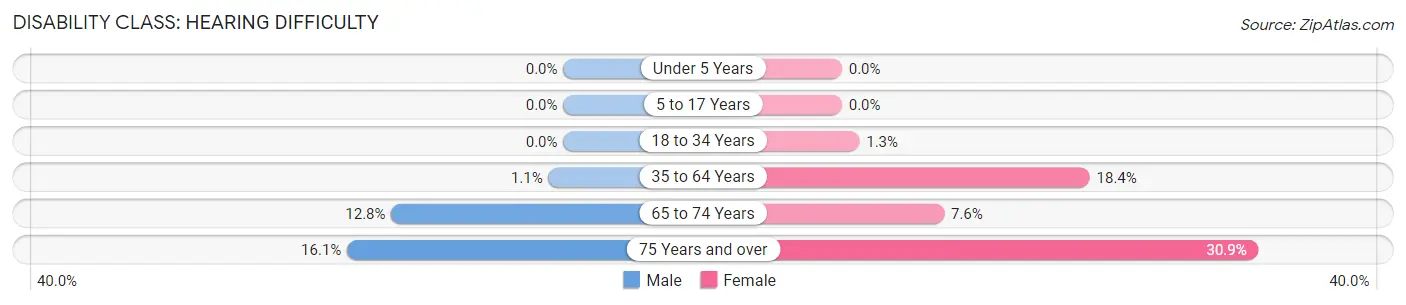
| Age Bracket | Male | Female |
| Under 5 Years | 0 (0.0%) | 0 (0.0%) |
| 5 to 17 Years | 0 (0.0%) | 0 (0.0%) |
| 18 to 34 Years | 0 (0.0%) | 4 (1.3%) |
| 35 to 64 Years | 6 (1.1%) | 106 (18.4%) |
| 65 to 74 Years | 12 (12.8%) | 11 (7.6%) |
| 75 Years and over | 13 (16.1%) | 43 (30.9%) |
Disability Class: Vision Difficulty
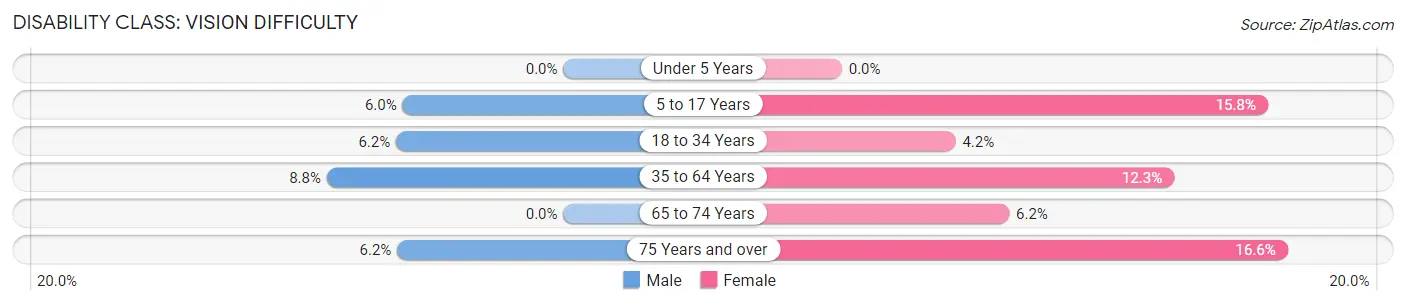
| Age Bracket | Male | Female |
| Under 5 Years | 0 (0.0%) | 0 (0.0%) |
| 5 to 17 Years | 28 (6.0%) | 34 (15.8%) |
| 18 to 34 Years | 21 (6.2%) | 13 (4.2%) |
| 35 to 64 Years | 48 (8.8%) | 71 (12.3%) |
| 65 to 74 Years | 0 (0.0%) | 9 (6.2%) |
| 75 Years and over | 5 (6.2%) | 23 (16.6%) |
Disability Class: Cognitive Difficulty
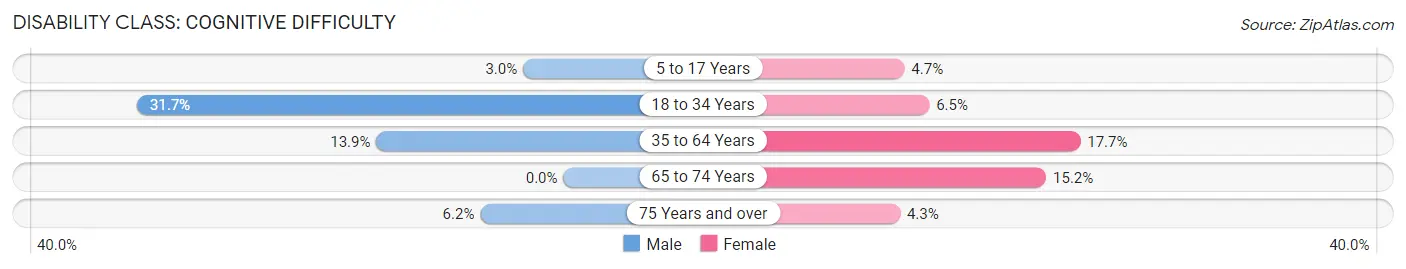
| Age Bracket | Male | Female |
| 5 to 17 Years | 14 (3.0%) | 10 (4.6%) |
| 18 to 34 Years | 107 (31.7%) | 20 (6.5%) |
| 35 to 64 Years | 76 (13.9%) | 102 (17.7%) |
| 65 to 74 Years | 0 (0.0%) | 22 (15.2%) |
| 75 Years and over | 5 (6.2%) | 6 (4.3%) |
Disability Class: Ambulatory Difficulty
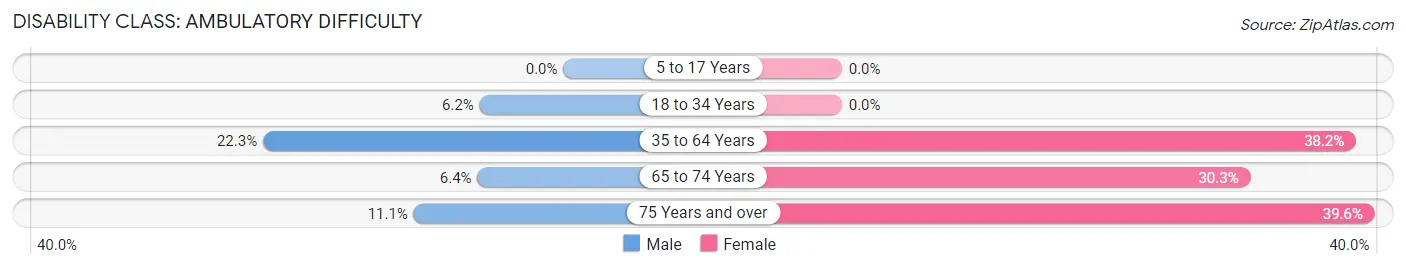
| Age Bracket | Male | Female |
| 5 to 17 Years | 0 (0.0%) | 0 (0.0%) |
| 18 to 34 Years | 21 (6.2%) | 0 (0.0%) |
| 35 to 64 Years | 122 (22.3%) | 220 (38.2%) |
| 65 to 74 Years | 6 (6.4%) | 44 (30.3%) |
| 75 Years and over | 9 (11.1%) | 55 (39.6%) |
Disability Class: Self-Care Difficulty
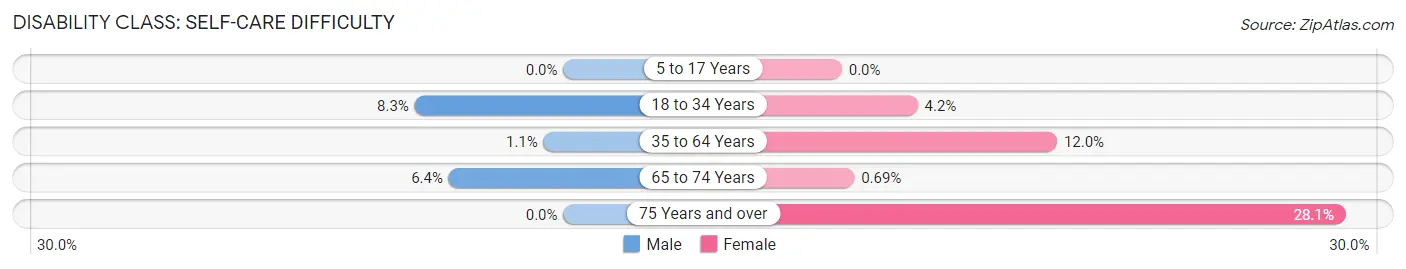
| Age Bracket | Male | Female |
| 5 to 17 Years | 0 (0.0%) | 0 (0.0%) |
| 18 to 34 Years | 28 (8.3%) | 13 (4.2%) |
| 35 to 64 Years | 6 (1.1%) | 69 (12.0%) |
| 65 to 74 Years | 6 (6.4%) | 1 (0.7%) |
| 75 Years and over | 0 (0.0%) | 39 (28.1%) |
Technology Access in Atoka
Computing Device Access in Atoka
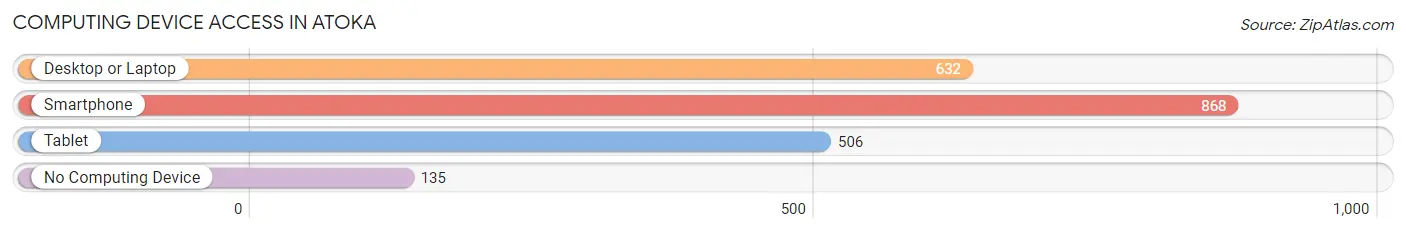
| Device Type | # Households | % Households |
| Desktop or Laptop | 632 | 60.1% |
| Smartphone | 868 | 82.5% |
| Tablet | 506 | 48.1% |
| No Computing Device | 135 | 12.8% |
| Total | 1,052 | 100.0% |
Internet Access in Atoka
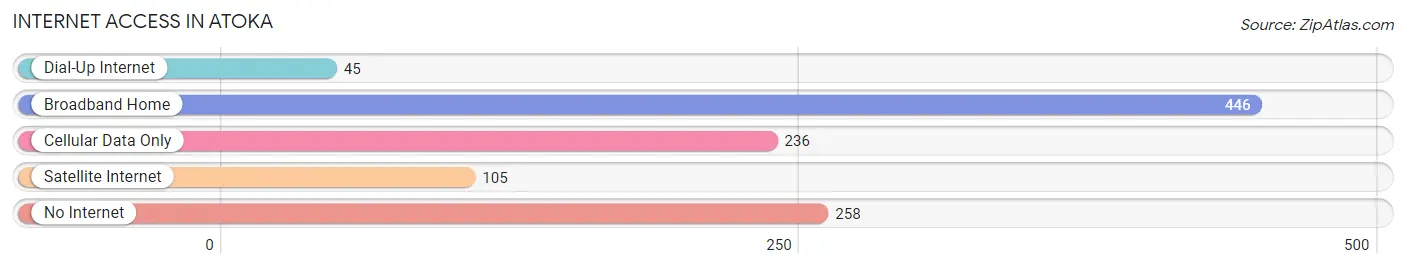
| Internet Type | # Households | % Households |
| Dial-Up Internet | 45 | 4.3% |
| Broadband Home | 446 | 42.4% |
| Cellular Data Only | 236 | 22.4% |
| Satellite Internet | 105 | 10.0% |
| No Internet | 258 | 24.5% |
| Total | 1,052 | 100.0% |
Atoka Summary
Atoka is a city located in southeastern Oklahoma, in the United States. It is the county seat of Atoka County, and is situated in the foothills of the Arbuckle Mountains. The city is located approximately 90 miles southeast of Oklahoma City, and is part of the Texoma region. As of the 2010 census, the population of Atoka was 3,107.
History
Atoka was founded in 1867 by the Choctaw Nation, and was named after Captain Atoka, a Choctaw leader. The city was originally a trading post, and was located along the Texas Road, which was a major route for settlers heading west. The city was incorporated in 1872, and was designated as the county seat of Atoka County in 1887.
In the late 19th century, Atoka was a major stop on the St. Louis and San Francisco Railway, and the city experienced a period of growth and prosperity. During this time, the city was home to several banks, hotels, and other businesses.
Atoka was also the site of a major battle during the Civil War. On April 9, 1864, Confederate forces led by General Stand Watie attacked Union forces led by General James Blunt. The battle, known as the Battle of Atoka, resulted in a Confederate victory.
Geography
Atoka is located in southeastern Oklahoma, in the foothills of the Arbuckle Mountains. The city is situated at the intersection of U.S. Route 69 and State Highway 3. The city is located approximately 90 miles southeast of Oklahoma City.
Atoka has a total area of 5.3 square miles, all of which is land. The city is located in a humid subtropical climate zone, and has hot, humid summers and mild winters. The average annual temperature is 64°F, and the average annual precipitation is 40 inches.
Economy
Atoka’s economy is largely based on agriculture and manufacturing. The city is home to several manufacturing companies, including Atoka Manufacturing, which produces industrial equipment, and Atoka Plastics, which produces plastic products.
The city is also home to several agricultural businesses, including Atoka Farms, which produces cotton, soybeans, and wheat, and Atoka Feed & Grain, which produces feed for livestock.
Demographics
As of the 2010 census, the population of Atoka was 3,107. The racial makeup of the city was 79.2% White, 15.2% Native American, 0.7% Asian, 0.2% African American, and 4.7% from other races. The median household income was $31,944, and the median family income was $37,917.
Atoka is home to several churches, including First Baptist Church, First United Methodist Church, and St. Joseph Catholic Church. The city is also home to Atoka Public Schools, which serves students in grades K-12.
Conclusion
Atoka is a city located in southeastern Oklahoma, in the United States. It is the county seat of Atoka County, and is situated in the foothills of the Arbuckle Mountains. The city was founded in 1867 by the Choctaw Nation, and was named after Captain Atoka, a Choctaw leader. Atoka’s economy is largely based on agriculture and manufacturing, and the city is home to several churches and schools. As of the 2010 census, the population of Atoka was 3,107.
Common Questions
What is Per Capita Income in Atoka?
Per Capita income in Atoka is $26,230.
What is the Median Family Income in Atoka?
Median Family Income in Atoka is $51,106.
What is the Median Household income in Atoka?
Median Household Income in Atoka is $40,362.
What is Income or Wage Gap in Atoka?
Income or Wage Gap in Atoka is 16.8%.
Women in Atoka earn 83.2 cents for every dollar earned by a man.
What is Inequality or Gini Index in Atoka?
Inequality or Gini Index in Atoka is 0.59.
What is the Total Population of Atoka?
Total Population of Atoka is 3,160.
What is the Total Male Population of Atoka?
Total Male Population of Atoka is 1,696.
What is the Total Female Population of Atoka?
Total Female Population of Atoka is 1,464.
What is the Ratio of Males per 100 Females in Atoka?
There are 115.85 Males per 100 Females in Atoka.
What is the Ratio of Females per 100 Males in Atoka?
There are 86.32 Females per 100 Males in Atoka.
What is the Median Population Age in Atoka?
Median Population Age in Atoka is 37.5 Years.
What is the Average Family Size in Atoka
Average Family Size in Atoka is 3.7 People.
What is the Average Household Size in Atoka
Average Household Size in Atoka is 2.9 People.
How Large is the Labor Force in Atoka?
There are 1,016 People in the Labor Forcein in Atoka.
What is the Percentage of People in the Labor Force in Atoka?
41.8% of People are in the Labor Force in Atoka.
What is the Unemployment Rate in Atoka?
Unemployment Rate in Atoka is 7.2%.