Cities with the Largest Vietnamese Community in the United States
RELATED REPORTS & OPTIONS
Vietnamese
United States
Compare Cities
Map of Cities with the Largest Vietnamese Community in the United States
0
100,000
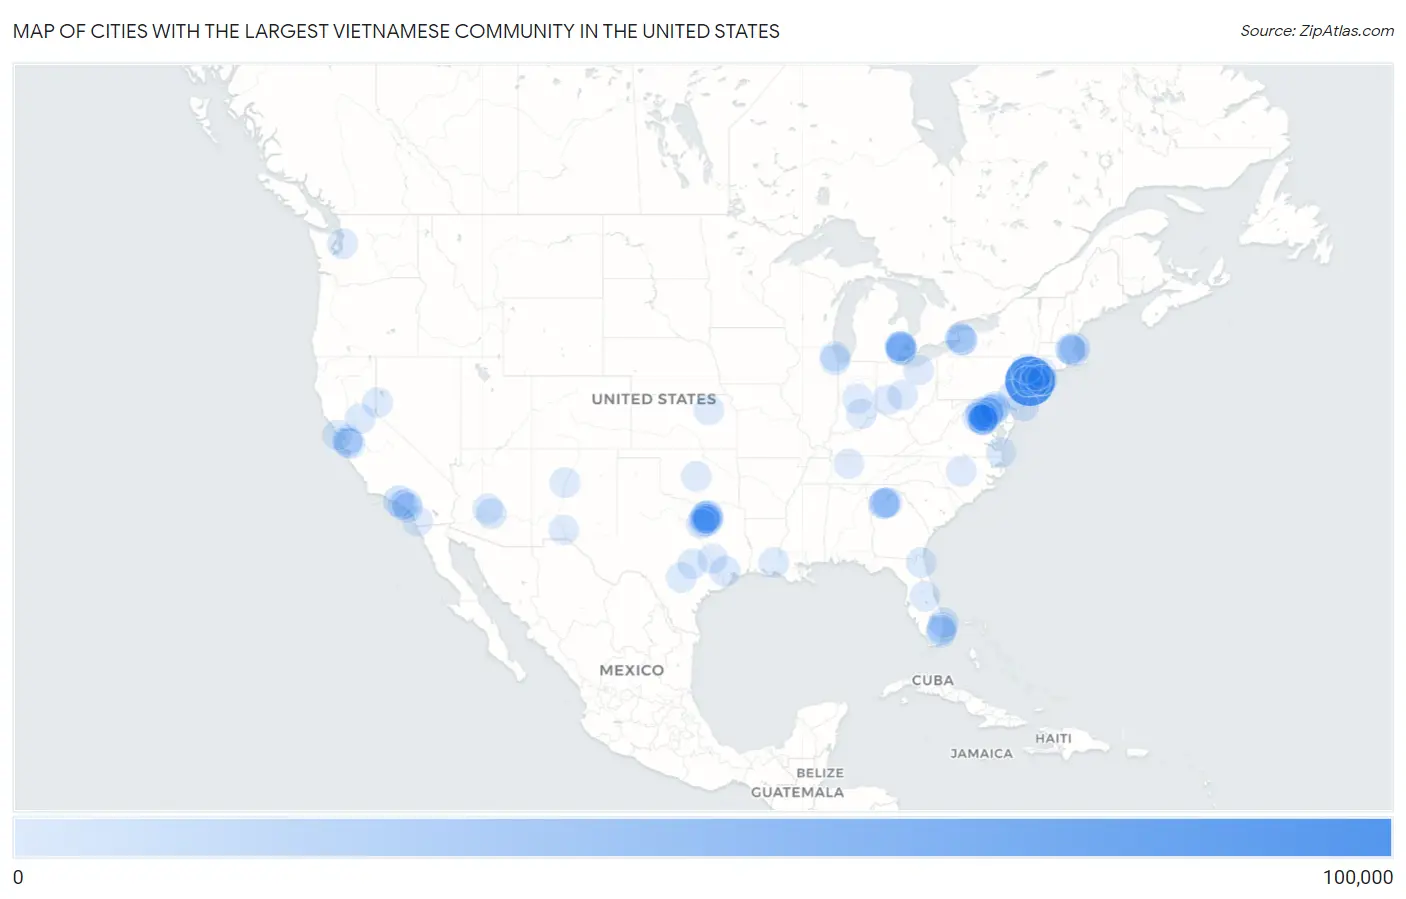
Cities with the Largest Vietnamese Community in the United States
| City | Vietnamese | vs State | vs National | |
| 1. | New York | 89,570 | 104,928(85.36%)#1 | 235,353(38.06%)#1 |
| 2. | Hamtramck | 4,849 | 15,306(31.68%)#1 | 235,353(2.06%)#2 |
| 3. | Los Angeles | 4,789 | 16,014(29.91%)#1 | 235,353(2.03%)#3 |
| 4. | Warren | 3,663 | 15,306(23.93%)#2 | 235,353(1.56%)#4 |
| 5. | Buffalo | 3,659 | 104,928(3.49%)#2 | 235,353(1.55%)#5 |
| 6. | Paterson | 3,606 | 11,503(31.35%)#1 | 235,353(1.53%)#6 |
| 7. | Detroit | 3,119 | 15,306(20.38%)#3 | 235,353(1.33%)#7 |
| 8. | Philadelphia | 2,046 | 7,121(28.73%)#1 | 235,353(0.87%)#8 |
| 9. | Houston | 1,412 | 13,488(10.47%)#1 | 235,353(0.60%)#9 |
| 10. | Chandler | 1,171 | 2,844(41.17%)#1 | 235,353(0.50%)#10 |
| 11. | Atlantic City | 1,099 | 11,503(9.55%)#2 | 235,353(0.47%)#11 |
| 12. | Woodbridge | 914 | 11,635(7.86%)#1 | 235,353(0.39%)#12 |
| 13. | Chicago | 903 | 2,849(31.70%)#1 | 235,353(0.38%)#13 |
| 14. | Plano | 853 | 13,488(6.32%)#2 | 235,353(0.36%)#14 |
| 15. | Anaheim | 848 | 16,014(5.30%)#2 | 235,353(0.36%)#15 |
| 16. | San Jose | 830 | 16,014(5.18%)#3 | 235,353(0.35%)#16 |
| 17. | Silver Spring | 761 | 6,036(12.61%)#1 | 235,353(0.32%)#17 |
| 18. | Lansdale Borough | 757 | 7,121(10.63%)#2 | 235,353(0.32%)#18 |
| 19. | Indianapolis | 736 | 1,725(42.67%)#1 | 235,353(0.31%)#19 |
| 20. | Oklahoma City | 731 | 1,304(56.06%)#1 | 235,353(0.31%)#20 |
| 21. | Arlington | 697 | 11,635(5.99%)#2 | 235,353(0.30%)#21 |
| 22. | Cary | 688 | 1,683(40.88%)#1 | 235,353(0.29%)#22 |
| 23. | Doraville | 683 | 6,794(10.05%)#1 | 235,353(0.29%)#23 |
| 24. | Mckinney | 682 | 13,488(5.06%)#3 | 235,353(0.29%)#24 |
| 25. | Centreville | 676 | 11,635(5.81%)#3 | 235,353(0.29%)#25 |
| 26. | Newark | 662 | 11,503(5.76%)#3 | 235,353(0.28%)#26 |
| 27. | Columbus | 651 | 2,181(29.85%)#1 | 235,353(0.28%)#27 |
| 28. | Brentwood | 644 | 104,928(0.61%)#3 | 235,353(0.27%)#28 |
| 29. | Merrifield | 631 | 11,635(5.42%)#4 | 235,353(0.27%)#29 |
| 30. | Jacksonville | 608 | 8,242(7.38%)#1 | 235,353(0.26%)#30 |
| 31. | Hicksville | 583 | 104,928(0.56%)#4 | 235,353(0.25%)#31 |
| 32. | Albuquerque | 581 | 902(64.41%)#1 | 235,353(0.25%)#32 |
| 33. | Irving | 553 | 13,488(4.10%)#4 | 235,353(0.23%)#33 |
| 34. | College Station | 545 | 13,488(4.04%)#5 | 235,353(0.23%)#34 |
| 35. | Sterling Heights | 538 | 15,306(3.51%)#4 | 235,353(0.23%)#35 |
| 36. | Seattle | 534 | 1,537(34.74%)#1 | 235,353(0.23%)#36 |
| 37. | Strongsville | 525 | 2,181(24.07%)#2 | 235,353(0.22%)#37 |
| 38. | Washington | 516 | 516(100.00%)#1 | 235,353(0.22%)#38 |
| 39. | San Diego | 513 | 16,014(3.20%)#4 | 235,353(0.22%)#39 |
| 40. | Phoenix | 506 | 2,844(17.79%)#2 | 235,353(0.21%)#40 |
| 41. | Rossville | 502 | 6,036(8.32%)#2 | 235,353(0.21%)#41 |
| 42. | Boston | 484 | 4,296(11.27%)#1 | 235,353(0.21%)#42 |
| 43. | Columbia | 483 | 6,036(8.00%)#3 | 235,353(0.21%)#43 |
| 44. | Chamblee | 482 | 6,794(7.09%)#2 | 235,353(0.20%)#44 |
| 45. | Long Beach | 480 | 16,014(3.00%)#5 | 235,353(0.20%)#45 |
| 46. | San Antonio | 479 | 13,488(3.55%)#6 | 235,353(0.20%)#46 |
| 47. | Davie | 469 | 8,242(5.69%)#2 | 235,353(0.20%)#47 |
| 48. | Alexandria | 467 | 11,635(4.01%)#5 | 235,353(0.20%)#48 |
| 49. | Bridgeport | 465 | 2,512(18.51%)#1 | 235,353(0.20%)#49 |
| 50. | Boca Raton | 454 | 8,242(5.51%)#3 | 235,353(0.19%)#50 |
| 51. | Garland | 451 | 13,488(3.34%)#7 | 235,353(0.19%)#51 |
| 52. | Jersey City | 427 | 11,503(3.71%)#4 | 235,353(0.18%)#52 |
| 53. | Troy | 409 | 15,306(2.67%)#5 | 235,353(0.17%)#53 |
| 54. | Austin | 405 | 13,488(3.00%)#8 | 235,353(0.17%)#54 |
| 55. | Cheektowaga | 387 | 104,928(0.37%)#5 | 235,353(0.16%)#55 |
| 56. | Reno | 382 | 669(57.10%)#1 | 235,353(0.16%)#56 |
| 57. | Allen | 380 | 13,488(2.82%)#9 | 235,353(0.16%)#57 |
| 58. | Frisco | 372 | 13,488(2.76%)#10 | 235,353(0.16%)#58 |
| 59. | Dallas | 367 | 13,488(2.72%)#11 | 235,353(0.16%)#59 |
| 60. | Kissimmee | 367 | 8,242(4.45%)#4 | 235,353(0.16%)#60 |
| 61. | Sunset | 366 | 880(41.59%)#1 | 235,353(0.16%)#61 |
| 62. | Arlington | 351 | 13,488(2.60%)#12 | 235,353(0.15%)#62 |
| 63. | Tonawanda | 351 | 104,928(0.33%)#6 | 235,353(0.15%)#63 |
| 64. | Dale City | 345 | 11,635(2.97%)#6 | 235,353(0.15%)#64 |
| 65. | Fremont | 336 | 16,014(2.10%)#6 | 235,353(0.14%)#65 |
| 66. | San Francisco | 335 | 16,014(2.09%)#7 | 235,353(0.14%)#66 |
| 67. | Potomac Mills | 335 | 11,635(2.88%)#7 | 235,353(0.14%)#67 |
| 68. | Chester | 330 | 104,928(0.31%)#7 | 235,353(0.14%)#68 |
| 69. | Glen Burnie | 329 | 6,036(5.45%)#4 | 235,353(0.14%)#69 |
| 70. | Chantilly | 324 | 11,635(2.78%)#8 | 235,353(0.14%)#70 |
| 71. | Virginia Beach | 317 | 11,635(2.72%)#9 | 235,353(0.13%)#71 |
| 72. | Sterling | 313 | 11,635(2.69%)#10 | 235,353(0.13%)#72 |
| 73. | Nashville | 301 | 684(44.01%)#1 | 235,353(0.13%)#73 |
| 74. | Edgemere | 300 | 6,036(4.97%)#5 | 235,353(0.13%)#74 |
| 75. | College Park | 298 | 6,036(4.94%)#6 | 235,353(0.13%)#75 |
| 76. | Lorton | 290 | 11,635(2.49%)#11 | 235,353(0.12%)#76 |
| 77. | Springfield | 285 | 11,635(2.45%)#12 | 235,353(0.12%)#77 |
| 78. | Irvine | 282 | 16,014(1.76%)#8 | 235,353(0.12%)#78 |
| 79. | Salem | 282 | 4,296(6.56%)#2 | 235,353(0.12%)#79 |
| 80. | Garden City Park | 281 | 104,928(0.27%)#8 | 235,353(0.12%)#80 |
| 81. | Lexington | 280 | 4,296(6.52%)#3 | 235,353(0.12%)#81 |
| 82. | Las Cruces | 273 | 902(30.27%)#2 | 235,353(0.12%)#82 |
| 83. | Manhattan | 272 | 801(33.96%)#1 | 235,353(0.12%)#83 |
| 84. | Skokie | 269 | 2,849(9.44%)#2 | 235,353(0.11%)#84 |
| 85. | Cambridge | 268 | 4,296(6.24%)#4 | 235,353(0.11%)#85 |
| 86. | Westgate | 268 | 8,242(3.25%)#5 | 235,353(0.11%)#86 |
| 87. | Seymour | 266 | 1,725(15.42%)#2 | 235,353(0.11%)#87 |
| 88. | Beavercreek | 265 | 2,181(12.15%)#3 | 235,353(0.11%)#88 |
| 89. | Norcross | 264 | 6,794(3.89%)#3 | 235,353(0.11%)#89 |
| 90. | Santa Clara | 262 | 16,014(1.64%)#9 | 235,353(0.11%)#90 |
| 91. | Richardson | 260 | 13,488(1.93%)#13 | 235,353(0.11%)#91 |
| 92. | Lauderdale Lakes | 260 | 8,242(3.15%)#6 | 235,353(0.11%)#92 |
| 93. | Lawrenceville | 260 | 6,794(3.83%)#4 | 235,353(0.11%)#93 |
| 94. | Ronkonkoma | 260 | 104,928(0.25%)#9 | 235,353(0.11%)#94 |
| 95. | New Baltimore | 260 | 11,635(2.23%)#13 | 235,353(0.11%)#95 |
| 96. | Montclair | 259 | 11,635(2.23%)#14 | 235,353(0.11%)#96 |
| 97. | Folsom | 253 | 16,014(1.58%)#10 | 235,353(0.11%)#97 |
| 98. | Carrollton | 251 | 13,488(1.86%)#14 | 235,353(0.11%)#98 |
| 99. | Stamford | 250 | 2,512(9.95%)#2 | 235,353(0.11%)#99 |
| 100. | Woodburn | 249 | 11,635(2.14%)#15 | 235,353(0.11%)#100 |
Common Questions
What are the Top 10 Cities with the Largest Vietnamese Community in the United States?
Top 10 Cities with the Largest Vietnamese Community in the United States are:
What city has the Largest Vietnamese Community in the United States?
New York has the Largest Vietnamese Community in the United States with 89,570.
What is the Total Vietnamese Population in the United States?
Total Vietnamese Population in the United States is 235,353.