Black Canyon City, AZ Map & Demographics
Black Canyon City Map
Black Canyon City Overview
$31,985
PER CAPITA INCOME
$75,592
AVG FAMILY INCOME
$48,468
AVG HOUSEHOLD INCOME
24.9%
WAGE / INCOME GAP [ % ]
75.1¢/ $1
WAGE / INCOME GAP [ $ ]
0.44
INEQUALITY / GINI INDEX
2,408
TOTAL POPULATION
1,257
MALE POPULATION
1,151
FEMALE POPULATION
109.21
MALES / 100 FEMALES
91.57
FEMALES / 100 MALES
60.4
MEDIAN AGE
2.5
AVG FAMILY SIZE
2.0
AVG HOUSEHOLD SIZE
921
LABOR FORCE [ PEOPLE ]
38.7%
PERCENT IN LABOR FORCE
12.8%
UNEMPLOYMENT RATE
Black Canyon City Zip Codes
Black Canyon City Area Codes
Income in Black Canyon City
Income Overview in Black Canyon City
Per Capita Income in Black Canyon City is $31,985, while median incomes of families and households are $75,592 and $48,468 respectively.
| Characteristic | Number | Measure |
| Per Capita Income | 2,408 | $31,985 |
| Median Family Income | 579 | $75,592 |
| Mean Family Income | 579 | $84,051 |
| Median Household Income | 1,179 | $48,468 |
| Mean Household Income | 1,179 | $65,821 |
| Income Deficit | 579 | $0 |
| Wage / Income Gap (%) | 2,408 | 24.93% |
| Wage / Income Gap ($) | 2,408 | 75.07¢ per $1 |
| Gini / Inequality Index | 2,408 | 0.44 |
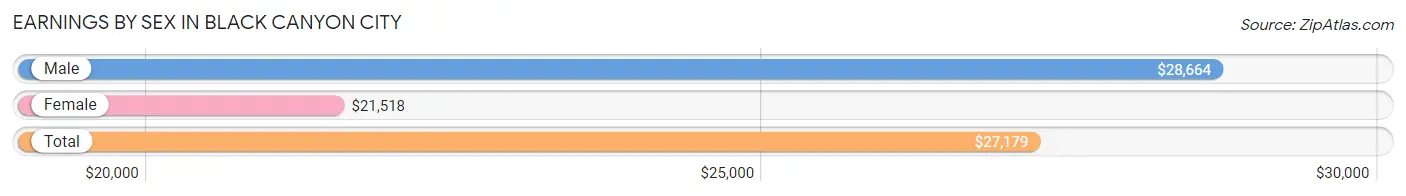
Earnings by Sex in Black Canyon City
Average Earnings in Black Canyon City are $27,179, $28,664 for men and $21,518 for women, a difference of 24.9%.
| Sex | Number | Average Earnings |
| Male | 465 (48.5%) | $28,664 |
| Female | 493 (51.5%) | $21,518 |
| Total | 958 (100.0%) | $27,179 |
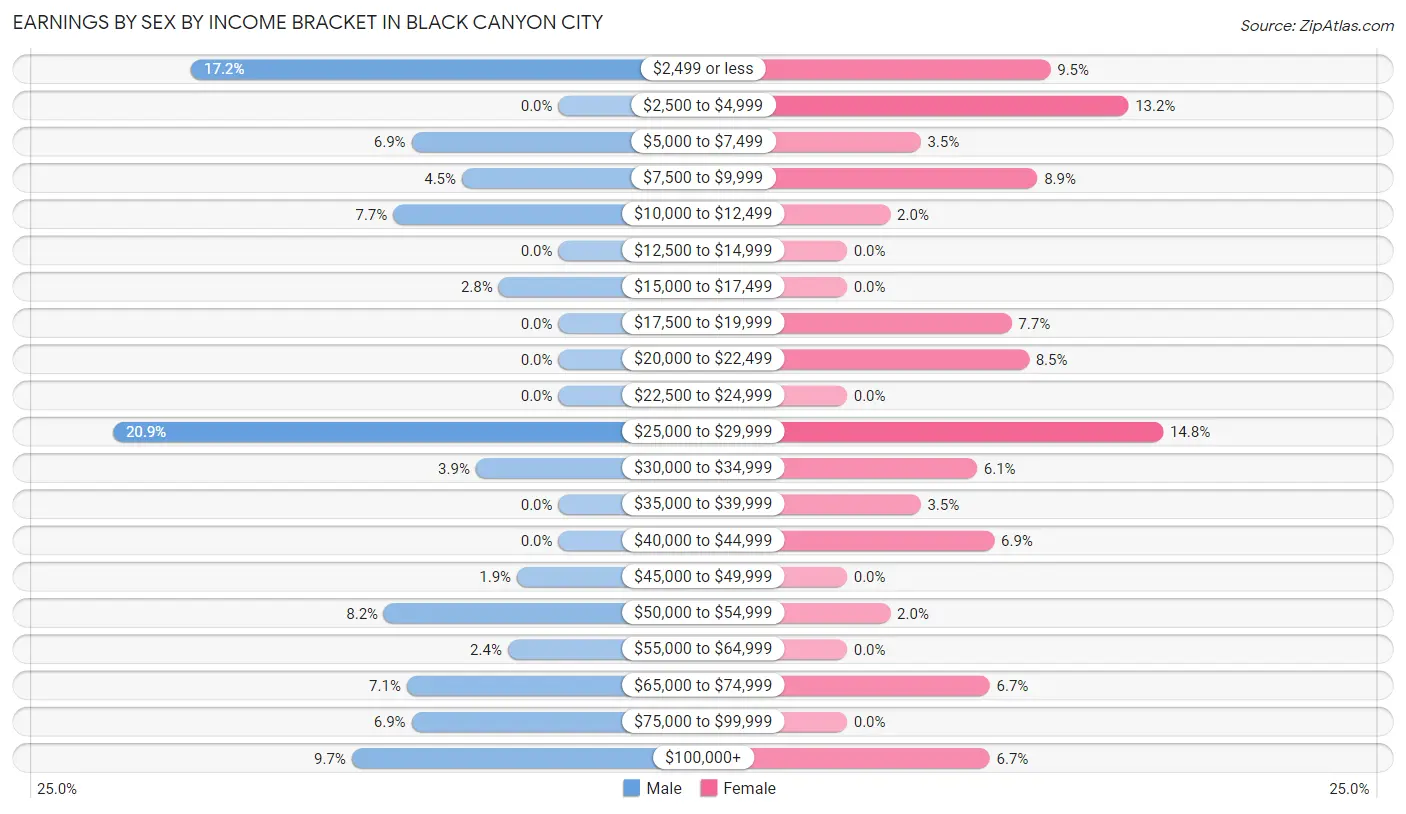
Earnings by Sex by Income Bracket in Black Canyon City
The most common earnings brackets in Black Canyon City are $25,000 to $29,999 for men (97 | 20.9%) and $25,000 to $29,999 for women (73 | 14.8%).
| Income | Male | Female |
| $2,499 or less | 80 (17.2%) | 47 (9.5%) |
| $2,500 to $4,999 | 0 (0.0%) | 65 (13.2%) |
| $5,000 to $7,499 | 32 (6.9%) | 17 (3.5%) |
| $7,500 to $9,999 | 21 (4.5%) | 44 (8.9%) |
| $10,000 to $12,499 | 36 (7.7%) | 10 (2.0%) |
| $12,500 to $14,999 | 0 (0.0%) | 0 (0.0%) |
| $15,000 to $17,499 | 13 (2.8%) | 0 (0.0%) |
| $17,500 to $19,999 | 0 (0.0%) | 38 (7.7%) |
| $20,000 to $22,499 | 0 (0.0%) | 42 (8.5%) |
| $22,500 to $24,999 | 0 (0.0%) | 0 (0.0%) |
| $25,000 to $29,999 | 97 (20.9%) | 73 (14.8%) |
| $30,000 to $34,999 | 18 (3.9%) | 30 (6.1%) |
| $35,000 to $39,999 | 0 (0.0%) | 17 (3.5%) |
| $40,000 to $44,999 | 0 (0.0%) | 34 (6.9%) |
| $45,000 to $49,999 | 9 (1.9%) | 0 (0.0%) |
| $50,000 to $54,999 | 38 (8.2%) | 10 (2.0%) |
| $55,000 to $64,999 | 11 (2.4%) | 0 (0.0%) |
| $65,000 to $74,999 | 33 (7.1%) | 33 (6.7%) |
| $75,000 to $99,999 | 32 (6.9%) | 0 (0.0%) |
| $100,000+ | 45 (9.7%) | 33 (6.7%) |
| Total | 465 (100.0%) | 493 (100.0%) |
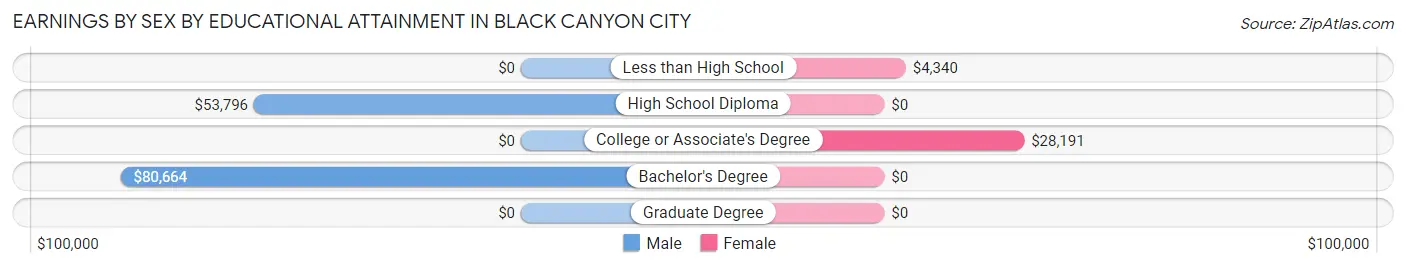
Earnings by Sex by Educational Attainment in Black Canyon City
| Educational Attainment | Male Income | Female Income |
| Less than High School | - | - |
| High School Diploma | $53,796 | $0 |
| College or Associate's Degree | - | - |
| Bachelor's Degree | $80,664 | $0 |
| Graduate Degree | - | - |
| Total | - | - |
Family Income in Black Canyon City
Family Income Brackets in Black Canyon City
According to the Black Canyon City family income data, there are 173 families falling into the $100,000 to $149,999 income range, which is the most common income bracket and makes up 29.9% of all families.
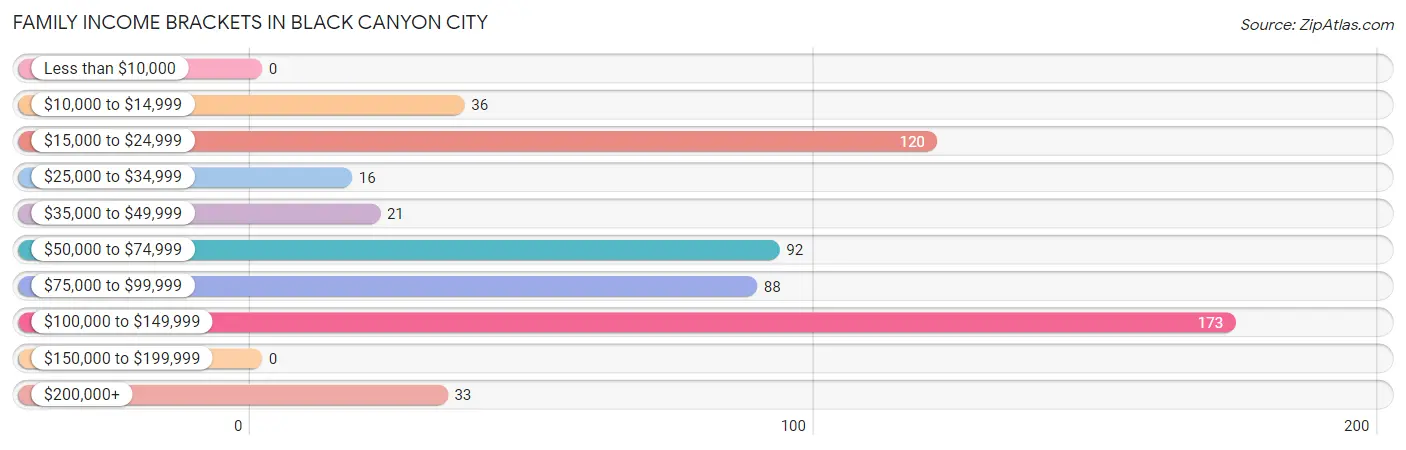
| Income Bracket | # Families | % Families |
| Less than $10,000 | 0 | 0.0% |
| $10,000 to $14,999 | 36 | 6.2% |
| $15,000 to $24,999 | 120 | 20.7% |
| $25,000 to $34,999 | 16 | 2.8% |
| $35,000 to $49,999 | 21 | 3.6% |
| $50,000 to $74,999 | 92 | 15.9% |
| $75,000 to $99,999 | 88 | 15.2% |
| $100,000 to $149,999 | 173 | 29.9% |
| $150,000 to $199,999 | 0 | 0.0% |
| $200,000+ | 33 | 5.7% |
Family Income by Famaliy Size in Black Canyon City
3-person families (80 | 13.8%) account for the highest median family income in Black Canyon City with $128,750 per family, while 3-person families (80 | 13.8%) have the highest median income of $42,917 per family member.
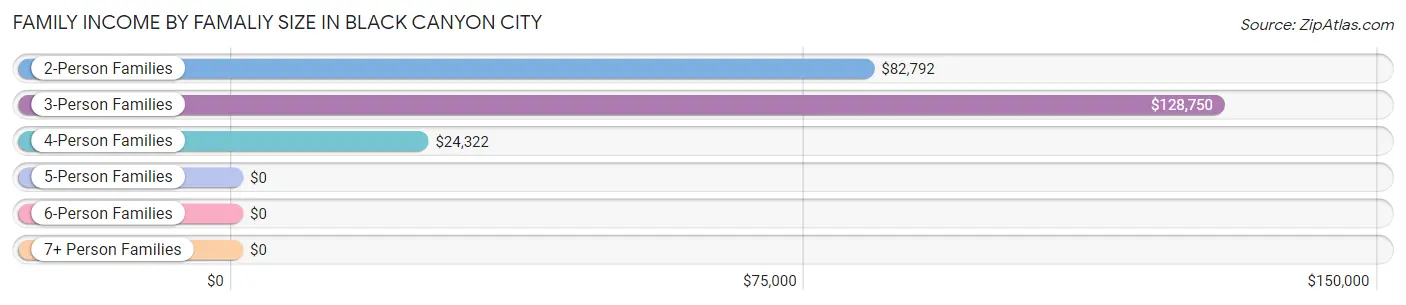
| Income Bracket | # Families | Median Income |
| 2-Person Families | 403 (69.6%) | $82,792 |
| 3-Person Families | 80 (13.8%) | $128,750 |
| 4-Person Families | 86 (14.8%) | $24,322 |
| 5-Person Families | 10 (1.7%) | $0 |
| 6-Person Families | 0 (0.0%) | $0 |
| 7+ Person Families | 0 (0.0%) | $0 |
| Total | 579 (100.0%) | $75,592 |
Family Income by Number of Earners in Black Canyon City
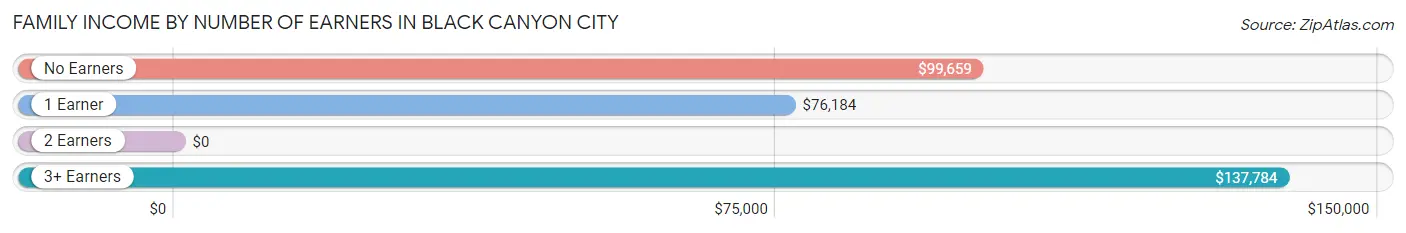
| Number of Earners | # Families | Median Income |
| No Earners | 203 (35.1%) | $99,659 |
| 1 Earner | 132 (22.8%) | $76,184 |
| 2 Earners | 205 (35.4%) | $0 |
| 3+ Earners | 39 (6.7%) | $137,784 |
| Total | 579 (100.0%) | $75,592 |
Household Income in Black Canyon City
Household Income Brackets in Black Canyon City
With 216 households falling in the category, the $75,000 to $99,999 income range is the most frequent in Black Canyon City, accounting for 18.3% of all households.
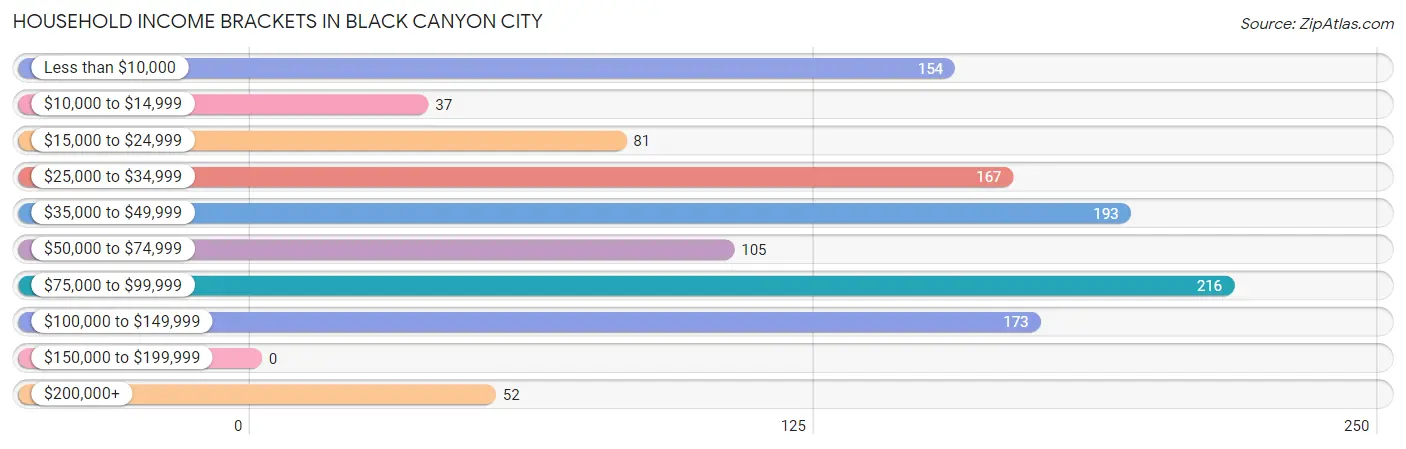
| Income Bracket | # Households | % Households |
| Less than $10,000 | 154 | 13.1% |
| $10,000 to $14,999 | 37 | 3.1% |
| $15,000 to $24,999 | 81 | 6.9% |
| $25,000 to $34,999 | 167 | 14.2% |
| $35,000 to $49,999 | 193 | 16.4% |
| $50,000 to $74,999 | 105 | 8.9% |
| $75,000 to $99,999 | 216 | 18.3% |
| $100,000 to $149,999 | 173 | 14.7% |
| $150,000 to $199,999 | 0 | 0.0% |
| $200,000+ | 52 | 4.4% |
Household Income by Householder Age in Black Canyon City
The median household income in Black Canyon City is $48,468, with the highest median household income of $83,539 found in the 45 to 64 years age bracket for the primary householder. A total of 528 households (44.8%) fall into this category.
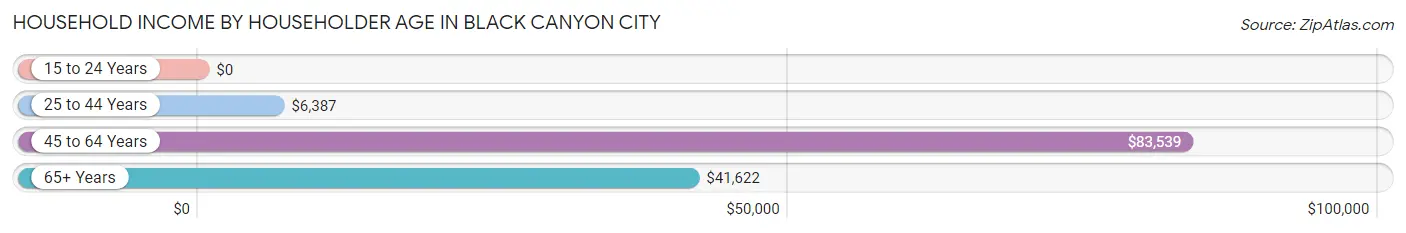
| Income Bracket | # Households | Median Income |
| 15 to 24 Years | 0 (0.0%) | $0 |
| 25 to 44 Years | 145 (12.3%) | $6,387 |
| 45 to 64 Years | 528 (44.8%) | $83,539 |
| 65+ Years | 506 (42.9%) | $41,622 |
| Total | 1,179 (100.0%) | $48,468 |
Poverty in Black Canyon City
Income Below Poverty by Sex and Age in Black Canyon City
With 24.6% poverty level for males and 20.0% for females among the residents of Black Canyon City, 35 to 44 year old males and 35 to 44 year old females are the most vulnerable to poverty, with 148 males (81.3%) and 53 females (84.1%) in their respective age groups living below the poverty level.
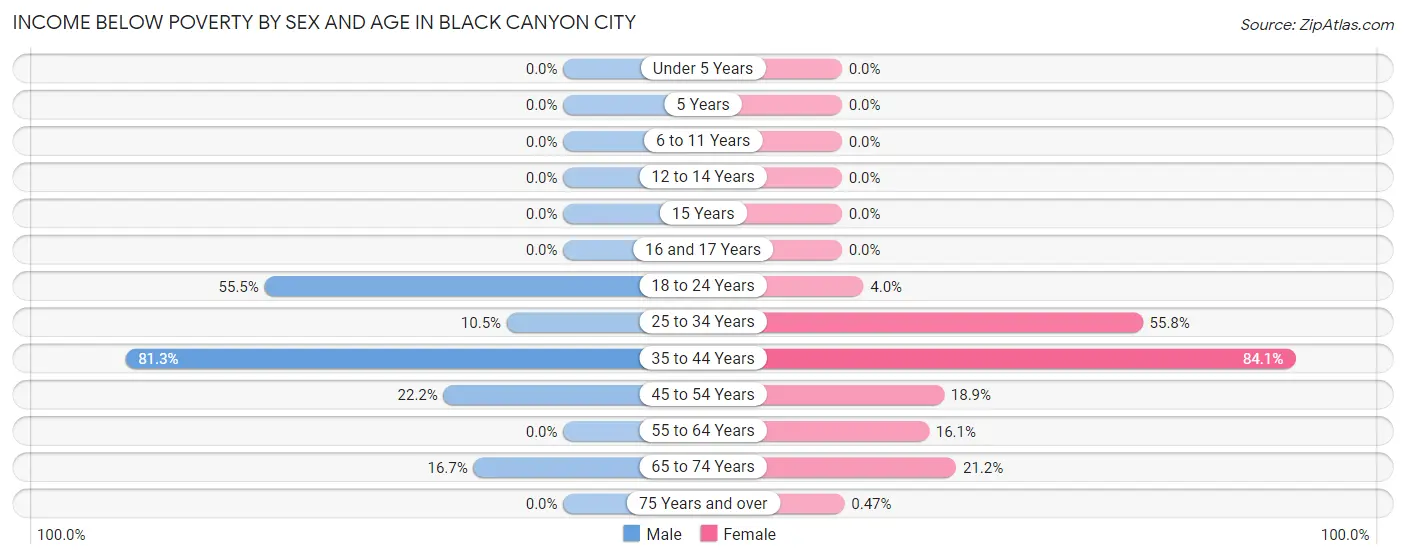
| Age Bracket | Male | Female |
| Under 5 Years | 0 (0.0%) | 0 (0.0%) |
| 5 Years | 0 (0.0%) | 0 (0.0%) |
| 6 to 11 Years | 0 (0.0%) | 0 (0.0%) |
| 12 to 14 Years | 0 (0.0%) | 0 (0.0%) |
| 15 Years | 0 (0.0%) | 0 (0.0%) |
| 16 and 17 Years | 0 (0.0%) | 0 (0.0%) |
| 18 to 24 Years | 61 (55.4%) | 1 (4.0%) |
| 25 to 34 Years | 11 (10.5%) | 43 (55.8%) |
| 35 to 44 Years | 148 (81.3%) | 53 (84.1%) |
| 45 to 54 Years | 36 (22.2%) | 25 (18.9%) |
| 55 to 64 Years | 0 (0.0%) | 72 (16.1%) |
| 65 to 74 Years | 53 (16.7%) | 35 (21.2%) |
| 75 Years and over | 0 (0.0%) | 1 (0.5%) |
| Total | 309 (24.6%) | 230 (20.0%) |
Income Above Poverty by Sex and Age in Black Canyon City
According to the poverty statistics in Black Canyon City, males aged 16 and 17 years and females aged 12 to 14 years are the age groups that are most secure financially, with 100.0% of males and 100.0% of females in these age groups living above the poverty line.
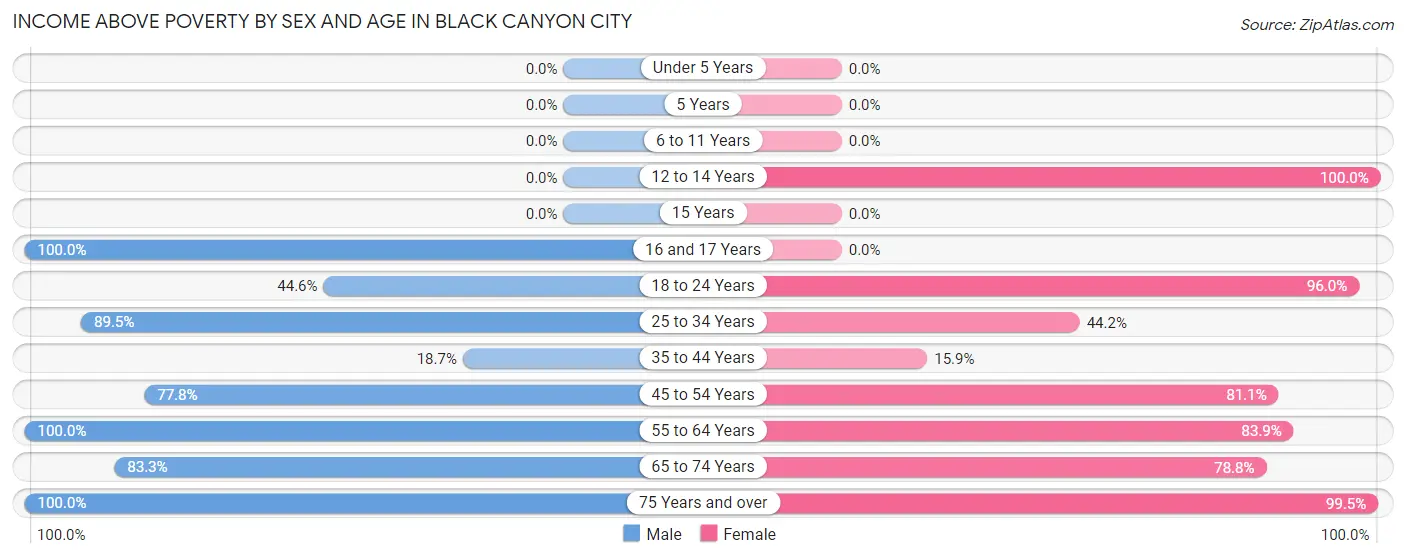
| Age Bracket | Male | Female |
| Under 5 Years | 0 (0.0%) | 0 (0.0%) |
| 5 Years | 0 (0.0%) | 0 (0.0%) |
| 6 to 11 Years | 0 (0.0%) | 0 (0.0%) |
| 12 to 14 Years | 0 (0.0%) | 28 (100.0%) |
| 15 Years | 0 (0.0%) | 0 (0.0%) |
| 16 and 17 Years | 14 (100.0%) | 0 (0.0%) |
| 18 to 24 Years | 49 (44.6%) | 24 (96.0%) |
| 25 to 34 Years | 94 (89.5%) | 34 (44.2%) |
| 35 to 44 Years | 34 (18.7%) | 10 (15.9%) |
| 45 to 54 Years | 126 (77.8%) | 107 (81.1%) |
| 55 to 64 Years | 279 (100.0%) | 374 (83.9%) |
| 65 to 74 Years | 265 (83.3%) | 130 (78.8%) |
| 75 Years and over | 87 (100.0%) | 214 (99.5%) |
| Total | 948 (75.4%) | 921 (80.0%) |
Income Below Poverty Among Married-Couple Families in Black Canyon City
The poverty statistics for married-couple families in Black Canyon City show that 10.3% or 50 of the total 485 families live below the poverty line. Families with no children have the highest poverty rate of 10.3%, comprising of 50 families. On the other hand, families with no children have the lowest poverty rate of 10.3%, which includes 50 families.
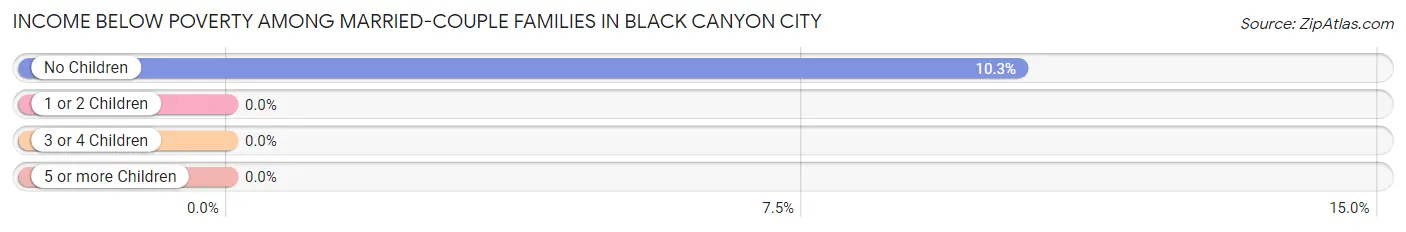
| Children | Above Poverty | Below Poverty |
| No Children | 435 (89.7%) | 50 (10.3%) |
| 1 or 2 Children | 0 (0.0%) | 0 (0.0%) |
| 3 or 4 Children | 0 (0.0%) | 0 (0.0%) |
| 5 or more Children | 0 (0.0%) | 0 (0.0%) |
| Total | 435 (89.7%) | 50 (10.3%) |
Income Below Poverty Among Single-Parent Households in Black Canyon City
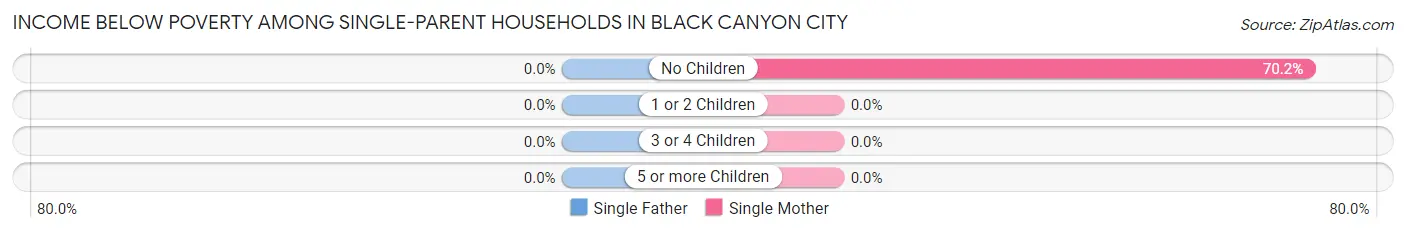
| Children | Single Father | Single Mother |
| No Children | 0 (0.0%) | 59 (70.2%) |
| 1 or 2 Children | 0 (0.0%) | 0 (0.0%) |
| 3 or 4 Children | 0 (0.0%) | 0 (0.0%) |
| 5 or more Children | 0 (0.0%) | 0 (0.0%) |
| Total | 0 (0.0%) | 59 (62.8%) |
Income Below Poverty Among Married-Couple vs Single-Parent Households in Black Canyon City
The poverty data for Black Canyon City shows that 50 of the married-couple family households (10.3%) and 59 of the single-parent households (62.8%) are living below the poverty level. Within the married-couple family households, those with no children have the highest poverty rate, with 50 households (10.3%) falling below the poverty line. Among the single-parent households, those with no children have the highest poverty rate, with 59 household (70.2%) living below poverty.
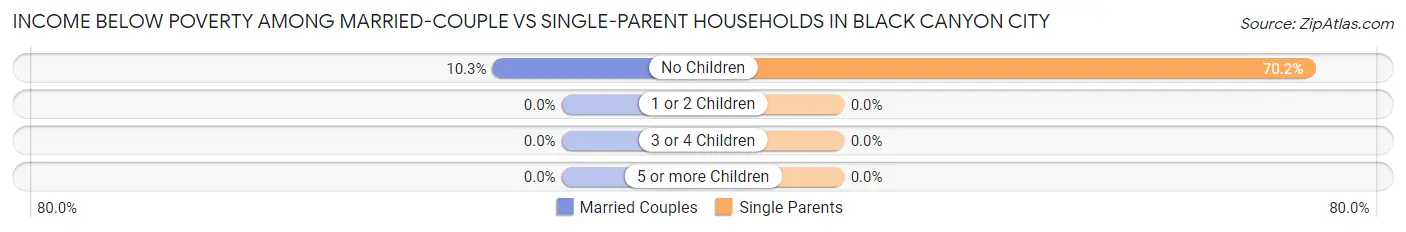
| Children | Married-Couple Families | Single-Parent Households |
| No Children | 50 (10.3%) | 59 (70.2%) |
| 1 or 2 Children | 0 (0.0%) | 0 (0.0%) |
| 3 or 4 Children | 0 (0.0%) | 0 (0.0%) |
| 5 or more Children | 0 (0.0%) | 0 (0.0%) |
| Total | 50 (10.3%) | 59 (62.8%) |
Race in Black Canyon City
The most populous races in Black Canyon City are White / Caucasian (2,192 | 91.0%), Two or more Races (186 | 7.7%), and Hispanic or Latino (80 | 3.3%).
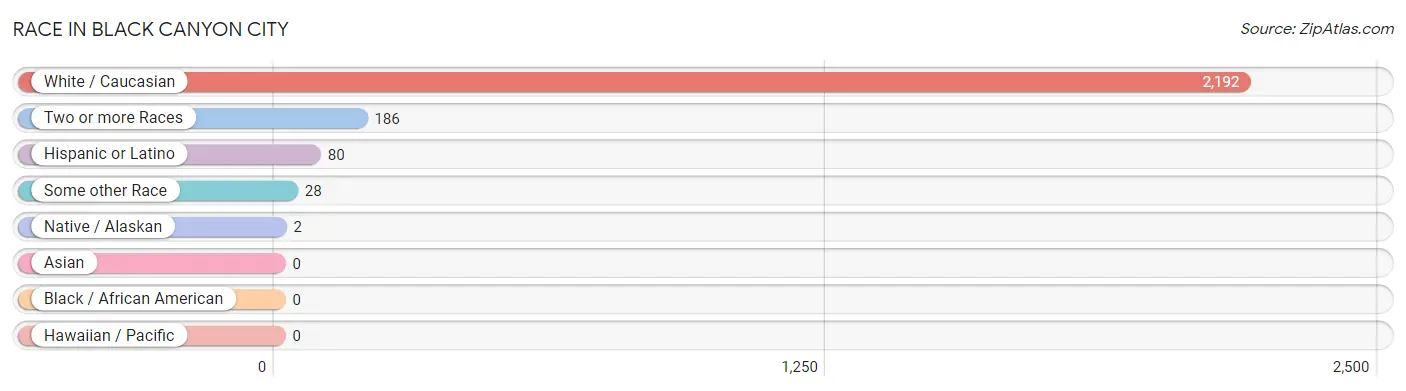
| Race | # Population | % Population |
| Asian | 0 | 0.0% |
| Black / African American | 0 | 0.0% |
| Hawaiian / Pacific | 0 | 0.0% |
| Hispanic or Latino | 80 | 3.3% |
| Native / Alaskan | 2 | 0.1% |
| White / Caucasian | 2,192 | 91.0% |
| Two or more Races | 186 | 7.7% |
| Some other Race | 28 | 1.2% |
| Total | 2,408 | 100.0% |
Ancestry in Black Canyon City
The most populous ancestries reported in Black Canyon City are German (369 | 15.3%), Irish (302 | 12.5%), English (286 | 11.9%), Italian (178 | 7.4%), and American (124 | 5.1%), together accounting for 52.3% of all Black Canyon City residents.
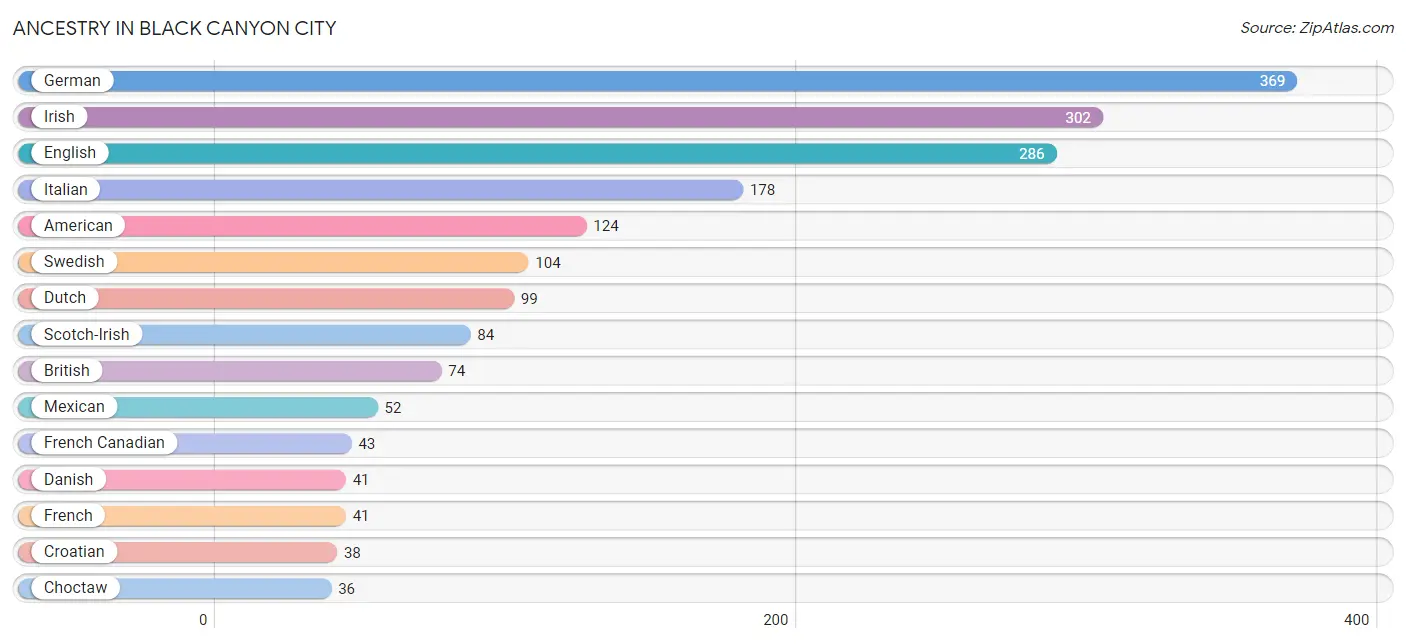
| Ancestry | # Population | % Population |
| American | 124 | 5.1% |
| Apache | 2 | 0.1% |
| Austrian | 12 | 0.5% |
| Blackfeet | 5 | 0.2% |
| British | 74 | 3.1% |
| Cherokee | 34 | 1.4% |
| Choctaw | 36 | 1.5% |
| Croatian | 38 | 1.6% |
| Czech | 6 | 0.3% |
| Danish | 41 | 1.7% |
| Dutch | 99 | 4.1% |
| English | 286 | 11.9% |
| French | 41 | 1.7% |
| French Canadian | 43 | 1.8% |
| German | 369 | 15.3% |
| Irish | 302 | 12.5% |
| Italian | 178 | 7.4% |
| Mexican | 52 | 2.2% |
| Native Hawaiian | 29 | 1.2% |
| Norwegian | 34 | 1.4% |
| Polish | 21 | 0.9% |
| Portuguese | 10 | 0.4% |
| Scandinavian | 29 | 1.2% |
| Scotch-Irish | 84 | 3.5% |
| Scottish | 22 | 0.9% |
| Sioux | 18 | 0.7% |
| Swedish | 104 | 4.3% |
| Welsh | 11 | 0.5% | View All 28 Rows |
Immigrants in Black Canyon City
The most numerous immigrant groups reported in Black Canyon City came from Central America (28 | 1.2%), Latin America (28 | 1.2%), Mexico (28 | 1.2%), England (12 | 0.5%), and Europe (12 | 0.5%), together accounting for 4.5% of all Black Canyon City residents.
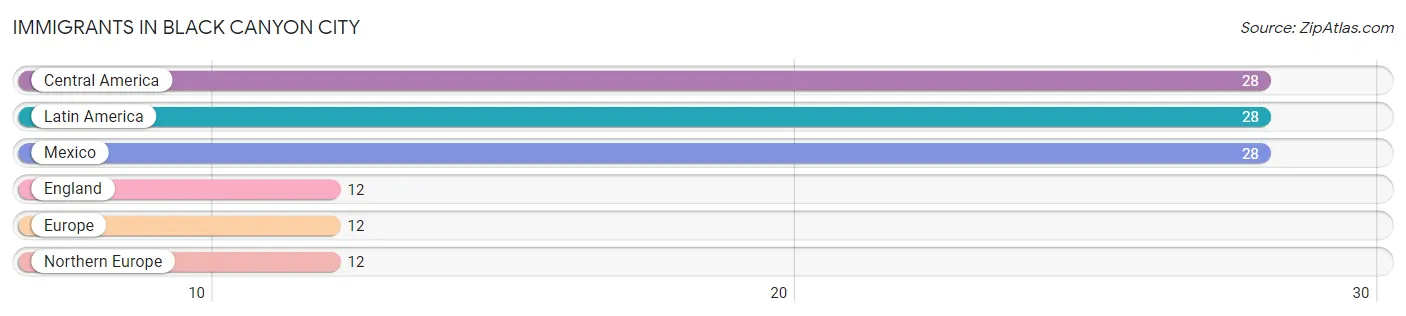
| Immigration Origin | # Population | % Population |
| Central America | 28 | 1.2% |
| England | 12 | 0.5% |
| Europe | 12 | 0.5% |
| Latin America | 28 | 1.2% |
| Mexico | 28 | 1.2% |
| Northern Europe | 12 | 0.5% | View All 6 Rows |
Sex and Age in Black Canyon City
Sex and Age in Black Canyon City
The most populous age groups in Black Canyon City are 60 to 64 Years (175 | 13.9%) for men and 60 to 64 Years (329 | 28.6%) for women.
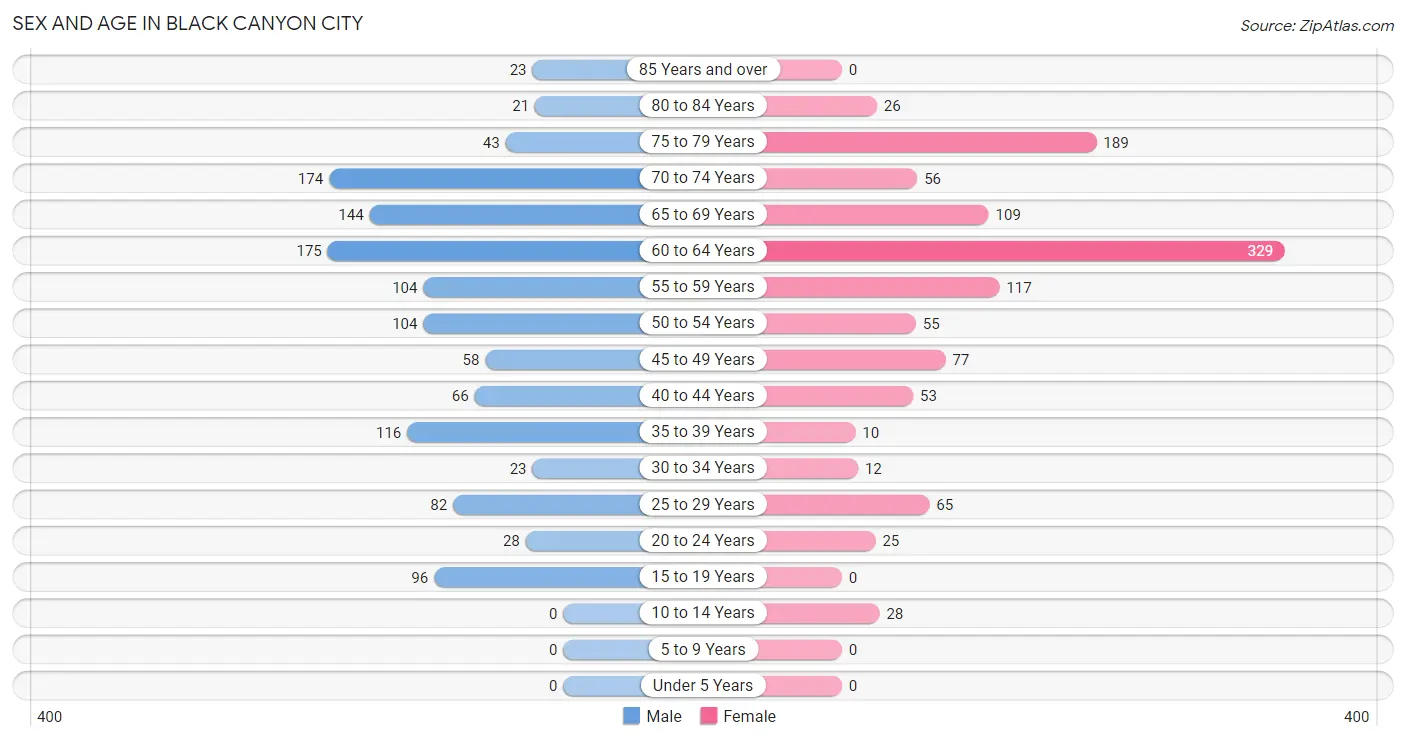
| Age Bracket | Male | Female |
| Under 5 Years | 0 (0.0%) | 0 (0.0%) |
| 5 to 9 Years | 0 (0.0%) | 0 (0.0%) |
| 10 to 14 Years | 0 (0.0%) | 28 (2.4%) |
| 15 to 19 Years | 96 (7.6%) | 0 (0.0%) |
| 20 to 24 Years | 28 (2.2%) | 25 (2.2%) |
| 25 to 29 Years | 82 (6.5%) | 65 (5.7%) |
| 30 to 34 Years | 23 (1.8%) | 12 (1.0%) |
| 35 to 39 Years | 116 (9.2%) | 10 (0.9%) |
| 40 to 44 Years | 66 (5.2%) | 53 (4.6%) |
| 45 to 49 Years | 58 (4.6%) | 77 (6.7%) |
| 50 to 54 Years | 104 (8.3%) | 55 (4.8%) |
| 55 to 59 Years | 104 (8.3%) | 117 (10.2%) |
| 60 to 64 Years | 175 (13.9%) | 329 (28.6%) |
| 65 to 69 Years | 144 (11.5%) | 109 (9.5%) |
| 70 to 74 Years | 174 (13.8%) | 56 (4.9%) |
| 75 to 79 Years | 43 (3.4%) | 189 (16.4%) |
| 80 to 84 Years | 21 (1.7%) | 26 (2.3%) |
| 85 Years and over | 23 (1.8%) | 0 (0.0%) |
| Total | 1,257 (100.0%) | 1,151 (100.0%) |
Families and Households in Black Canyon City
Median Family Size in Black Canyon City
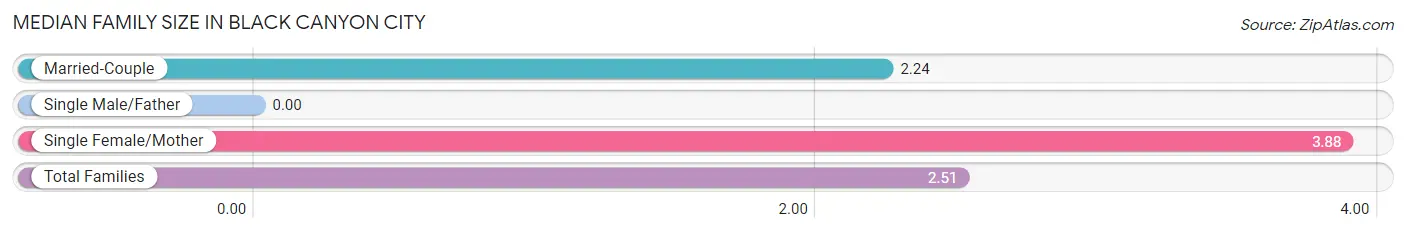
| Family Type | # Families | Family Size |
| Married-Couple | 485 (83.8%) | 2.24 |
| Single Male/Father | 0 (0.0%) | - |
| Single Female/Mother | 94 (16.2%) | 3.88 |
| Total Families | 579 (100.0%) | 2.51 |
Median Household Size in Black Canyon City
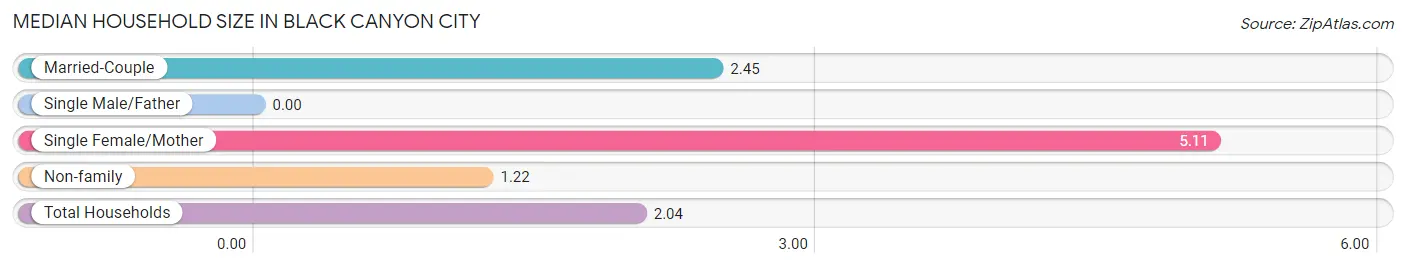
| Household Type | # Households | Household Size |
| Married-Couple | 485 (41.1%) | 2.45 |
| Single Male/Father | 0 (0.0%) | - |
| Single Female/Mother | 94 (8.0%) | 5.11 |
| Non-family | 600 (50.9%) | 1.22 |
| Total Households | 1,179 (100.0%) | 2.04 |
Household Size by Marriage Status in Black Canyon City
Out of a total of 1,179 households in Black Canyon City, 579 (49.1%) are family households, while 600 (50.9%) are nonfamily households. The most numerous type of family households are 2-person households, comprising 362, and the most common type of nonfamily households are 1-person households, comprising 480.
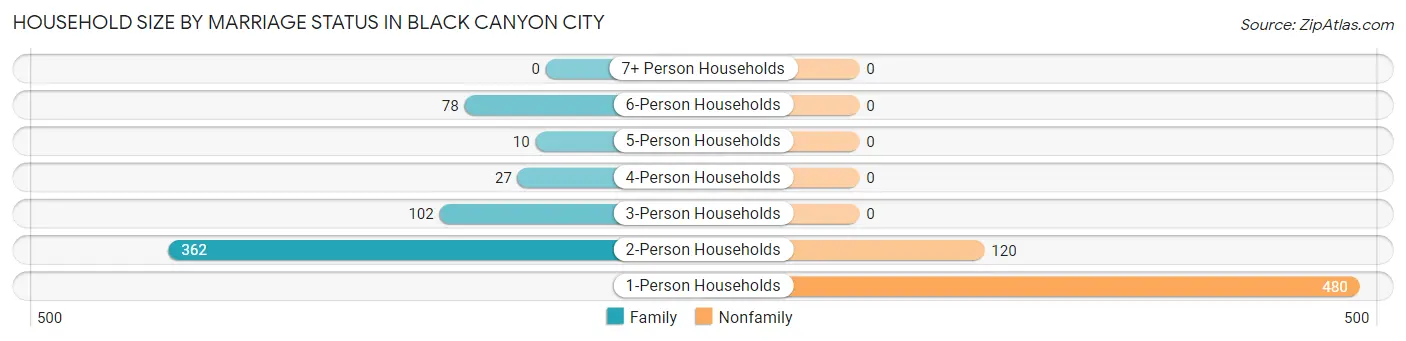
| Household Size | Family Households | Nonfamily Households |
| 1-Person Households | - | 480 (40.7%) |
| 2-Person Households | 362 (30.7%) | 120 (10.2%) |
| 3-Person Households | 102 (8.6%) | 0 (0.0%) |
| 4-Person Households | 27 (2.3%) | 0 (0.0%) |
| 5-Person Households | 10 (0.9%) | 0 (0.0%) |
| 6-Person Households | 78 (6.6%) | 0 (0.0%) |
| 7+ Person Households | 0 (0.0%) | 0 (0.0%) |
| Total | 579 (49.1%) | 600 (50.9%) |
Female Fertility in Black Canyon City
Fertility by Age in Black Canyon City
| Age Bracket | Women with Births | Births / 1,000 Women |
| 15 to 19 years | 0 (0.0%) | 0.0 |
| 20 to 34 years | 0 (0.0%) | 0.0 |
| 35 to 50 years | 0 (0.0%) | 0.0 |
| Total | 0 (0.0%) | 0.0 |
Fertility by Age by Marriage Status in Black Canyon City
| Age Bracket | Married | Unmarried |
| 15 to 19 years | 0 (0.0%) | 0 (0.0%) |
| 20 to 34 years | 0 (0.0%) | 0 (0.0%) |
| 35 to 50 years | 0 (0.0%) | 0 (0.0%) |
| Total | 0 (0.0%) | 0 (0.0%) |
Fertility by Education in Black Canyon City
| Educational Attainment | Women with Births | Births / 1,000 Women |
| Less than High School | 0 (0.0%) | 0.0 |
| High School Diploma | 0 (0.0%) | 0.0 |
| College or Associate's Degree | 0 (0.0%) | 0.0 |
| Bachelor's Degree | 0 (0.0%) | 0.0 |
| Graduate Degree | 0 (0.0%) | 0.0 |
| Total | 0 (0.0%) | 0.0 |
Fertility by Education by Marriage Status in Black Canyon City
| Educational Attainment | Married | Unmarried |
| Less than High School | 0 (0.0%) | 0 (0.0%) |
| High School Diploma | 0 (0.0%) | 0 (0.0%) |
| College or Associate's Degree | 0 (0.0%) | 0 (0.0%) |
| Bachelor's Degree | 0 (0.0%) | 0 (0.0%) |
| Graduate Degree | 0 (0.0%) | 0 (0.0%) |
| Total | 0 (0.0%) | 0 (0.0%) |
Employment Characteristics in Black Canyon City
Employment by Class of Employer in Black Canyon City
Among the 767 employed individuals in Black Canyon City, private company employees (504 | 65.7%), not-for-profit organizations (80 | 10.4%), and self-employed (incorporated) (70 | 9.1%) make up the most common classes of employment.
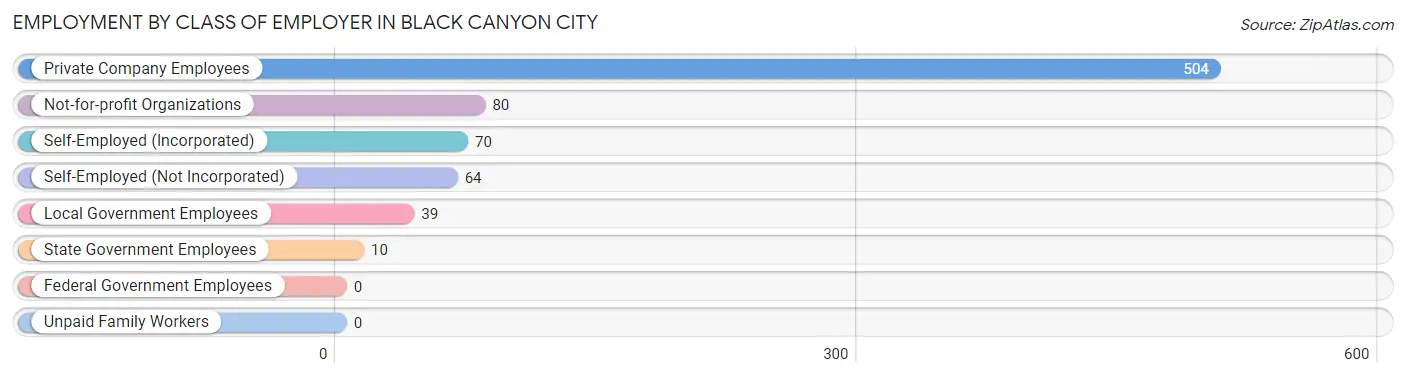
| Employer Class | # Employees | % Employees |
| Private Company Employees | 504 | 65.7% |
| Self-Employed (Incorporated) | 70 | 9.1% |
| Self-Employed (Not Incorporated) | 64 | 8.3% |
| Not-for-profit Organizations | 80 | 10.4% |
| Local Government Employees | 39 | 5.1% |
| State Government Employees | 10 | 1.3% |
| Federal Government Employees | 0 | 0.0% |
| Unpaid Family Workers | 0 | 0.0% |
| Total | 767 | 100.0% |
Employment Status by Age in Black Canyon City
According to the labor force statistics for Black Canyon City, out of the total population over 16 years of age (2,380), 38.7% or 921 individuals are in the labor force, with 12.8% or 118 of them unemployed. The age group with the highest labor force participation rate is 20 to 24 years, with 98.1% or 52 individuals in the labor force. Within the labor force, the 16 to 19 years age range has the highest percentage of unemployed individuals, with 74.4% or 61 of them being unemployed.
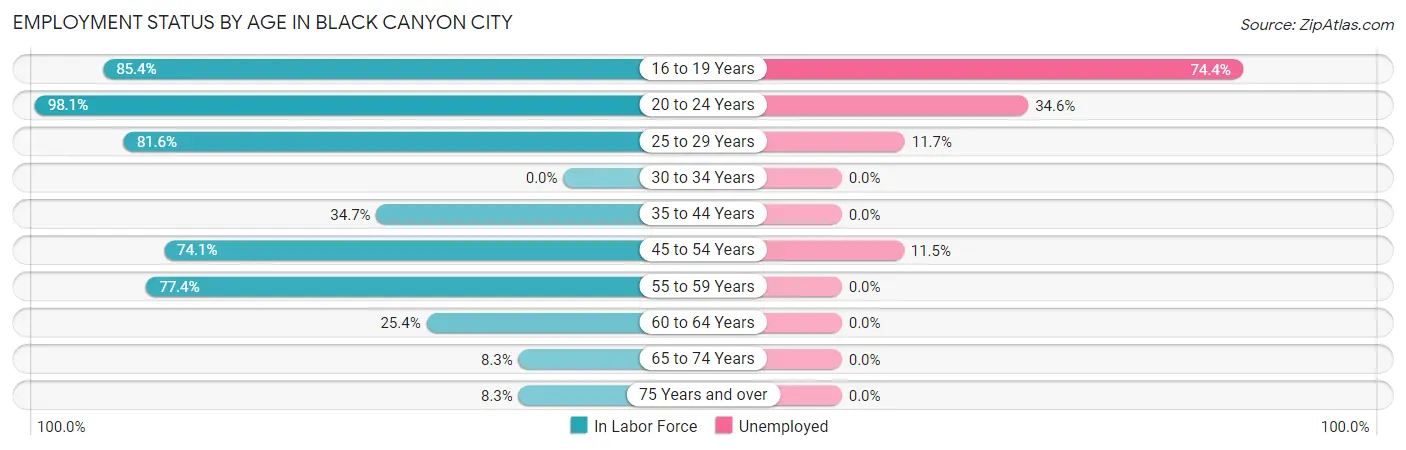
| Age Bracket | In Labor Force | Unemployed |
| 16 to 19 Years | 82 (85.4%) | 61 (74.4%) |
| 20 to 24 Years | 52 (98.1%) | 18 (34.6%) |
| 25 to 29 Years | 120 (81.6%) | 14 (11.7%) |
| 30 to 34 Years | 0 (0.0%) | 0 (0.0%) |
| 35 to 44 Years | 85 (34.7%) | 0 (0.0%) |
| 45 to 54 Years | 218 (74.1%) | 25 (11.5%) |
| 55 to 59 Years | 171 (77.4%) | 0 (0.0%) |
| 60 to 64 Years | 128 (25.4%) | 0 (0.0%) |
| 65 to 74 Years | 40 (8.3%) | 0 (0.0%) |
| 75 Years and over | 25 (8.3%) | 0 (0.0%) |
| Total | 921 (38.7%) | 118 (12.8%) |
Employment Status by Educational Attainment in Black Canyon City
According to labor force statistics for Black Canyon City, 49.9% of individuals (722) out of the total population between 25 and 64 years of age (1,446) are in the labor force, with 5.4% or 39 of them being unemployed. The group with the highest labor force participation rate are those with the educational attainment of bachelor's degree or higher, with 75.7% or 174 individuals in the labor force. Within the labor force, individuals with high school diploma education have the highest percentage of unemployment, with 21.4% or 39 of them being unemployed.
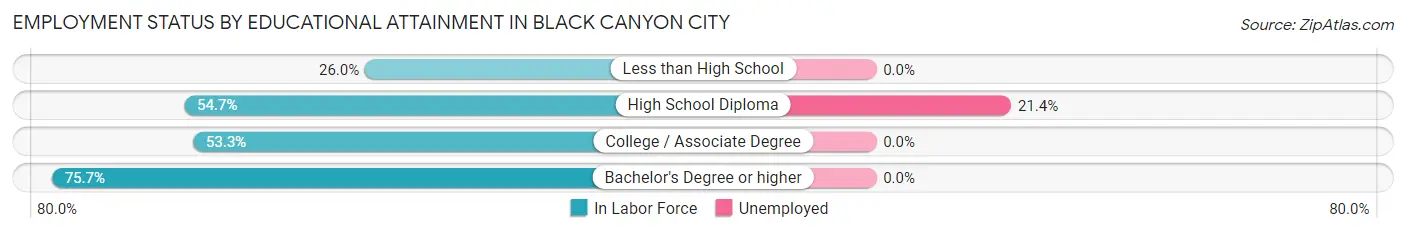
| Educational Attainment | In Labor Force | Unemployed |
| Less than High School | 100 (26.0%) | 0 (0.0%) |
| High School Diploma | 182 (54.7%) | 71 (21.4%) |
| College / Associate Degree | 266 (53.3%) | 0 (0.0%) |
| Bachelor's Degree or higher | 174 (75.7%) | 0 (0.0%) |
| Total | 722 (49.9%) | 78 (5.4%) |
Employment Occupations by Sex in Black Canyon City
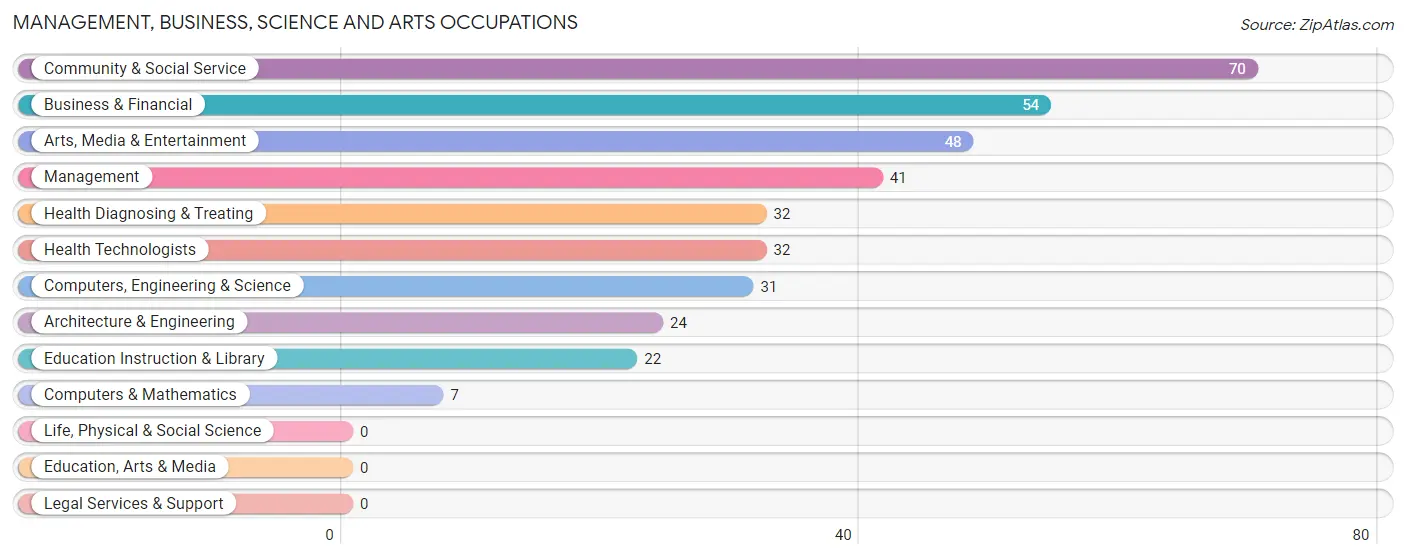
Management, Business, Science and Arts Occupations
The most common Management, Business, Science and Arts occupations in Black Canyon City are Community & Social Service (70 | 8.7%), Business & Financial (54 | 6.7%), Arts, Media & Entertainment (48 | 6.0%), Management (41 | 5.1%), and Health Diagnosing & Treating (32 | 4.0%).
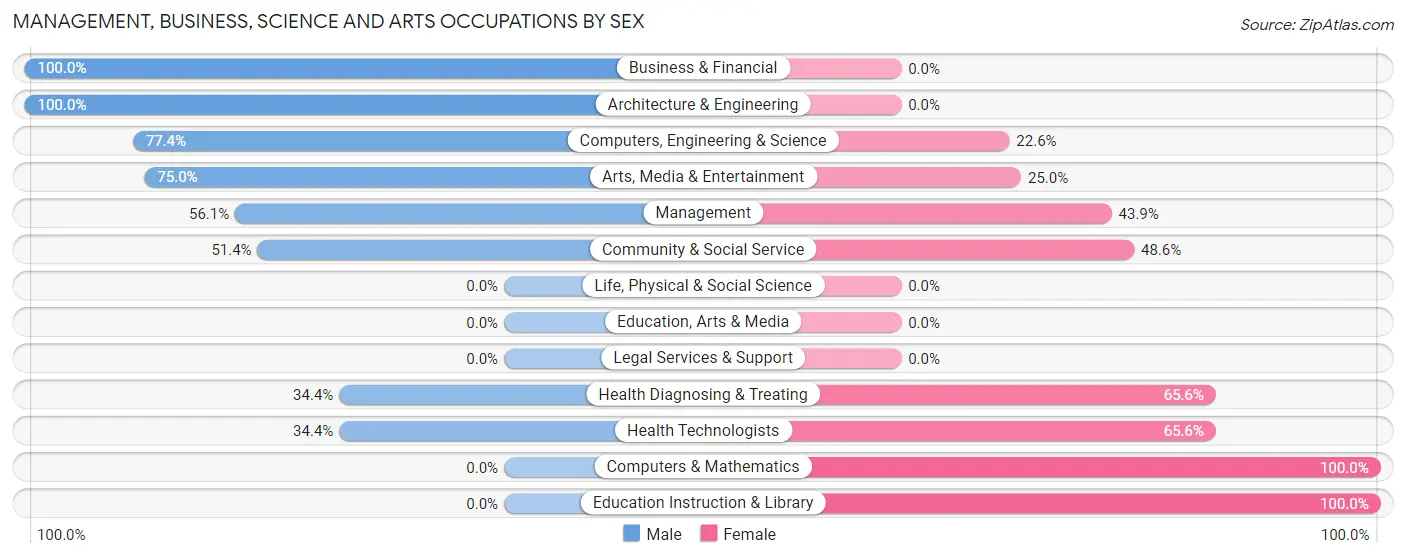
Management, Business, Science and Arts Occupations by Sex
Within the Management, Business, Science and Arts occupations in Black Canyon City, the most male-oriented occupations are Business & Financial (100.0%), Architecture & Engineering (100.0%), and Computers, Engineering & Science (77.4%), while the most female-oriented occupations are Computers & Mathematics (100.0%), Education Instruction & Library (100.0%), and Health Diagnosing & Treating (65.6%).
| Occupation | Male | Female |
| Management | 23 (56.1%) | 18 (43.9%) |
| Business & Financial | 54 (100.0%) | 0 (0.0%) |
| Computers, Engineering & Science | 24 (77.4%) | 7 (22.6%) |
| Computers & Mathematics | 0 (0.0%) | 7 (100.0%) |
| Architecture & Engineering | 24 (100.0%) | 0 (0.0%) |
| Life, Physical & Social Science | 0 (0.0%) | 0 (0.0%) |
| Community & Social Service | 36 (51.4%) | 34 (48.6%) |
| Education, Arts & Media | 0 (0.0%) | 0 (0.0%) |
| Legal Services & Support | 0 (0.0%) | 0 (0.0%) |
| Education Instruction & Library | 0 (0.0%) | 22 (100.0%) |
| Arts, Media & Entertainment | 36 (75.0%) | 12 (25.0%) |
| Health Diagnosing & Treating | 11 (34.4%) | 21 (65.6%) |
| Health Technologists | 11 (34.4%) | 21 (65.6%) |
| Total (Category) | 148 (64.9%) | 80 (35.1%) |
| Total (Overall) | 367 (45.7%) | 436 (54.3%) |
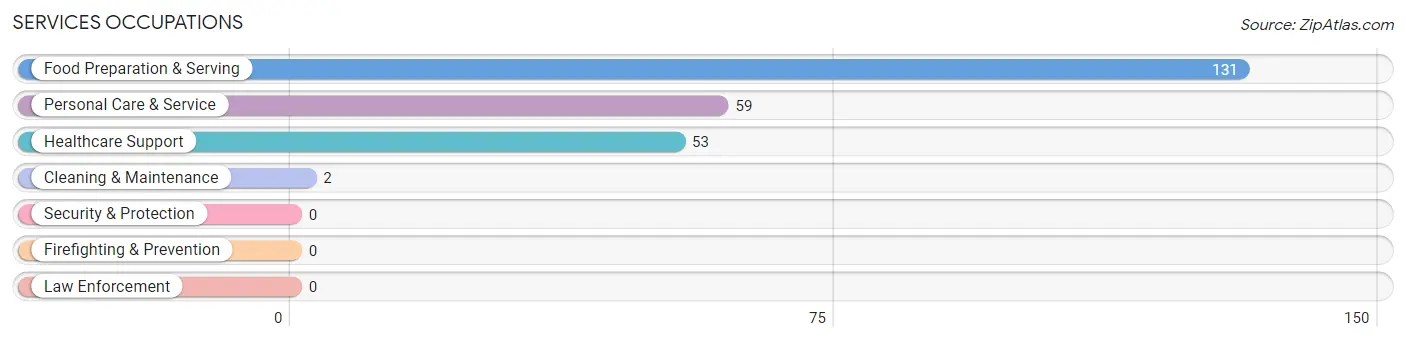
Services Occupations
The most common Services occupations in Black Canyon City are Food Preparation & Serving (131 | 16.3%), Personal Care & Service (59 | 7.3%), Healthcare Support (53 | 6.6%), and Cleaning & Maintenance (2 | 0.3%).
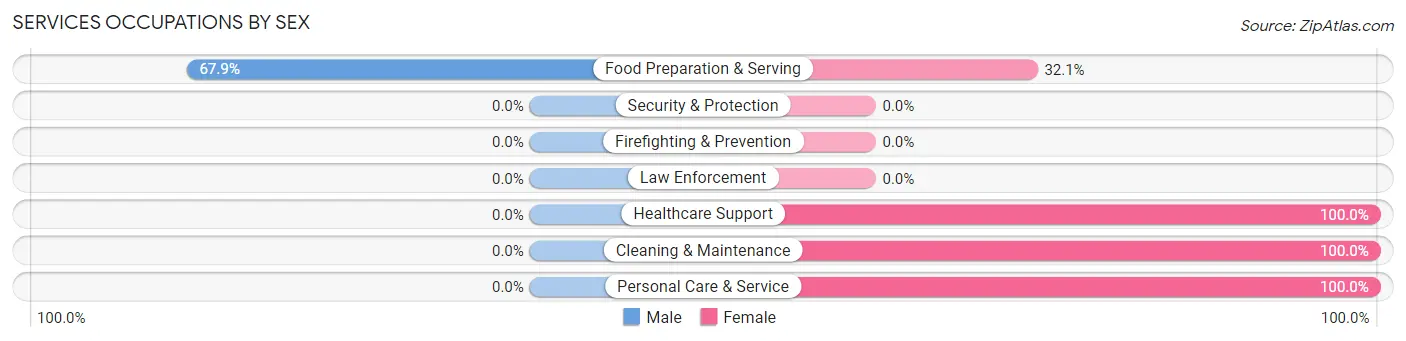
Services Occupations by Sex
| Occupation | Male | Female |
| Healthcare Support | 0 (0.0%) | 53 (100.0%) |
| Security & Protection | 0 (0.0%) | 0 (0.0%) |
| Firefighting & Prevention | 0 (0.0%) | 0 (0.0%) |
| Law Enforcement | 0 (0.0%) | 0 (0.0%) |
| Food Preparation & Serving | 89 (67.9%) | 42 (32.1%) |
| Cleaning & Maintenance | 0 (0.0%) | 2 (100.0%) |
| Personal Care & Service | 0 (0.0%) | 59 (100.0%) |
| Total (Category) | 89 (36.3%) | 156 (63.7%) |
| Total (Overall) | 367 (45.7%) | 436 (54.3%) |
Sales and Office Occupations
The most common Sales and Office occupations in Black Canyon City are Office & Administration (146 | 18.2%), and Sales & Related (75 | 9.3%).
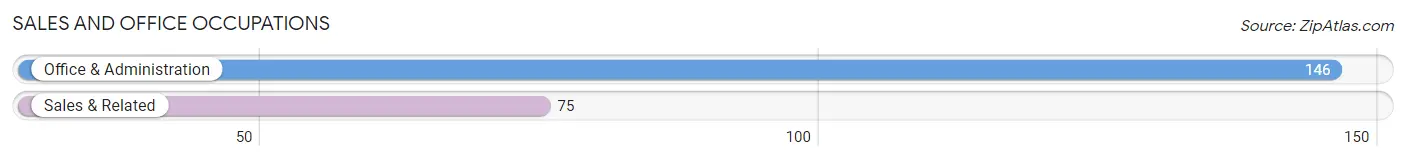
Sales and Office Occupations by Sex
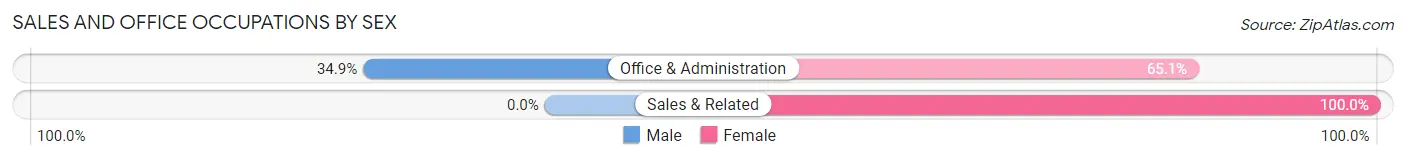
| Occupation | Male | Female |
| Sales & Related | 0 (0.0%) | 75 (100.0%) |
| Office & Administration | 51 (34.9%) | 95 (65.1%) |
| Total (Category) | 51 (23.1%) | 170 (76.9%) |
| Total (Overall) | 367 (45.7%) | 436 (54.3%) |
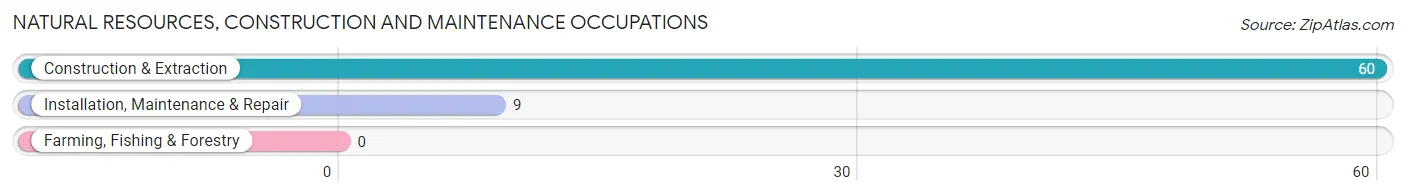
Natural Resources, Construction and Maintenance Occupations
The most common Natural Resources, Construction and Maintenance occupations in Black Canyon City are Construction & Extraction (60 | 7.5%), and Installation, Maintenance & Repair (9 | 1.1%).
Natural Resources, Construction and Maintenance Occupations by Sex
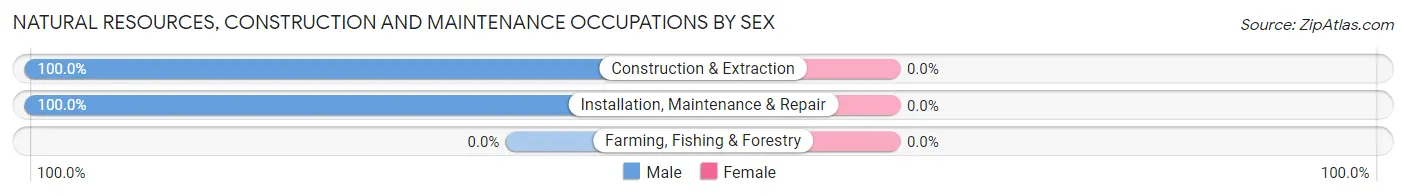
| Occupation | Male | Female |
| Farming, Fishing & Forestry | 0 (0.0%) | 0 (0.0%) |
| Construction & Extraction | 60 (100.0%) | 0 (0.0%) |
| Installation, Maintenance & Repair | 9 (100.0%) | 0 (0.0%) |
| Total (Category) | 69 (100.0%) | 0 (0.0%) |
| Total (Overall) | 367 (45.7%) | 436 (54.3%) |
Production, Transportation and Moving Occupations
The most common Production, Transportation and Moving occupations in Black Canyon City are , and Production (40 | 5.0%).
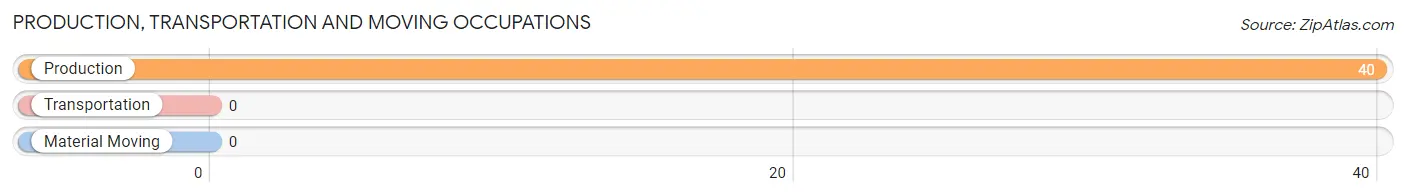
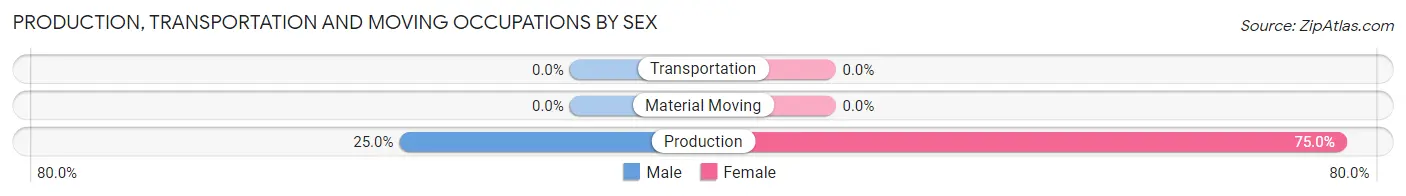
Production, Transportation and Moving Occupations by Sex
| Occupation | Male | Female |
| Production | 10 (25.0%) | 30 (75.0%) |
| Transportation | 0 (0.0%) | 0 (0.0%) |
| Material Moving | 0 (0.0%) | 0 (0.0%) |
| Total (Category) | 10 (25.0%) | 30 (75.0%) |
| Total (Overall) | 367 (45.7%) | 436 (54.3%) |
Employment Industries by Sex in Black Canyon City
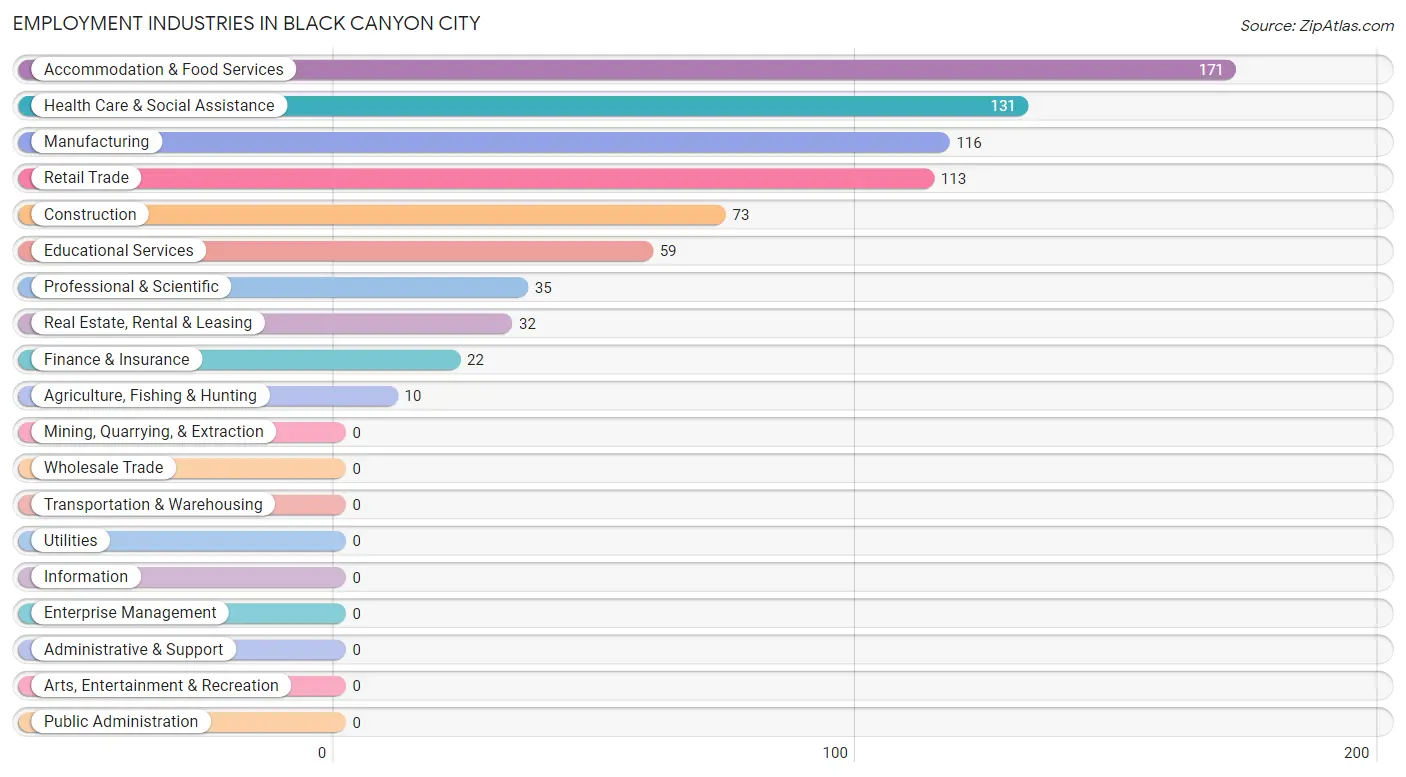
Employment Industries in Black Canyon City
The major employment industries in Black Canyon City include Accommodation & Food Services (171 | 21.3%), Health Care & Social Assistance (131 | 16.3%), Manufacturing (116 | 14.4%), Retail Trade (113 | 14.1%), and Construction (73 | 9.1%).
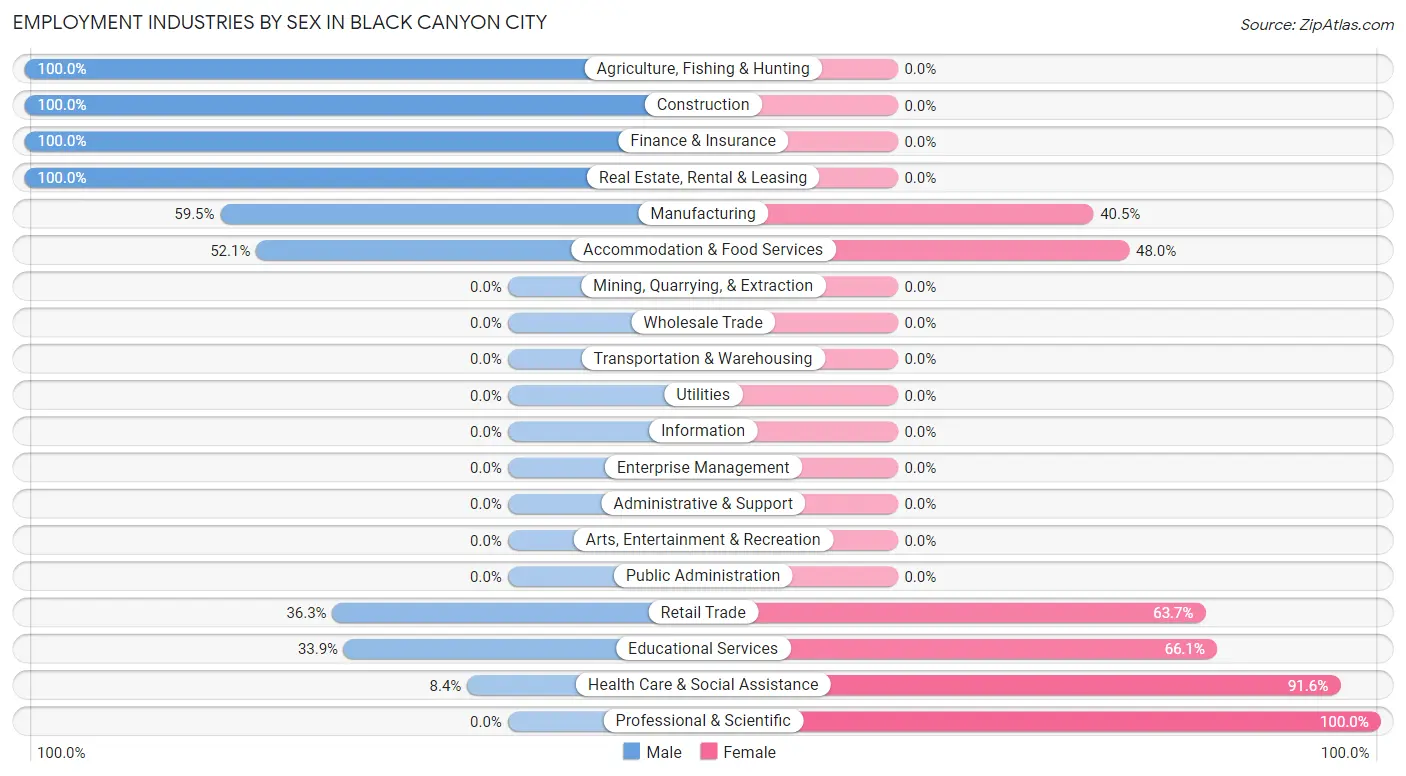
Employment Industries by Sex in Black Canyon City
The Black Canyon City industries that see more men than women are Agriculture, Fishing & Hunting (100.0%), Construction (100.0%), and Finance & Insurance (100.0%), whereas the industries that tend to have a higher number of women are Professional & Scientific (100.0%), Health Care & Social Assistance (91.6%), and Educational Services (66.1%).
| Industry | Male | Female |
| Agriculture, Fishing & Hunting | 10 (100.0%) | 0 (0.0%) |
| Mining, Quarrying, & Extraction | 0 (0.0%) | 0 (0.0%) |
| Construction | 73 (100.0%) | 0 (0.0%) |
| Manufacturing | 69 (59.5%) | 47 (40.5%) |
| Wholesale Trade | 0 (0.0%) | 0 (0.0%) |
| Retail Trade | 41 (36.3%) | 72 (63.7%) |
| Transportation & Warehousing | 0 (0.0%) | 0 (0.0%) |
| Utilities | 0 (0.0%) | 0 (0.0%) |
| Information | 0 (0.0%) | 0 (0.0%) |
| Finance & Insurance | 22 (100.0%) | 0 (0.0%) |
| Real Estate, Rental & Leasing | 32 (100.0%) | 0 (0.0%) |
| Professional & Scientific | 0 (0.0%) | 35 (100.0%) |
| Enterprise Management | 0 (0.0%) | 0 (0.0%) |
| Administrative & Support | 0 (0.0%) | 0 (0.0%) |
| Educational Services | 20 (33.9%) | 39 (66.1%) |
| Health Care & Social Assistance | 11 (8.4%) | 120 (91.6%) |
| Arts, Entertainment & Recreation | 0 (0.0%) | 0 (0.0%) |
| Accommodation & Food Services | 89 (52.0%) | 82 (47.9%) |
| Public Administration | 0 (0.0%) | 0 (0.0%) |
| Total | 367 (45.7%) | 436 (54.3%) |
Education in Black Canyon City
School Enrollment in Black Canyon City
The most common levels of schooling among the 193 students in Black Canyon City are high school (96 | 49.7%), college / undergraduate (69 | 35.7%), and middle school (28 | 14.5%).
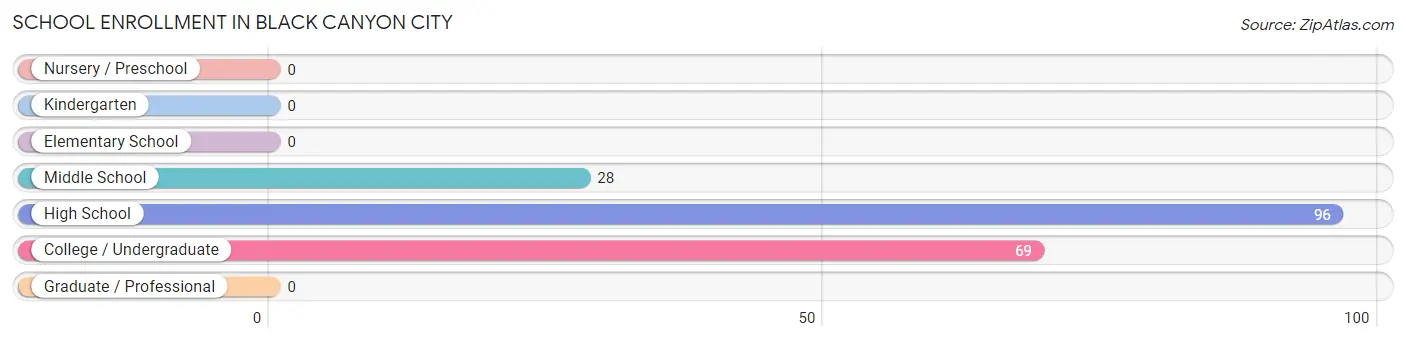
| School Level | # Students | % Students |
| Nursery / Preschool | 0 | 0.0% |
| Kindergarten | 0 | 0.0% |
| Elementary School | 0 | 0.0% |
| Middle School | 28 | 14.5% |
| High School | 96 | 49.7% |
| College / Undergraduate | 69 | 35.7% |
| Graduate / Professional | 0 | 0.0% |
| Total | 193 | 100.0% |
School Enrollment by Age by Funding Source in Black Canyon City
Out of a total of 193 students who are enrolled in schools in Black Canyon City, 82 (42.5%) attend a private institution, while the remaining 111 (57.5%) are enrolled in public schools. The age group of 35 years and over has the highest likelihood of being enrolled in private schools, with 82 (71.3% in the age bracket) enrolled. Conversely, the age group of 10 to 14 year olds has the lowest likelihood of being enrolled in a private school, with 28 (100.0% in the age bracket) attending a public institution.
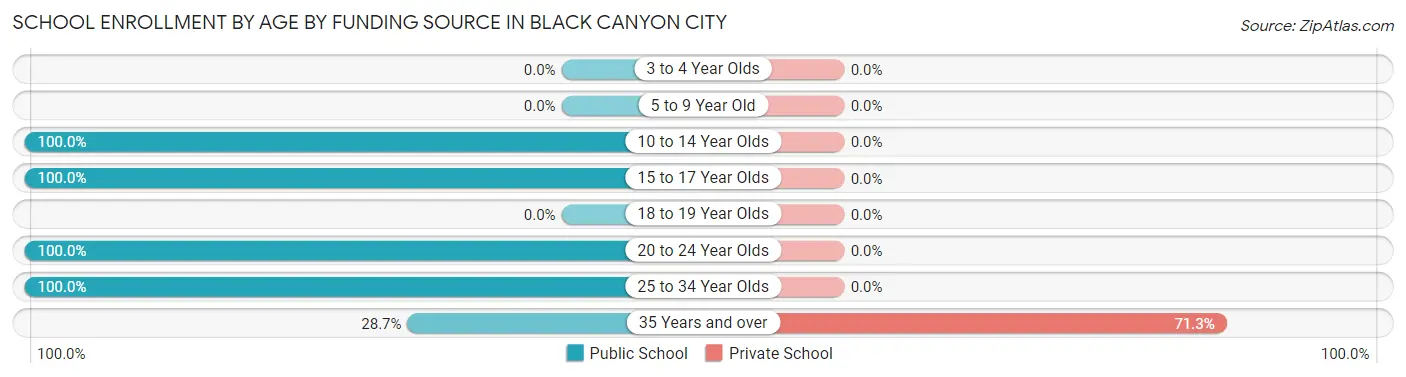
| Age Bracket | Public School | Private School |
| 3 to 4 Year Olds | 0 (0.0%) | 0 (0.0%) |
| 5 to 9 Year Old | 0 (0.0%) | 0 (0.0%) |
| 10 to 14 Year Olds | 28 (100.0%) | 0 (0.0%) |
| 15 to 17 Year Olds | 14 (100.0%) | 0 (0.0%) |
| 18 to 19 Year Olds | 0 (0.0%) | 0 (0.0%) |
| 20 to 24 Year Olds | 12 (100.0%) | 0 (0.0%) |
| 25 to 34 Year Olds | 24 (100.0%) | 0 (0.0%) |
| 35 Years and over | 33 (28.7%) | 82 (71.3%) |
| Total | 111 (57.5%) | 82 (42.5%) |
Educational Attainment by Field of Study in Black Canyon City
Arts & humanities (103 | 25.9%), business (82 | 20.6%), science & technology (43 | 10.8%), social sciences (42 | 10.5%), and psychology (35 | 8.8%) are the most common fields of study among 398 individuals in Black Canyon City who have obtained a bachelor's degree or higher.
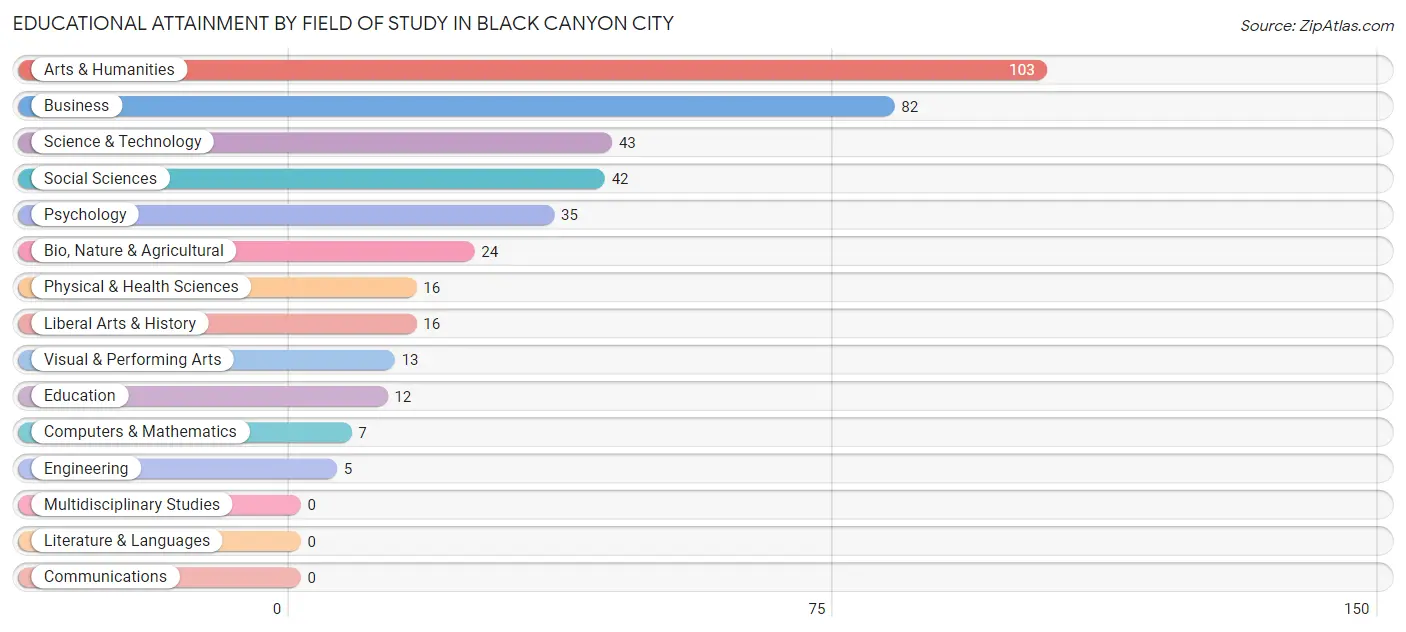
| Field of Study | # Graduates | % Graduates |
| Computers & Mathematics | 7 | 1.8% |
| Bio, Nature & Agricultural | 24 | 6.0% |
| Physical & Health Sciences | 16 | 4.0% |
| Psychology | 35 | 8.8% |
| Social Sciences | 42 | 10.5% |
| Engineering | 5 | 1.3% |
| Multidisciplinary Studies | 0 | 0.0% |
| Science & Technology | 43 | 10.8% |
| Business | 82 | 20.6% |
| Education | 12 | 3.0% |
| Literature & Languages | 0 | 0.0% |
| Liberal Arts & History | 16 | 4.0% |
| Visual & Performing Arts | 13 | 3.3% |
| Communications | 0 | 0.0% |
| Arts & Humanities | 103 | 25.9% |
| Total | 398 | 100.0% |
Transportation & Commute in Black Canyon City
Vehicle Availability by Sex in Black Canyon City
The most prevalent vehicle ownership categories in Black Canyon City are males with 3 vehicles (191, accounting for 57.7%) and females with 3 vehicles (135, making up 44.1%).
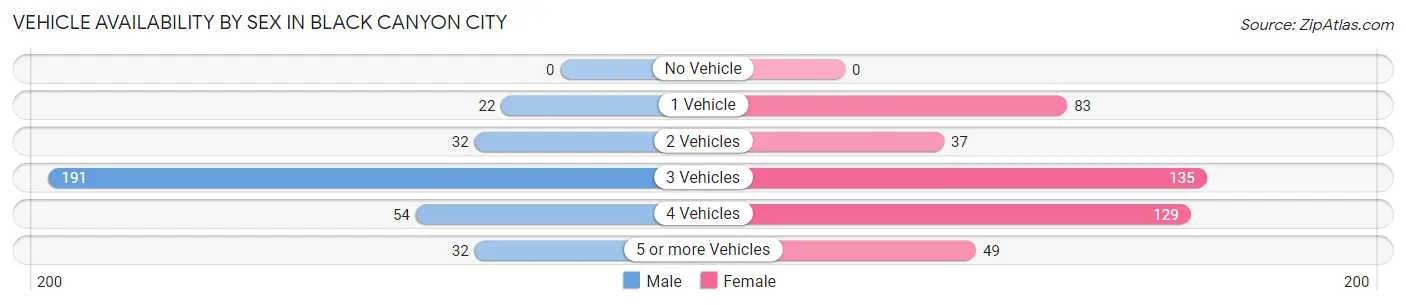
| Vehicles Available | Male | Female |
| No Vehicle | 0 (0.0%) | 0 (0.0%) |
| 1 Vehicle | 22 (6.7%) | 83 (19.2%) |
| 2 Vehicles | 32 (9.7%) | 37 (8.6%) |
| 3 Vehicles | 191 (57.7%) | 135 (31.2%) |
| 4 Vehicles | 54 (16.3%) | 129 (29.8%) |
| 5 or more Vehicles | 32 (9.7%) | 49 (11.3%) |
| Total | 331 (100.0%) | 433 (100.0%) |
Commute Time in Black Canyon City
The most frequently occuring commute durations in Black Canyon City are 20 to 24 minutes (136 commuters, 22.5%), 45 to 59 minutes (94 commuters, 15.6%), and 60 to 89 minutes (59 commuters, 9.8%).
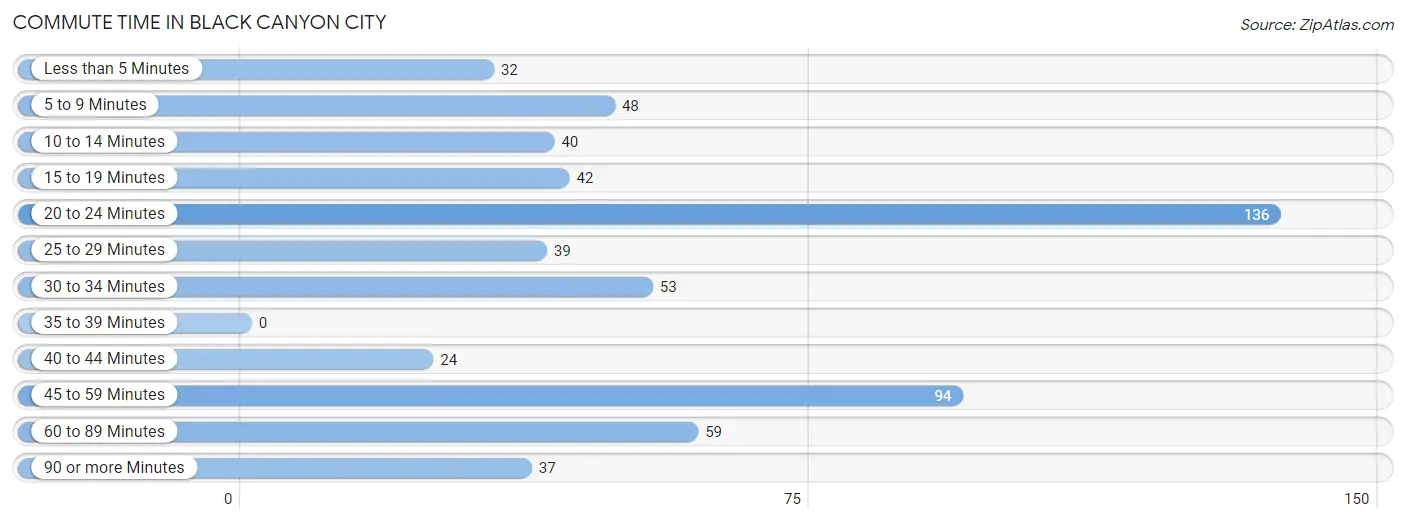
| Commute Time | # Commuters | % Commuters |
| Less than 5 Minutes | 32 | 5.3% |
| 5 to 9 Minutes | 48 | 8.0% |
| 10 to 14 Minutes | 40 | 6.6% |
| 15 to 19 Minutes | 42 | 7.0% |
| 20 to 24 Minutes | 136 | 22.5% |
| 25 to 29 Minutes | 39 | 6.5% |
| 30 to 34 Minutes | 53 | 8.8% |
| 35 to 39 Minutes | 0 | 0.0% |
| 40 to 44 Minutes | 24 | 4.0% |
| 45 to 59 Minutes | 94 | 15.6% |
| 60 to 89 Minutes | 59 | 9.8% |
| 90 or more Minutes | 37 | 6.1% |
Commute Time by Sex in Black Canyon City
The most common commute times in Black Canyon City are 20 to 24 minutes (84 commuters, 29.7%) for males and 45 to 59 minutes (62 commuters, 19.3%) for females.
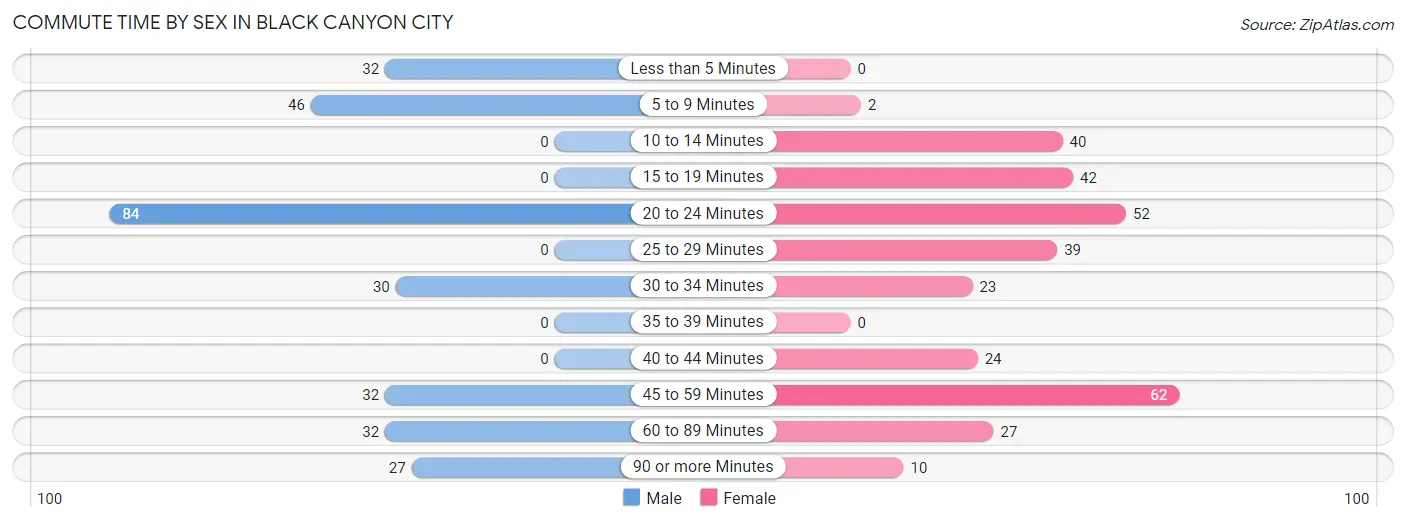
| Commute Time | Male | Female |
| Less than 5 Minutes | 32 (11.3%) | 0 (0.0%) |
| 5 to 9 Minutes | 46 (16.3%) | 2 (0.6%) |
| 10 to 14 Minutes | 0 (0.0%) | 40 (12.5%) |
| 15 to 19 Minutes | 0 (0.0%) | 42 (13.1%) |
| 20 to 24 Minutes | 84 (29.7%) | 52 (16.2%) |
| 25 to 29 Minutes | 0 (0.0%) | 39 (12.1%) |
| 30 to 34 Minutes | 30 (10.6%) | 23 (7.2%) |
| 35 to 39 Minutes | 0 (0.0%) | 0 (0.0%) |
| 40 to 44 Minutes | 0 (0.0%) | 24 (7.5%) |
| 45 to 59 Minutes | 32 (11.3%) | 62 (19.3%) |
| 60 to 89 Minutes | 32 (11.3%) | 27 (8.4%) |
| 90 or more Minutes | 27 (9.5%) | 10 (3.1%) |
Time of Departure to Work by Sex in Black Canyon City
The most frequent times of departure to work in Black Canyon City are 5:00 AM to 5:29 AM (87, 30.7%) for males and 6:00 AM to 6:29 AM (130, 40.5%) for females.
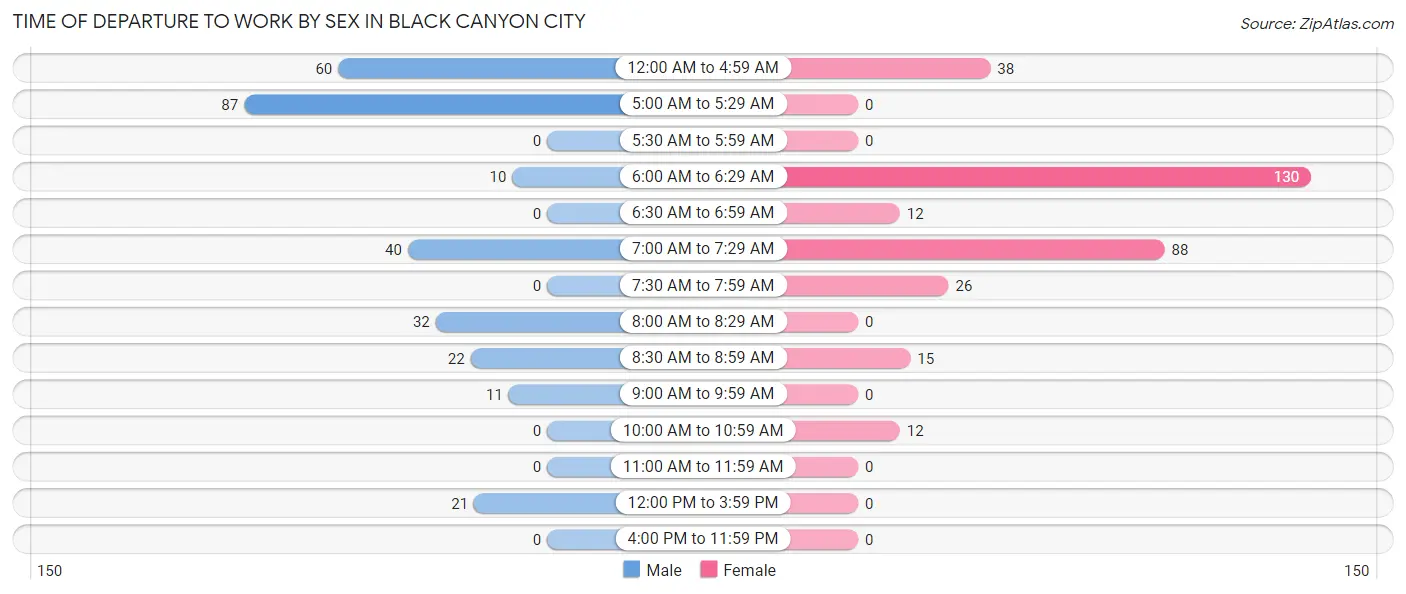
| Time of Departure | Male | Female |
| 12:00 AM to 4:59 AM | 60 (21.2%) | 38 (11.8%) |
| 5:00 AM to 5:29 AM | 87 (30.7%) | 0 (0.0%) |
| 5:30 AM to 5:59 AM | 0 (0.0%) | 0 (0.0%) |
| 6:00 AM to 6:29 AM | 10 (3.5%) | 130 (40.5%) |
| 6:30 AM to 6:59 AM | 0 (0.0%) | 12 (3.7%) |
| 7:00 AM to 7:29 AM | 40 (14.1%) | 88 (27.4%) |
| 7:30 AM to 7:59 AM | 0 (0.0%) | 26 (8.1%) |
| 8:00 AM to 8:29 AM | 32 (11.3%) | 0 (0.0%) |
| 8:30 AM to 8:59 AM | 22 (7.8%) | 15 (4.7%) |
| 9:00 AM to 9:59 AM | 11 (3.9%) | 0 (0.0%) |
| 10:00 AM to 10:59 AM | 0 (0.0%) | 12 (3.7%) |
| 11:00 AM to 11:59 AM | 0 (0.0%) | 0 (0.0%) |
| 12:00 PM to 3:59 PM | 21 (7.4%) | 0 (0.0%) |
| 4:00 PM to 11:59 PM | 0 (0.0%) | 0 (0.0%) |
| Total | 283 (100.0%) | 321 (100.0%) |
Housing Occupancy in Black Canyon City
Occupancy by Ownership in Black Canyon City
Of the total 1,179 dwellings in Black Canyon City, owner-occupied units account for 1,023 (86.8%), while renter-occupied units make up 156 (13.2%).
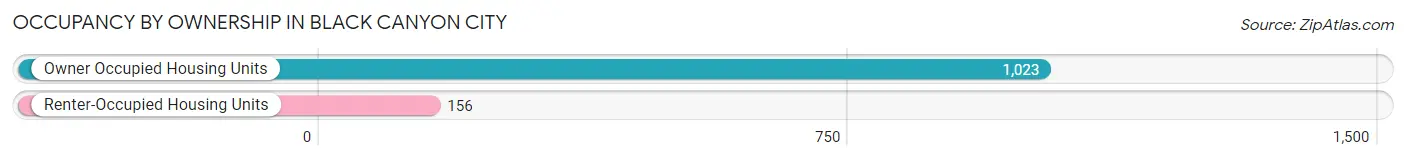
| Occupancy | # Housing Units | % Housing Units |
| Owner Occupied Housing Units | 1,023 | 86.8% |
| Renter-Occupied Housing Units | 156 | 13.2% |
| Total Occupied Housing Units | 1,179 | 100.0% |
Occupancy by Household Size in Black Canyon City
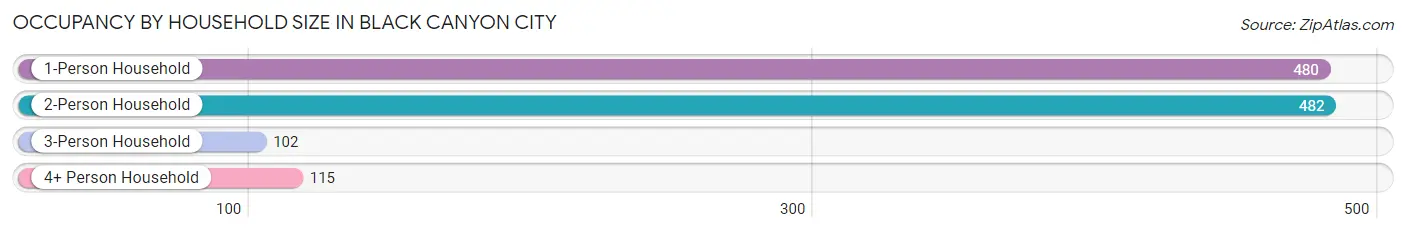
| Household Size | # Housing Units | % Housing Units |
| 1-Person Household | 480 | 40.7% |
| 2-Person Household | 482 | 40.9% |
| 3-Person Household | 102 | 8.6% |
| 4+ Person Household | 115 | 9.8% |
| Total Housing Units | 1,179 | 100.0% |
Occupancy by Ownership by Household Size in Black Canyon City
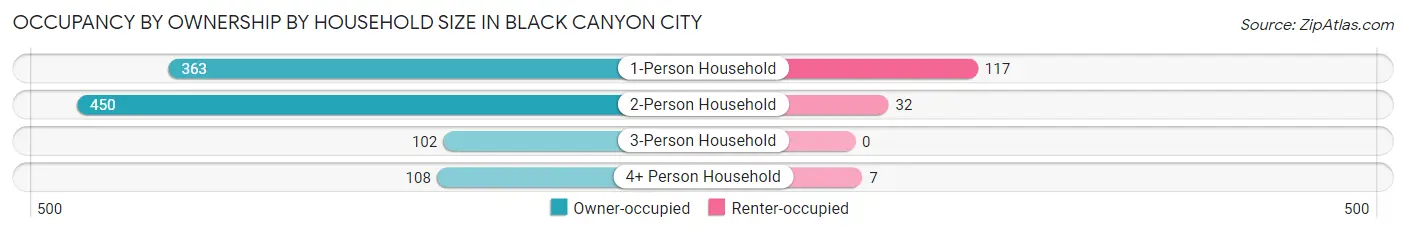
| Household Size | Owner-occupied | Renter-occupied |
| 1-Person Household | 363 (75.6%) | 117 (24.4%) |
| 2-Person Household | 450 (93.4%) | 32 (6.6%) |
| 3-Person Household | 102 (100.0%) | 0 (0.0%) |
| 4+ Person Household | 108 (93.9%) | 7 (6.1%) |
| Total Housing Units | 1,023 (86.8%) | 156 (13.2%) |
Occupancy by Educational Attainment in Black Canyon City
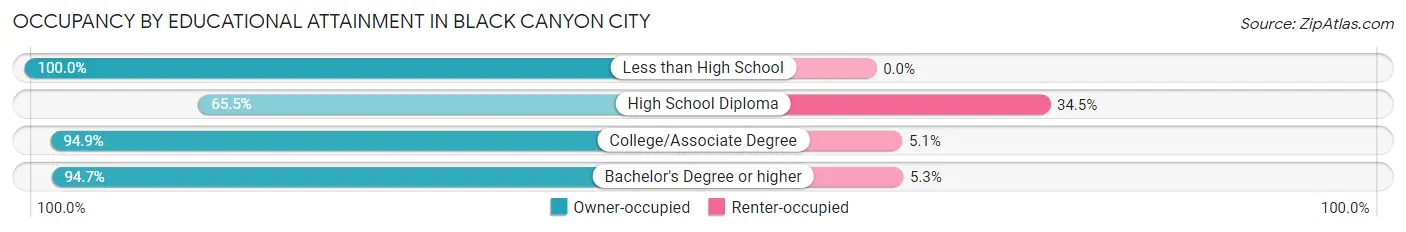
| Household Size | Owner-occupied | Renter-occupied |
| Less than High School | 155 (100.0%) | 0 (0.0%) |
| High School Diploma | 230 (65.5%) | 121 (34.5%) |
| College/Associate Degree | 407 (94.9%) | 22 (5.1%) |
| Bachelor's Degree or higher | 231 (94.7%) | 13 (5.3%) |
Occupancy by Age of Householder in Black Canyon City
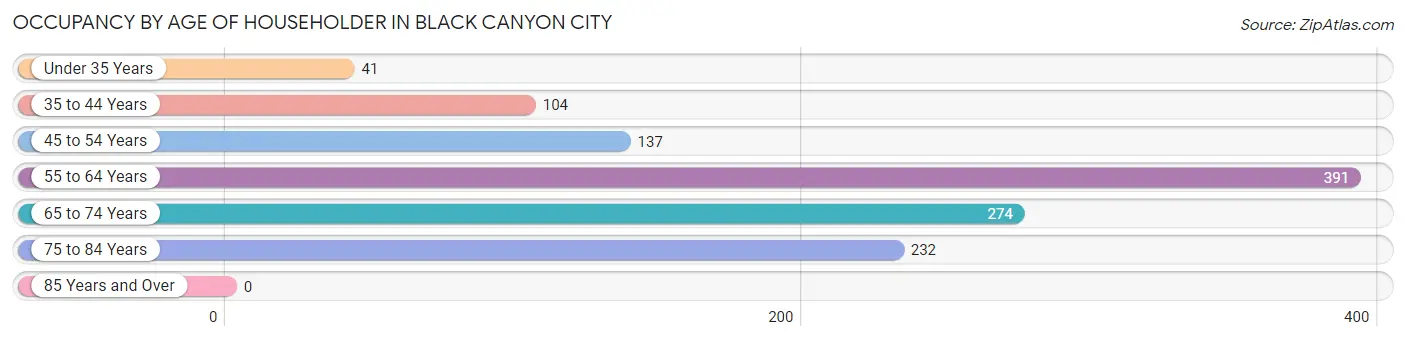
| Age Bracket | # Households | % Households |
| Under 35 Years | 41 | 3.5% |
| 35 to 44 Years | 104 | 8.8% |
| 45 to 54 Years | 137 | 11.6% |
| 55 to 64 Years | 391 | 33.2% |
| 65 to 74 Years | 274 | 23.2% |
| 75 to 84 Years | 232 | 19.7% |
| 85 Years and Over | 0 | 0.0% |
| Total | 1,179 | 100.0% |
Housing Finances in Black Canyon City
Median Income by Occupancy in Black Canyon City
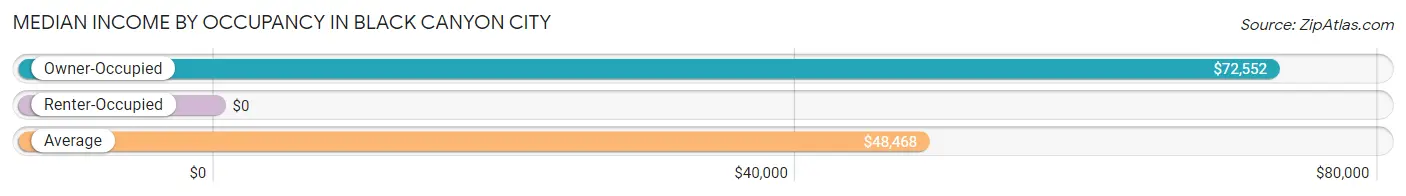
| Occupancy Type | # Households | Median Income |
| Owner-Occupied | 1,023 (86.8%) | $72,552 |
| Renter-Occupied | 156 (13.2%) | $0 |
| Average | 1,179 (100.0%) | $48,468 |
Occupancy by Householder Income Bracket in Black Canyon City
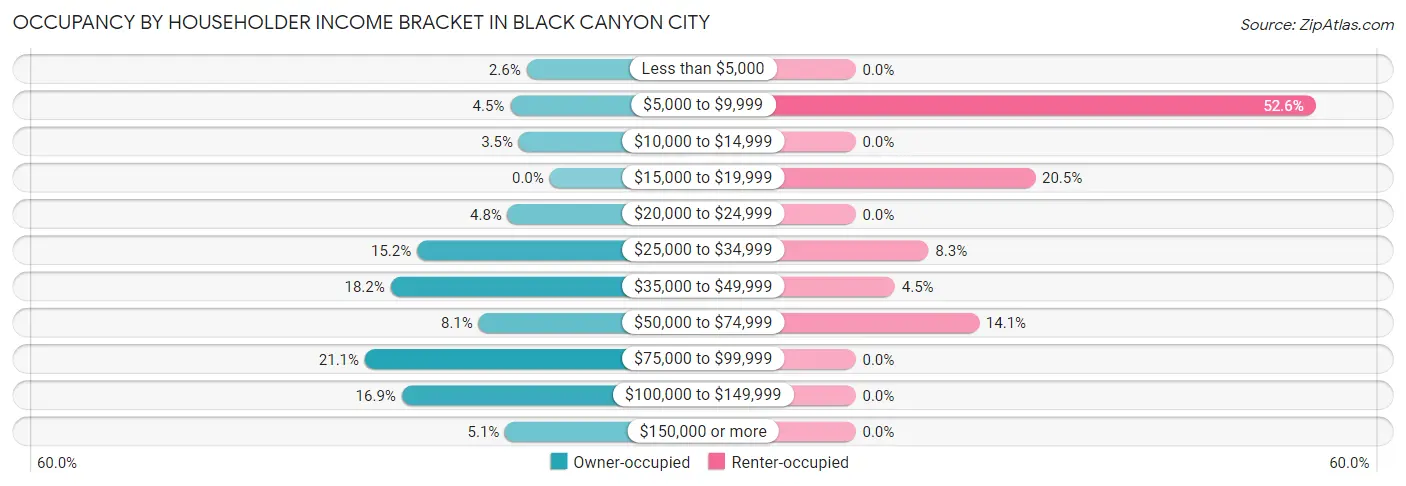
| Income Bracket | Owner-occupied | Renter-occupied |
| Less than $5,000 | 27 (2.6%) | 0 (0.0%) |
| $5,000 to $9,999 | 46 (4.5%) | 82 (52.6%) |
| $10,000 to $14,999 | 36 (3.5%) | 0 (0.0%) |
| $15,000 to $19,999 | 0 (0.0%) | 32 (20.5%) |
| $20,000 to $24,999 | 49 (4.8%) | 0 (0.0%) |
| $25,000 to $34,999 | 155 (15.1%) | 13 (8.3%) |
| $35,000 to $49,999 | 186 (18.2%) | 7 (4.5%) |
| $50,000 to $74,999 | 83 (8.1%) | 22 (14.1%) |
| $75,000 to $99,999 | 216 (21.1%) | 0 (0.0%) |
| $100,000 to $149,999 | 173 (16.9%) | 0 (0.0%) |
| $150,000 or more | 52 (5.1%) | 0 (0.0%) |
| Total | 1,023 (100.0%) | 156 (100.0%) |
Monthly Housing Cost Tiers in Black Canyon City
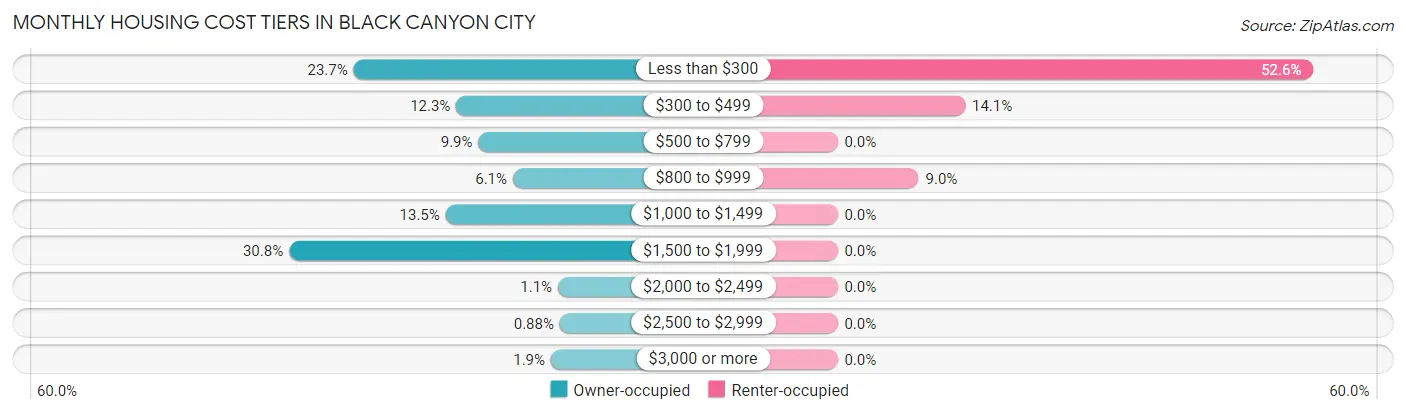
| Monthly Cost | Owner-occupied | Renter-occupied |
| Less than $300 | 242 (23.7%) | 82 (52.6%) |
| $300 to $499 | 126 (12.3%) | 22 (14.1%) |
| $500 to $799 | 101 (9.9%) | 0 (0.0%) |
| $800 to $999 | 62 (6.1%) | 14 (9.0%) |
| $1,000 to $1,499 | 138 (13.5%) | 0 (0.0%) |
| $1,500 to $1,999 | 315 (30.8%) | 0 (0.0%) |
| $2,000 to $2,499 | 11 (1.1%) | 0 (0.0%) |
| $2,500 to $2,999 | 9 (0.9%) | 0 (0.0%) |
| $3,000 or more | 19 (1.9%) | 0 (0.0%) |
| Total | 1,023 (100.0%) | 156 (100.0%) |
Physical Housing Characteristics in Black Canyon City
Housing Structures in Black Canyon City
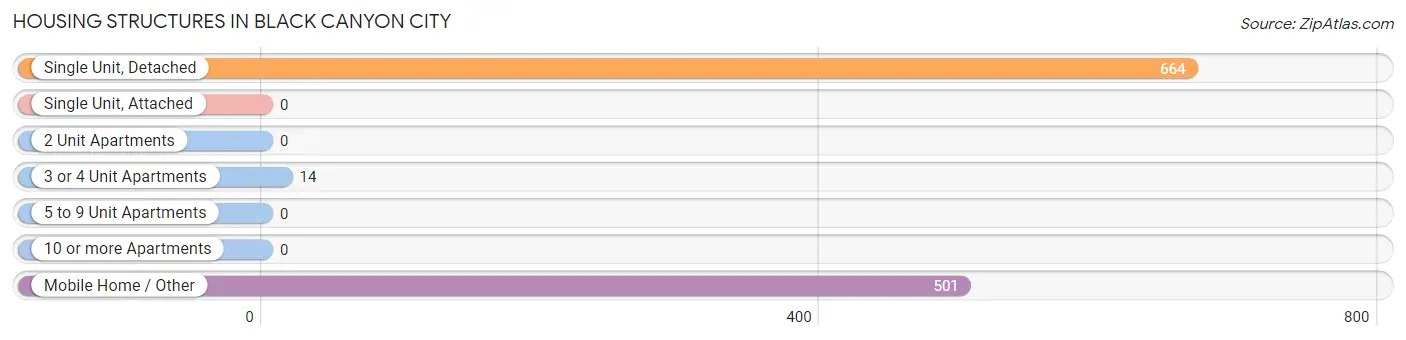
| Structure Type | # Housing Units | % Housing Units |
| Single Unit, Detached | 664 | 56.3% |
| Single Unit, Attached | 0 | 0.0% |
| 2 Unit Apartments | 0 | 0.0% |
| 3 or 4 Unit Apartments | 14 | 1.2% |
| 5 to 9 Unit Apartments | 0 | 0.0% |
| 10 or more Apartments | 0 | 0.0% |
| Mobile Home / Other | 501 | 42.5% |
| Total | 1,179 | 100.0% |
Housing Structures by Occupancy in Black Canyon City
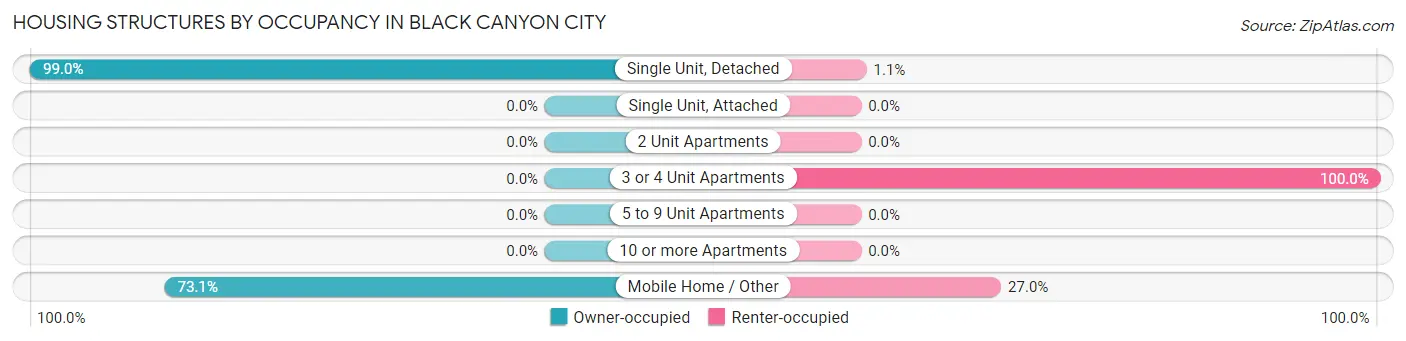
| Structure Type | Owner-occupied | Renter-occupied |
| Single Unit, Detached | 657 (99.0%) | 7 (1.1%) |
| Single Unit, Attached | 0 (0.0%) | 0 (0.0%) |
| 2 Unit Apartments | 0 (0.0%) | 0 (0.0%) |
| 3 or 4 Unit Apartments | 0 (0.0%) | 14 (100.0%) |
| 5 to 9 Unit Apartments | 0 (0.0%) | 0 (0.0%) |
| 10 or more Apartments | 0 (0.0%) | 0 (0.0%) |
| Mobile Home / Other | 366 (73.1%) | 135 (27.0%) |
| Total | 1,023 (86.8%) | 156 (13.2%) |
Housing Structures by Number of Rooms in Black Canyon City
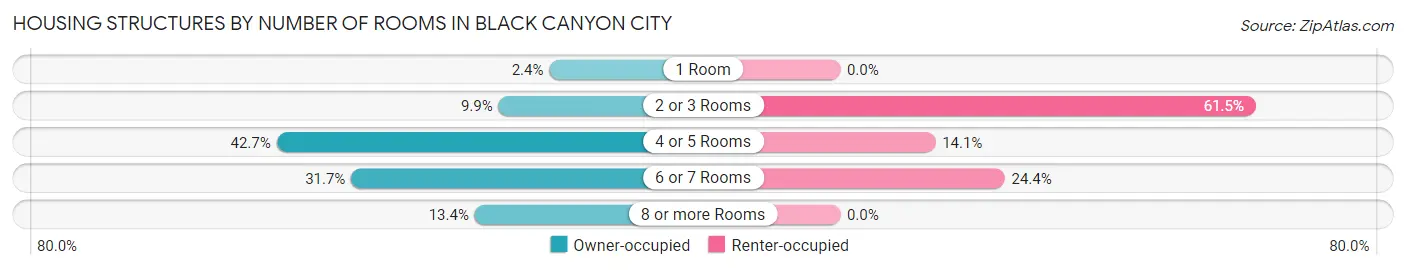
| Number of Rooms | Owner-occupied | Renter-occupied |
| 1 Room | 24 (2.4%) | 0 (0.0%) |
| 2 or 3 Rooms | 101 (9.9%) | 96 (61.5%) |
| 4 or 5 Rooms | 437 (42.7%) | 22 (14.1%) |
| 6 or 7 Rooms | 324 (31.7%) | 38 (24.4%) |
| 8 or more Rooms | 137 (13.4%) | 0 (0.0%) |
| Total | 1,023 (100.0%) | 156 (100.0%) |
Housing Structure by Heating Type in Black Canyon City
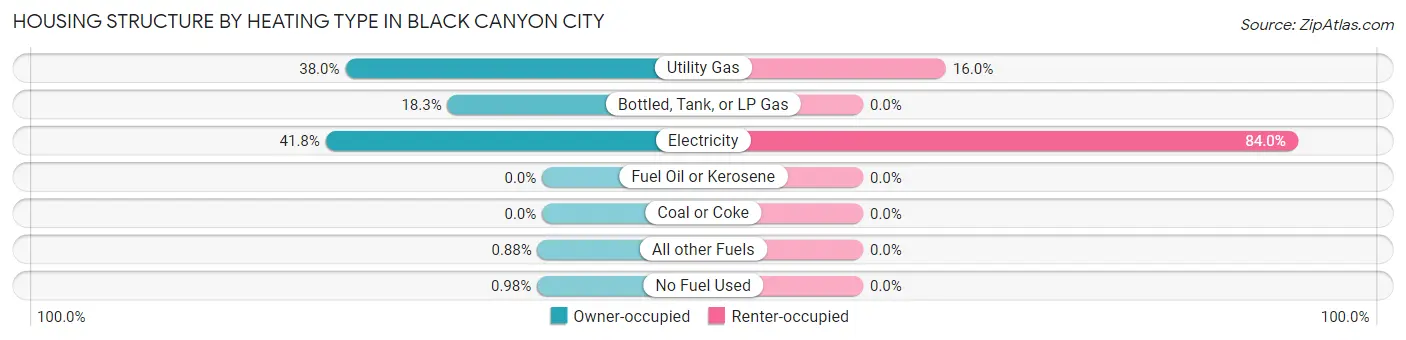
| Heating Type | Owner-occupied | Renter-occupied |
| Utility Gas | 389 (38.0%) | 25 (16.0%) |
| Bottled, Tank, or LP Gas | 187 (18.3%) | 0 (0.0%) |
| Electricity | 428 (41.8%) | 131 (84.0%) |
| Fuel Oil or Kerosene | 0 (0.0%) | 0 (0.0%) |
| Coal or Coke | 0 (0.0%) | 0 (0.0%) |
| All other Fuels | 9 (0.9%) | 0 (0.0%) |
| No Fuel Used | 10 (1.0%) | 0 (0.0%) |
| Total | 1,023 (100.0%) | 156 (100.0%) |
Household Vehicle Usage in Black Canyon City
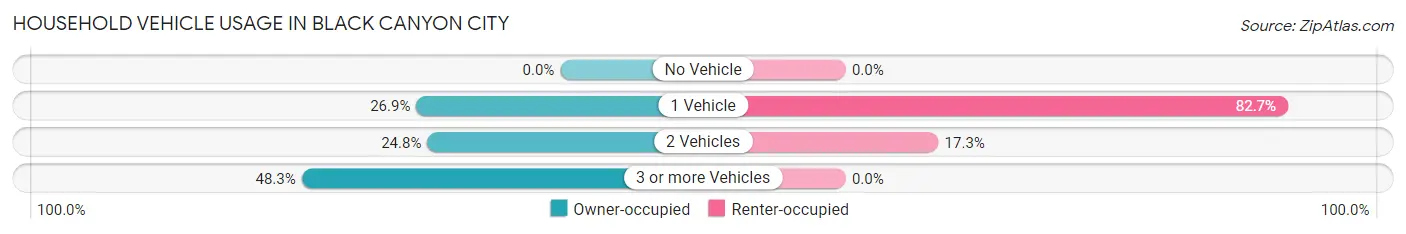
| Vehicles per Household | Owner-occupied | Renter-occupied |
| No Vehicle | 0 (0.0%) | 0 (0.0%) |
| 1 Vehicle | 275 (26.9%) | 129 (82.7%) |
| 2 Vehicles | 254 (24.8%) | 27 (17.3%) |
| 3 or more Vehicles | 494 (48.3%) | 0 (0.0%) |
| Total | 1,023 (100.0%) | 156 (100.0%) |
Real Estate & Mortgages in Black Canyon City
Real Estate and Mortgage Overview in Black Canyon City
| Characteristic | Without Mortgage | With Mortgage |
| Housing Units | 392 | 631 |
| Median Property Value | $204,600 | $270,300 |
| Median Household Income | $39,722 | $37 |
| Monthly Housing Costs | $247 | $19 |
| Real Estate Taxes | $760 | $11 |
Property Value by Mortgage Status in Black Canyon City
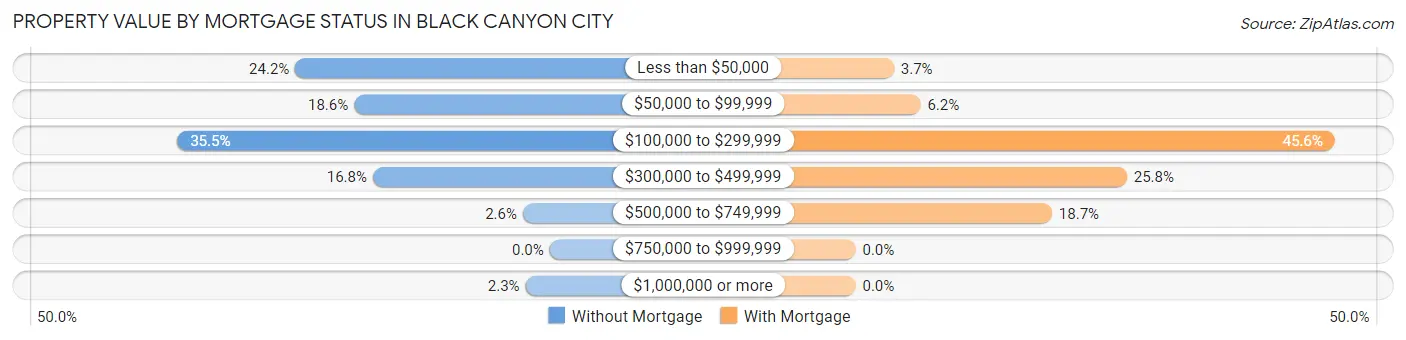
| Property Value | Without Mortgage | With Mortgage |
| Less than $50,000 | 95 (24.2%) | 23 (3.6%) |
| $50,000 to $99,999 | 73 (18.6%) | 39 (6.2%) |
| $100,000 to $299,999 | 139 (35.5%) | 288 (45.6%) |
| $300,000 to $499,999 | 66 (16.8%) | 163 (25.8%) |
| $500,000 to $749,999 | 10 (2.5%) | 118 (18.7%) |
| $750,000 to $999,999 | 0 (0.0%) | 0 (0.0%) |
| $1,000,000 or more | 9 (2.3%) | 0 (0.0%) |
| Total | 392 (100.0%) | 631 (100.0%) |
Household Income by Mortgage Status in Black Canyon City
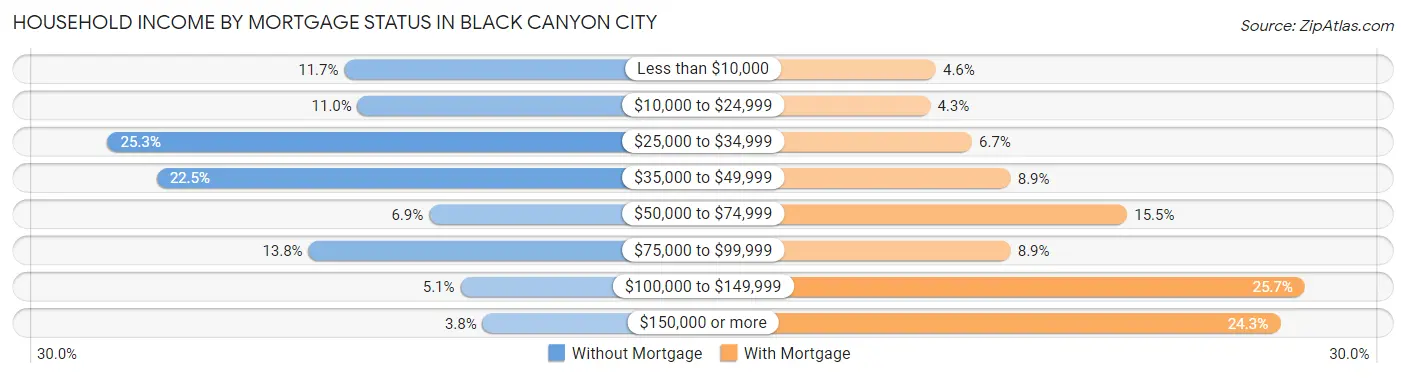
| Household Income | Without Mortgage | With Mortgage |
| Less than $10,000 | 46 (11.7%) | 29 (4.6%) |
| $10,000 to $24,999 | 43 (11.0%) | 27 (4.3%) |
| $25,000 to $34,999 | 99 (25.3%) | 42 (6.7%) |
| $35,000 to $49,999 | 88 (22.5%) | 56 (8.9%) |
| $50,000 to $74,999 | 27 (6.9%) | 98 (15.5%) |
| $75,000 to $99,999 | 54 (13.8%) | 56 (8.9%) |
| $100,000 to $149,999 | 20 (5.1%) | 162 (25.7%) |
| $150,000 or more | 15 (3.8%) | 153 (24.2%) |
| Total | 392 (100.0%) | 631 (100.0%) |
Property Value to Household Income Ratio in Black Canyon City
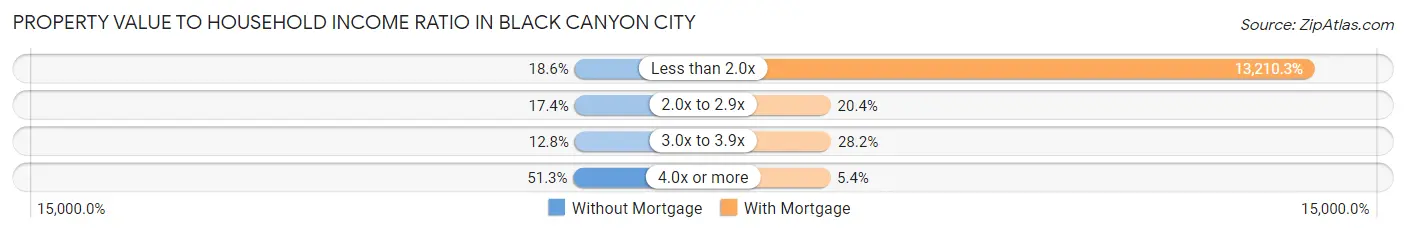
| Value-to-Income Ratio | Without Mortgage | With Mortgage |
| Less than 2.0x | 73 (18.6%) | 83,357 (13,210.3%) |
| 2.0x to 2.9x | 68 (17.3%) | 129 (20.4%) |
| 3.0x to 3.9x | 50 (12.8%) | 178 (28.2%) |
| 4.0x or more | 201 (51.3%) | 34 (5.4%) |
| Total | 392 (100.0%) | 631 (100.0%) |
Real Estate Taxes by Mortgage Status in Black Canyon City
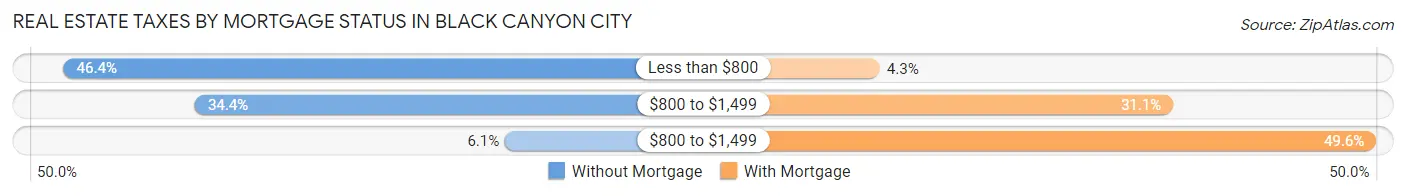
| Property Taxes | Without Mortgage | With Mortgage |
| Less than $800 | 182 (46.4%) | 27 (4.3%) |
| $800 to $1,499 | 135 (34.4%) | 196 (31.1%) |
| $800 to $1,499 | 24 (6.1%) | 313 (49.6%) |
| Total | 392 (100.0%) | 631 (100.0%) |
Health & Disability in Black Canyon City
Health Insurance Coverage by Age in Black Canyon City
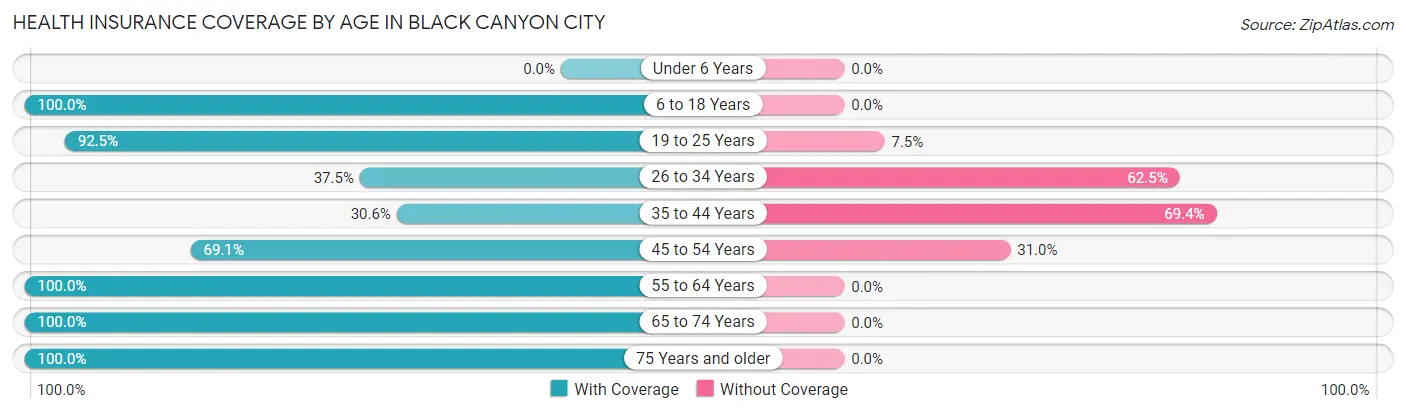
| Age Bracket | With Coverage | Without Coverage |
| Under 6 Years | 0 (0.0%) | 0 (0.0%) |
| 6 to 18 Years | 63 (100.0%) | 0 (0.0%) |
| 19 to 25 Years | 148 (92.5%) | 12 (7.5%) |
| 26 to 34 Years | 51 (37.5%) | 85 (62.5%) |
| 35 to 44 Years | 75 (30.6%) | 170 (69.4%) |
| 45 to 54 Years | 203 (69.1%) | 91 (30.9%) |
| 55 to 64 Years | 725 (100.0%) | 0 (0.0%) |
| 65 to 74 Years | 483 (100.0%) | 0 (0.0%) |
| 75 Years and older | 302 (100.0%) | 0 (0.0%) |
| Total | 2,050 (85.1%) | 358 (14.9%) |
Health Insurance Coverage by Citizenship Status in Black Canyon City
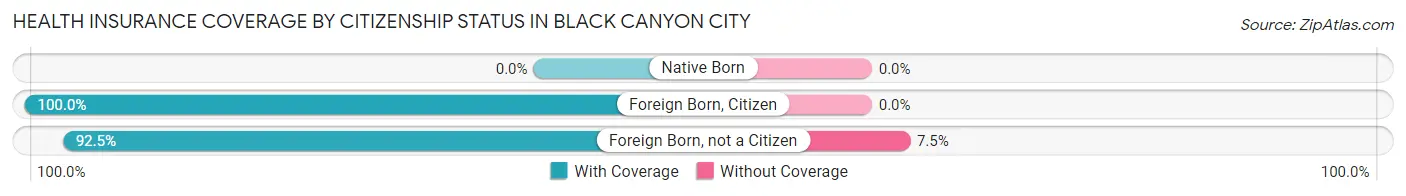
| Citizenship Status | With Coverage | Without Coverage |
| Native Born | 0 (0.0%) | 0 (0.0%) |
| Foreign Born, Citizen | 63 (100.0%) | 0 (0.0%) |
| Foreign Born, not a Citizen | 148 (92.5%) | 12 (7.5%) |
Health Insurance Coverage by Household Income in Black Canyon City
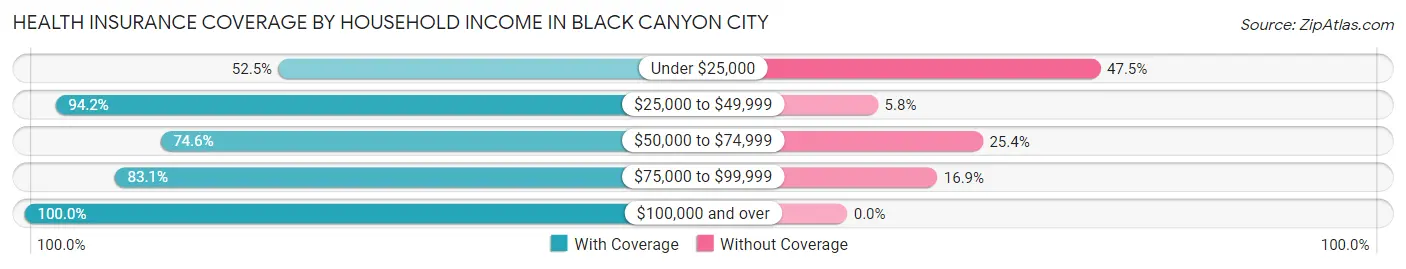
| Household Income | With Coverage | Without Coverage |
| Under $25,000 | 186 (52.5%) | 168 (47.5%) |
| $25,000 to $49,999 | 538 (94.2%) | 33 (5.8%) |
| $50,000 to $74,999 | 132 (74.6%) | 45 (25.4%) |
| $75,000 to $99,999 | 552 (83.1%) | 112 (16.9%) |
| $100,000 and over | 635 (100.0%) | 0 (0.0%) |
Public vs Private Health Insurance Coverage by Age in Black Canyon City
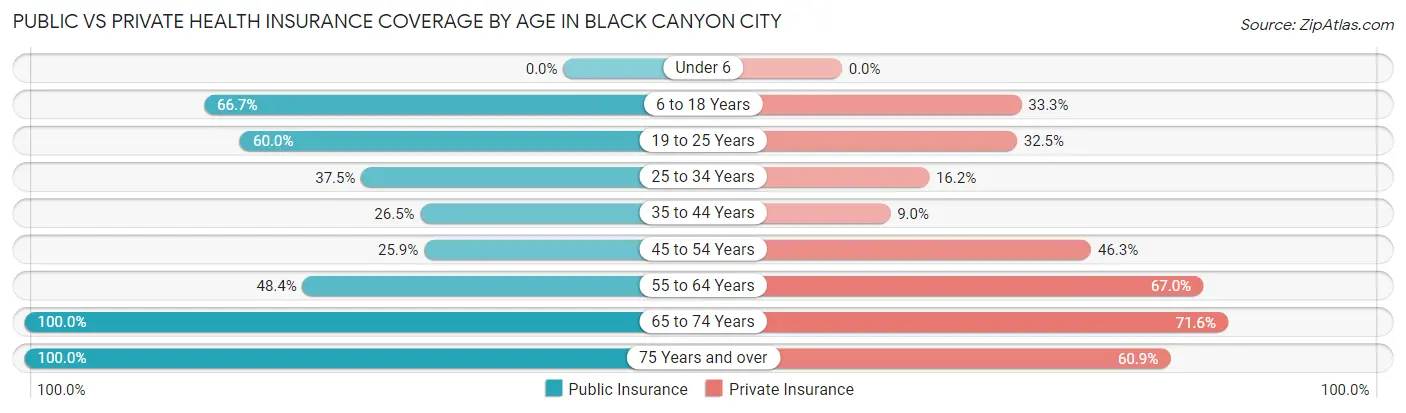
| Age Bracket | Public Insurance | Private Insurance |
| Under 6 | 0 (0.0%) | 0 (0.0%) |
| 6 to 18 Years | 42 (66.7%) | 21 (33.3%) |
| 19 to 25 Years | 96 (60.0%) | 52 (32.5%) |
| 25 to 34 Years | 51 (37.5%) | 22 (16.2%) |
| 35 to 44 Years | 65 (26.5%) | 22 (9.0%) |
| 45 to 54 Years | 76 (25.9%) | 136 (46.3%) |
| 55 to 64 Years | 351 (48.4%) | 486 (67.0%) |
| 65 to 74 Years | 483 (100.0%) | 346 (71.6%) |
| 75 Years and over | 302 (100.0%) | 184 (60.9%) |
| Total | 1,466 (60.9%) | 1,269 (52.7%) |
Disability Status by Sex by Age in Black Canyon City
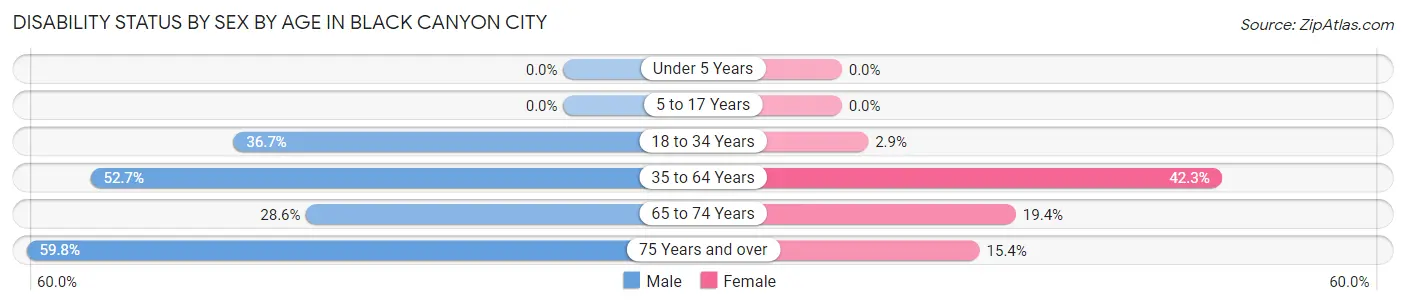
| Age Bracket | Male | Female |
| Under 5 Years | 0 (0.0%) | 0 (0.0%) |
| 5 to 17 Years | 0 (0.0%) | 0 (0.0%) |
| 18 to 34 Years | 79 (36.7%) | 3 (2.9%) |
| 35 to 64 Years | 328 (52.6%) | 271 (42.3%) |
| 65 to 74 Years | 91 (28.6%) | 32 (19.4%) |
| 75 Years and over | 52 (59.8%) | 33 (15.3%) |
Disability Class by Sex by Age in Black Canyon City
Disability Class: Hearing Difficulty
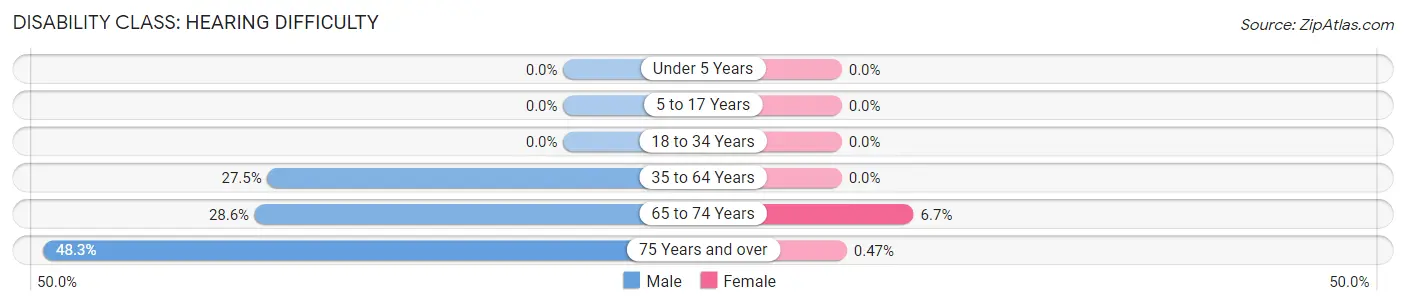
| Age Bracket | Male | Female |
| Under 5 Years | 0 (0.0%) | 0 (0.0%) |
| 5 to 17 Years | 0 (0.0%) | 0 (0.0%) |
| 18 to 34 Years | 0 (0.0%) | 0 (0.0%) |
| 35 to 64 Years | 171 (27.5%) | 0 (0.0%) |
| 65 to 74 Years | 91 (28.6%) | 11 (6.7%) |
| 75 Years and over | 42 (48.3%) | 1 (0.5%) |
Disability Class: Vision Difficulty
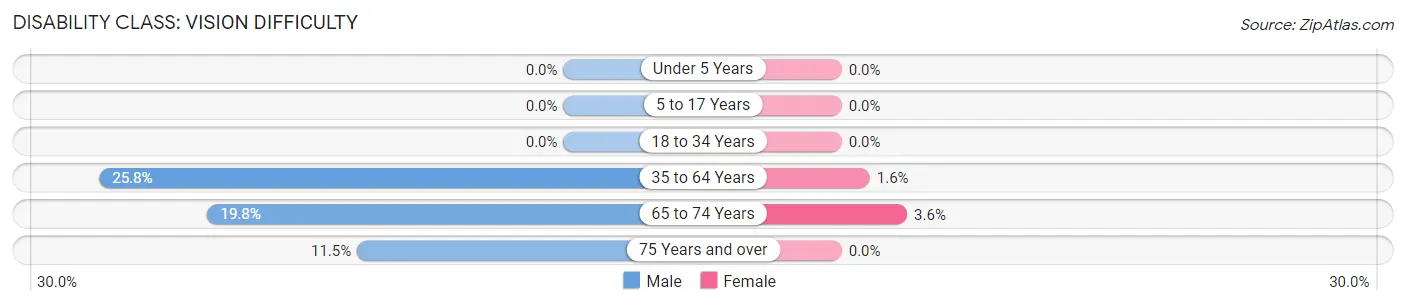
| Age Bracket | Male | Female |
| Under 5 Years | 0 (0.0%) | 0 (0.0%) |
| 5 to 17 Years | 0 (0.0%) | 0 (0.0%) |
| 18 to 34 Years | 0 (0.0%) | 0 (0.0%) |
| 35 to 64 Years | 161 (25.8%) | 10 (1.6%) |
| 65 to 74 Years | 63 (19.8%) | 6 (3.6%) |
| 75 Years and over | 10 (11.5%) | 0 (0.0%) |
Disability Class: Cognitive Difficulty
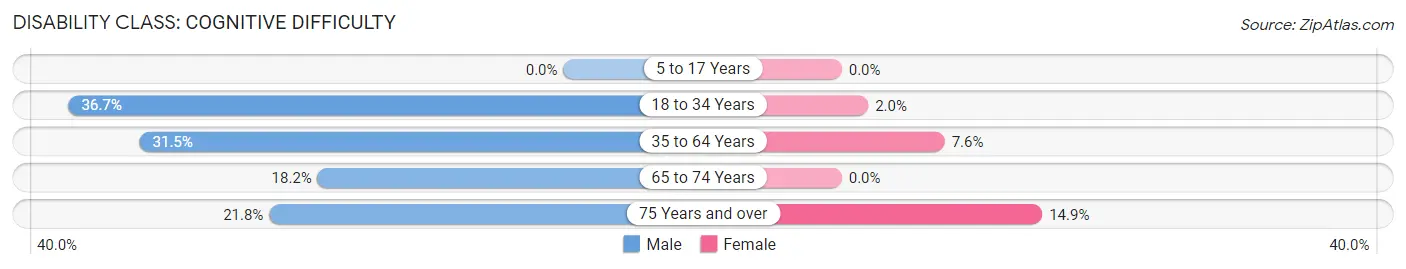
| Age Bracket | Male | Female |
| 5 to 17 Years | 0 (0.0%) | 0 (0.0%) |
| 18 to 34 Years | 79 (36.7%) | 2 (2.0%) |
| 35 to 64 Years | 196 (31.5%) | 49 (7.6%) |
| 65 to 74 Years | 58 (18.2%) | 0 (0.0%) |
| 75 Years and over | 19 (21.8%) | 32 (14.9%) |
Disability Class: Ambulatory Difficulty
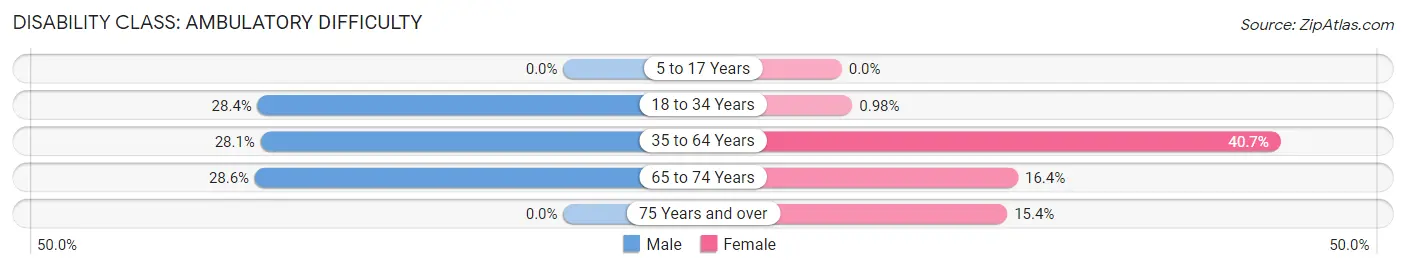
| Age Bracket | Male | Female |
| 5 to 17 Years | 0 (0.0%) | 0 (0.0%) |
| 18 to 34 Years | 61 (28.4%) | 1 (1.0%) |
| 35 to 64 Years | 175 (28.1%) | 261 (40.7%) |
| 65 to 74 Years | 91 (28.6%) | 27 (16.4%) |
| 75 Years and over | 0 (0.0%) | 33 (15.3%) |
Disability Class: Self-Care Difficulty
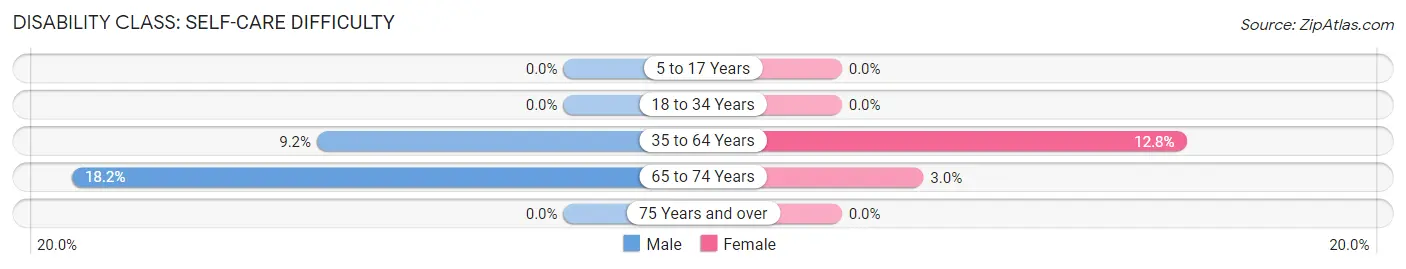
| Age Bracket | Male | Female |
| 5 to 17 Years | 0 (0.0%) | 0 (0.0%) |
| 18 to 34 Years | 0 (0.0%) | 0 (0.0%) |
| 35 to 64 Years | 57 (9.1%) | 82 (12.8%) |
| 65 to 74 Years | 58 (18.2%) | 5 (3.0%) |
| 75 Years and over | 0 (0.0%) | 0 (0.0%) |
Technology Access in Black Canyon City
Computing Device Access in Black Canyon City
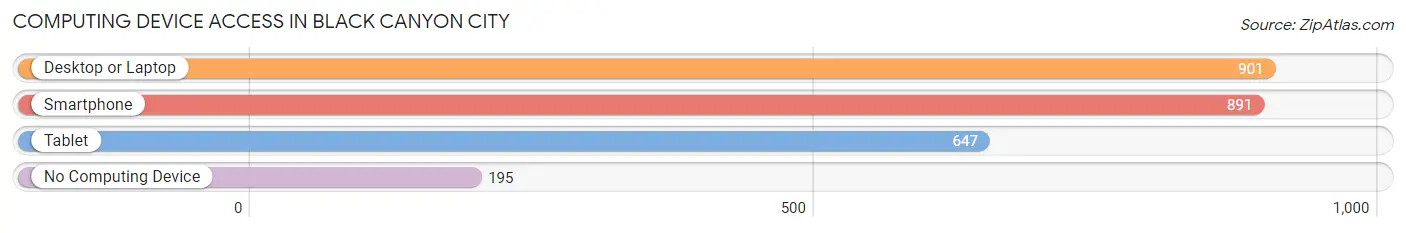
| Device Type | # Households | % Households |
| Desktop or Laptop | 901 | 76.4% |
| Smartphone | 891 | 75.6% |
| Tablet | 647 | 54.9% |
| No Computing Device | 195 | 16.5% |
| Total | 1,179 | 100.0% |
Internet Access in Black Canyon City
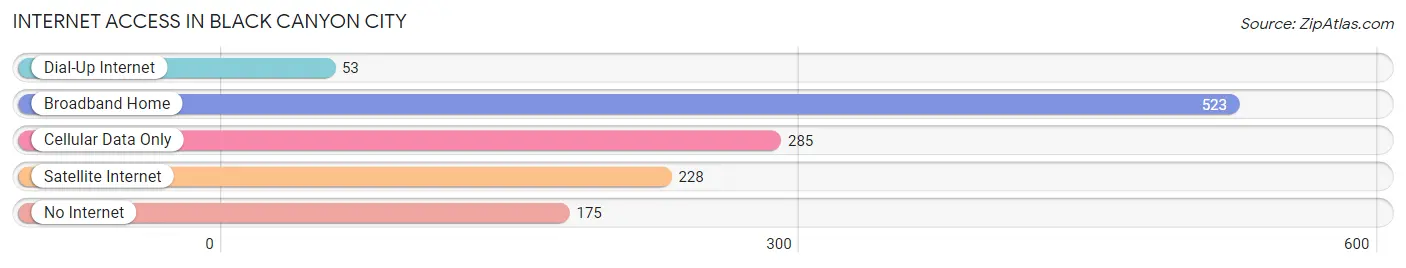
| Internet Type | # Households | % Households |
| Dial-Up Internet | 53 | 4.5% |
| Broadband Home | 523 | 44.4% |
| Cellular Data Only | 285 | 24.2% |
| Satellite Internet | 228 | 19.3% |
| No Internet | 175 | 14.8% |
| Total | 1,179 | 100.0% |
Black Canyon City Summary
Black Canyon City is a small unincorporated community located in Yavapai County, Arizona. It is situated in the foothills of the Bradshaw Mountains, approximately 40 miles north of Phoenix. The town is named after the nearby Black Canyon, which is part of the Agua Fria National Monument. The population of Black Canyon City was 1,876 at the 2010 census.
History
The area around Black Canyon City has been inhabited for thousands of years. The Hohokam and Yavapai people were the first to settle in the area, and the Hohokam built a network of irrigation canals in the area. The first European settlers arrived in the area in the late 19th century, and the town of Black Canyon City was established in 1883. The town was originally a stagecoach stop on the Prescott-to-Phoenix route.
In the early 20th century, the town was a popular tourist destination, and it was home to several resorts and hotels. The town was also home to a number of mines, including the Black Canyon Mine, which was the largest gold mine in Arizona. The mine operated until the 1950s, when it was closed due to declining gold prices.
Geography
Black Canyon City is located in the foothills of the Bradshaw Mountains, approximately 40 miles north of Phoenix. The town is situated at an elevation of 2,400 feet, and it is surrounded by the Agua Fria National Monument. The town is located along Interstate 17, and it is accessible via State Route 74.
The climate in Black Canyon City is semi-arid, with hot summers and mild winters. The average annual temperature is 68°F, and the average annual precipitation is 11.5 inches.
Economy
The economy of Black Canyon City is largely based on tourism and agriculture. The town is home to several resorts and hotels, and it is a popular destination for outdoor recreation. The town is also home to several farms and ranches, and it is a major producer of hay, alfalfa, and other crops.
Demographics
As of the 2010 census, the population of Black Canyon City was 1,876. The racial makeup of the town was 94.3% White, 0.7% Native American, 0.3% Asian, 0.2% African American, and 4.5% from other races. The median household income was $41,250, and the median family income was $45,000. The per capita income was $20,845.
Conclusion
Black Canyon City is a small unincorporated community located in Yavapai County, Arizona. It is situated in the foothills of the Bradshaw Mountains, approximately 40 miles north of Phoenix. The town is named after the nearby Black Canyon, which is part of the Agua Fria National Monument. The population of Black Canyon City was 1,876 at the 2010 census. The economy of Black Canyon City is largely based on tourism and agriculture, and the town is a popular destination for outdoor recreation. The racial makeup of the town was 94.3% White, 0.7% Native American, 0.3% Asian, 0.2% African American, and 4.5% from other races. The median household income was $41,250, and the median family income was $45,000.
Common Questions
What is Per Capita Income in Black Canyon City?
Per Capita income in Black Canyon City is $31,985.
What is the Median Family Income in Black Canyon City?
Median Family Income in Black Canyon City is $75,592.
What is the Median Household income in Black Canyon City?
Median Household Income in Black Canyon City is $48,468.
What is Income or Wage Gap in Black Canyon City?
Income or Wage Gap in Black Canyon City is 24.9%.
Women in Black Canyon City earn 75.1 cents for every dollar earned by a man.
What is Inequality or Gini Index in Black Canyon City?
Inequality or Gini Index in Black Canyon City is 0.44.
What is the Total Population of Black Canyon City?
Total Population of Black Canyon City is 2,408.
What is the Total Male Population of Black Canyon City?
Total Male Population of Black Canyon City is 1,257.
What is the Total Female Population of Black Canyon City?
Total Female Population of Black Canyon City is 1,151.
What is the Ratio of Males per 100 Females in Black Canyon City?
There are 109.21 Males per 100 Females in Black Canyon City.
What is the Ratio of Females per 100 Males in Black Canyon City?
There are 91.57 Females per 100 Males in Black Canyon City.
What is the Median Population Age in Black Canyon City?
Median Population Age in Black Canyon City is 60.4 Years.
What is the Average Family Size in Black Canyon City
Average Family Size in Black Canyon City is 2.5 People.
What is the Average Household Size in Black Canyon City
Average Household Size in Black Canyon City is 2.0 People.
How Large is the Labor Force in Black Canyon City?
There are 921 People in the Labor Forcein in Black Canyon City.
What is the Percentage of People in the Labor Force in Black Canyon City?
38.7% of People are in the Labor Force in Black Canyon City.
What is the Unemployment Rate in Black Canyon City?
Unemployment Rate in Black Canyon City is 12.8%.