Cities with the Highest Percentage of Welsh Population in the United States
RELATED REPORTS & OPTIONS
Welsh
United States
Compare Cities
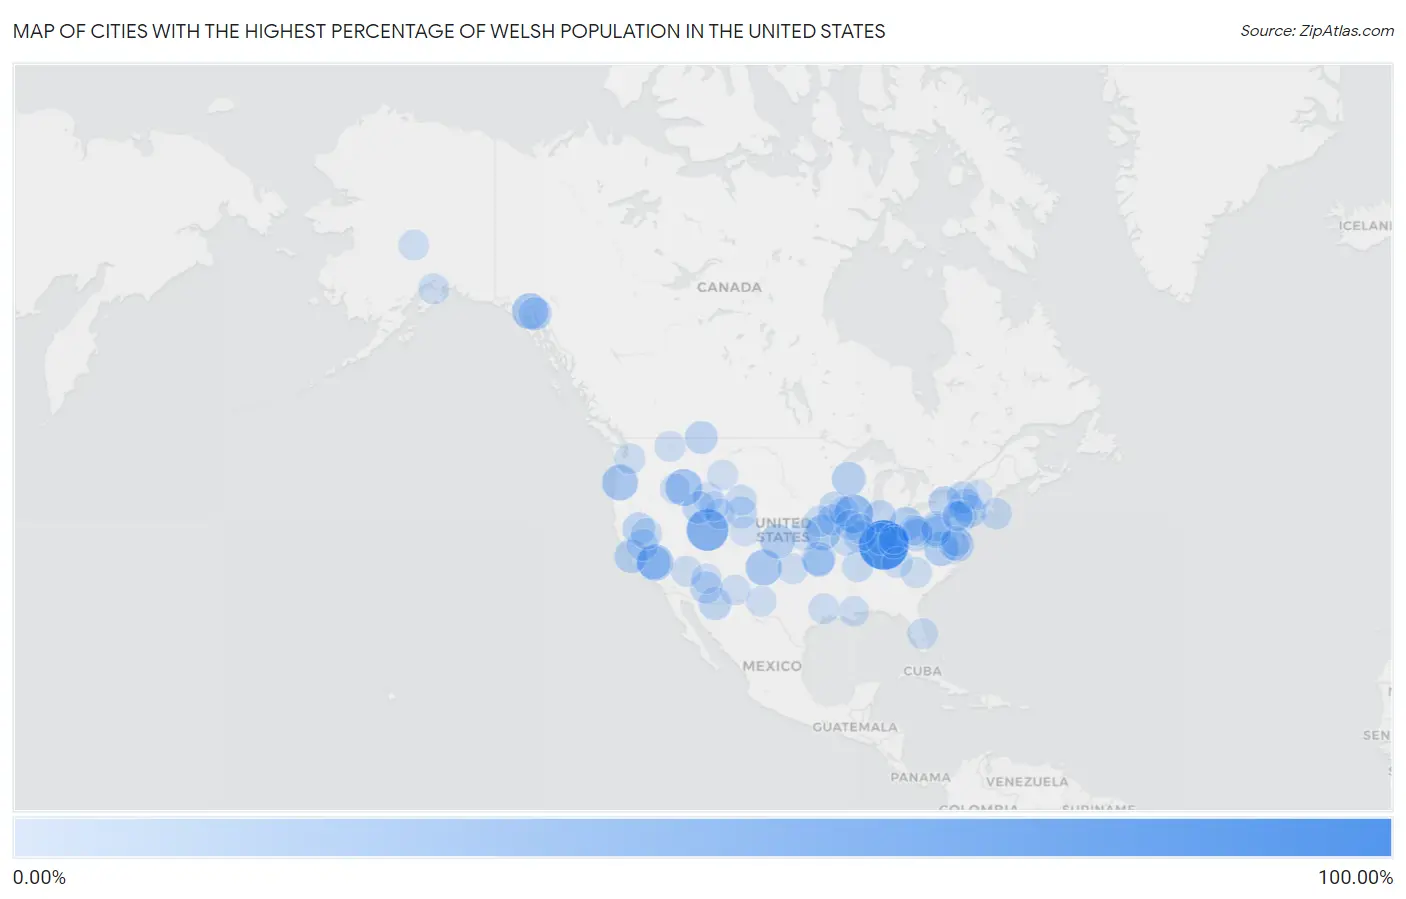
Map of Cities with the Highest Percentage of Welsh Population in the United States
0.00%
100.00%
Cities with the Highest Percentage of Welsh Population in the United States
| City | Welsh | vs State | vs National | |
| 1. | New Amsterdam | 95.00% | 0.54%(+94.5)#1 | 0.52%(+94.5)#1 |
| 2. | Peru | 75.38% | 1.08%(+74.3)#1 | 0.52%(+74.9)#2 |
| 3. | Twin Lakes | 73.17% | 0.51%(+72.7)#1 | 0.52%(+72.6)#3 |
| 4. | Scofield | 60.47% | 1.71%(+58.8)#1 | 0.52%(+59.9)#4 |
| 5. | Rock Island Arsenal | 47.47% | 0.36%(+47.1)#1 | 0.52%(+46.9)#5 |
| 6. | Devon | 45.65% | 0.70%(+45.0)#1 | 0.52%(+45.1)#6 |
| 7. | Clayton | 40.00% | 1.32%(+38.7)#1 | 0.52%(+39.5)#7 |
| 8. | Groveland | 38.58% | 0.54%(+38.0)#2 | 0.52%(+38.1)#8 |
| 9. | Ponderosa | 37.93% | 0.37%(+37.6)#1 | 0.52%(+37.4)#9 |
| 10. | Punta De Agua | 36.96% | 0.49%(+36.5)#1 | 0.52%(+36.4)#10 |
| 11. | Nara Visa | 36.30% | 0.49%(+35.8)#2 | 0.52%(+35.8)#11 |
| 12. | Kings Valley | 36.05% | 0.92%(+35.1)#1 | 0.52%(+35.5)#12 |
| 13. | Covenant Life | 36.00% | 0.68%(+35.3)#1 | 0.52%(+35.5)#13 |
| 14. | Iatan | 33.33% | 0.57%(+32.8)#1 | 0.52%(+32.8)#14 |
| 15. | North Pownal | 32.05% | 0.96%(+31.1)#1 | 0.52%(+31.5)#15 |
| 16. | Marienthal | 30.23% | 0.70%(+29.5)#2 | 0.52%(+29.7)#16 |
| 17. | Columbia | 30.00% | 0.64%(+29.4)#1 | 0.52%(+29.5)#17 |
| 18. | Vale Summit | 27.62% | 0.53%(+27.1)#1 | 0.52%(+27.1)#18 |
| 19. | Radnor | 26.95% | 0.94%(+26.0)#1 | 0.52%(+26.4)#19 |
| 20. | Jim Falls | 26.94% | 0.43%(+26.5)#1 | 0.52%(+26.4)#20 |
| 21. | New Alluwe | 26.56% | 0.51%(+26.0)#2 | 0.52%(+26.0)#21 |
| 22. | Sequoia Crest | 25.84% | 0.37%(+25.5)#2 | 0.52%(+25.3)#22 |
| 23. | Pajaro Dunes | 25.81% | 0.37%(+25.4)#3 | 0.52%(+25.3)#23 |
| 24. | Brooks Mill | 24.74% | 1.08%(+23.7)#2 | 0.52%(+24.2)#24 |
| 25. | Dames Quarter | 24.53% | 0.53%(+24.0)#2 | 0.52%(+24.0)#25 |
| 26. | Mud Bay | 24.19% | 0.68%(+23.5)#2 | 0.52%(+23.7)#26 |
| 27. | Sweet Grass | 22.86% | 0.82%(+22.0)#1 | 0.52%(+22.3)#27 |
| 28. | Groveland Station | 22.76% | 0.35%(+22.4)#1 | 0.52%(+22.2)#28 |
| 29. | Malad City | 22.49% | 1.32%(+21.2)#2 | 0.52%(+22.0)#29 |
| 30. | Cromberg | 22.44% | 0.37%(+22.1)#4 | 0.52%(+21.9)#30 |
| 31. | Palominas | 22.18% | 0.60%(+21.6)#1 | 0.52%(+21.7)#31 |
| 32. | Davenport Center | 22.09% | 0.35%(+21.7)#2 | 0.52%(+21.6)#32 |
| 33. | High Falls | 21.99% | 0.35%(+21.6)#3 | 0.52%(+21.5)#33 |
| 34. | East Poultney | 21.96% | 0.96%(+21.0)#2 | 0.52%(+21.4)#34 |
| 35. | Little Hocking | 21.94% | 0.94%(+21.0)#2 | 0.52%(+21.4)#35 |
| 36. | San Pierre | 20.87% | 0.54%(+20.3)#3 | 0.52%(+20.3)#36 |
| 37. | Queen Valley | 20.51% | 0.60%(+19.9)#2 | 0.52%(+20.0)#37 |
| 38. | St Anthony | 20.45% | 0.60%(+19.9)#1 | 0.52%(+19.9)#38 |
| 39. | Jefferson | 20.28% | 0.35%(+19.9)#4 | 0.52%(+19.8)#39 |
| 40. | Walshville | 19.87% | 0.36%(+19.5)#2 | 0.52%(+19.3)#40 |
| 41. | Holland Patent | 19.78% | 0.35%(+19.4)#5 | 0.52%(+19.3)#41 |
| 42. | Williams | 19.13% | 0.54%(+18.6)#4 | 0.52%(+18.6)#42 |
| 43. | Gratz | 19.10% | 0.57%(+18.5)#1 | 0.52%(+18.6)#43 |
| 44. | Sierra Village | 18.89% | 0.37%(+18.5)#5 | 0.52%(+18.4)#44 |
| 45. | Elk Mountain | 18.68% | 1.09%(+17.6)#1 | 0.52%(+18.2)#45 |
| 46. | Furley | 18.00% | 0.70%(+17.3)#3 | 0.52%(+17.5)#46 |
| 47. | Burdette | 17.92% | 0.46%(+17.5)#1 | 0.52%(+17.4)#47 |
| 48. | Nibbe | 17.83% | 0.82%(+17.0)#2 | 0.52%(+17.3)#48 |
| 49. | Big Bass Lake | 17.82% | 1.08%(+16.7)#3 | 0.52%(+17.3)#49 |
| 50. | Coin | 17.50% | 0.60%(+16.9)#2 | 0.52%(+17.0)#50 |
| 51. | Tiawah | 16.98% | 0.51%(+16.5)#3 | 0.52%(+16.5)#51 |
| 52. | Rhineland | 16.95% | 0.57%(+16.4)#2 | 0.52%(+16.4)#52 |
| 53. | Virginia City | 16.92% | 0.46%(+16.5)#1 | 0.52%(+16.4)#53 |
| 54. | Seconsett Island | 16.79% | 0.33%(+16.5)#1 | 0.52%(+16.3)#54 |
| 55. | Wolf Creek | 16.67% | 0.82%(+15.8)#3 | 0.52%(+16.1)#56 |
| 56. | Le Roy | 16.67% | 0.60%(+16.1)#3 | 0.52%(+16.1)#57 |
| 57. | Hartrandt | 15.95% | 1.09%(+14.9)#2 | 0.52%(+15.4)#58 |
| 58. | Monarch | 15.79% | 0.82%(+15.0)#4 | 0.52%(+15.3)#59 |
| 59. | Clifton | 15.59% | 0.49%(+15.1)#1 | 0.52%(+15.1)#60 |
| 60. | Petros | 15.54% | 0.58%(+15.0)#1 | 0.52%(+15.0)#61 |
| 61. | Foss | 15.29% | 0.51%(+14.8)#4 | 0.52%(+14.8)#62 |
| 62. | Clacks Canyon | 15.22% | 0.60%(+14.6)#3 | 0.52%(+14.7)#63 |
| 63. | Longford | 15.09% | 0.70%(+14.4)#4 | 0.52%(+14.6)#64 |
| 64. | Hope | 15.04% | 0.68%(+14.4)#3 | 0.52%(+14.5)#65 |
| 65. | Yeehaw Junction | 14.93% | 0.45%(+14.5)#1 | 0.52%(+14.4)#66 |
| 66. | St George Island | 14.90% | 0.53%(+14.4)#3 | 0.52%(+14.4)#67 |
| 67. | Davidsville | 14.88% | 1.08%(+13.8)#4 | 0.52%(+14.4)#68 |
| 68. | Indian Springs | 14.84% | 0.37%(+14.5)#1 | 0.52%(+14.3)#69 |
| 69. | Armagh Borough | 14.77% | 1.08%(+13.7)#5 | 0.52%(+14.2)#70 |
| 70. | Coalport Borough | 14.67% | 1.08%(+13.6)#6 | 0.52%(+14.1)#71 |
| 71. | Ingalls | 14.62% | 0.51%(+14.1)#5 | 0.52%(+14.1)#72 |
| 72. | Hope | 14.58% | 1.32%(+13.3)#3 | 0.52%(+14.1)#73 |
| 73. | Carbonado | 14.55% | 0.85%(+13.7)#1 | 0.52%(+14.0)#74 |
| 74. | Casas Adobes | 14.38% | 0.49%(+13.9)#3 | 0.52%(+13.9)#75 |
| 75. | Lake Minchumina | 14.29% | 0.68%(+13.6)#4 | 0.52%(+13.8)#76 |
| 76. | Amana | 14.21% | 0.60%(+13.6)#4 | 0.52%(+13.7)#77 |
| 77. | Alpine Northeast | 14.19% | 1.09%(+13.1)#3 | 0.52%(+13.7)#78 |
| 78. | Dexter City | 14.17% | 0.94%(+13.2)#3 | 0.52%(+13.6)#79 |
| 79. | Rose Farm | 13.98% | 0.94%(+13.0)#4 | 0.52%(+13.5)#80 |
| 80. | Shavertown | 13.89% | 1.08%(+12.8)#7 | 0.52%(+13.4)#81 |
| 81. | Las Palomas | 13.89% | 0.49%(+13.4)#4 | 0.52%(+13.4)#82 |
| 82. | Boyd | 13.89% | 0.82%(+13.1)#5 | 0.52%(+13.4)#83 |
| 83. | Lowman | 13.64% | 1.32%(+12.3)#4 | 0.52%(+13.1)#84 |
| 84. | Purple Sage | 13.55% | 1.09%(+12.5)#4 | 0.52%(+13.0)#85 |
| 85. | Albany | 13.51% | 0.27%(+13.2)#1 | 0.52%(+13.0)#86 |
| 86. | East Verde Estates | 13.42% | 0.60%(+12.8)#4 | 0.52%(+12.9)#87 |
| 87. | Church Creek | 13.33% | 0.53%(+12.8)#4 | 0.52%(+12.8)#88 |
| 88. | Mentone | 13.33% | 0.37%(+13.0)#2 | 0.52%(+12.8)#89 |
| 89. | Patriot | 13.00% | 0.54%(+12.5)#5 | 0.52%(+12.5)#90 |
| 90. | Sperry | 12.87% | 0.60%(+12.3)#5 | 0.52%(+12.3)#91 |
| 91. | Montezuma | 12.71% | 0.81%(+11.9)#1 | 0.52%(+12.2)#92 |
| 92. | South Londonderry | 12.62% | 0.96%(+11.7)#3 | 0.52%(+12.1)#93 |
| 93. | Sunbrook | 12.50% | 1.08%(+11.4)#8 | 0.52%(+12.0)#94 |
| 94. | Bentley | 12.50% | 0.36%(+12.1)#3 | 0.52%(+12.0)#95 |
| 95. | Wells | 12.47% | 0.96%(+11.5)#4 | 0.52%(+11.9)#96 |
| 96. | Shaft | 12.46% | 0.53%(+11.9)#5 | 0.52%(+11.9)#97 |
| 97. | La Barge | 12.36% | 1.09%(+11.3)#5 | 0.52%(+11.8)#98 |
| 98. | West Nanticoke | 12.31% | 1.08%(+11.2)#9 | 0.52%(+11.8)#99 |
| 99. | Taylor Borough | 12.30% | 1.08%(+11.2)#10 | 0.52%(+11.8)#100 |
| 100. | Cantrall | 12.23% | 0.36%(+11.9)#4 | 0.52%(+11.7)#101 |
Common Questions
What are the Top 10 Cities with the Highest Percentage of Welsh Population in the United States?
Top 10 Cities with the Highest Percentage of Welsh Population in the United States are:
#1
95.00%
#2
60.47%
#3
47.47%
#4
40.00%
#5
37.93%
#6
36.30%
#7
36.05%
#8
36.00%
#9
33.33%
#10
30.23%
What city has the Highest Percentage of Welsh Population in the United States?
New Amsterdam has the Highest Percentage of Welsh Population in the United States with 95.00%.
What is the Percentage of Welsh Population in the United States?
Percentage of Welsh Population in the United States is 0.52%.