Cities with the Largest Iroquois Community in the United States
RELATED REPORTS & OPTIONS
Iroquois
United States
Compare Cities
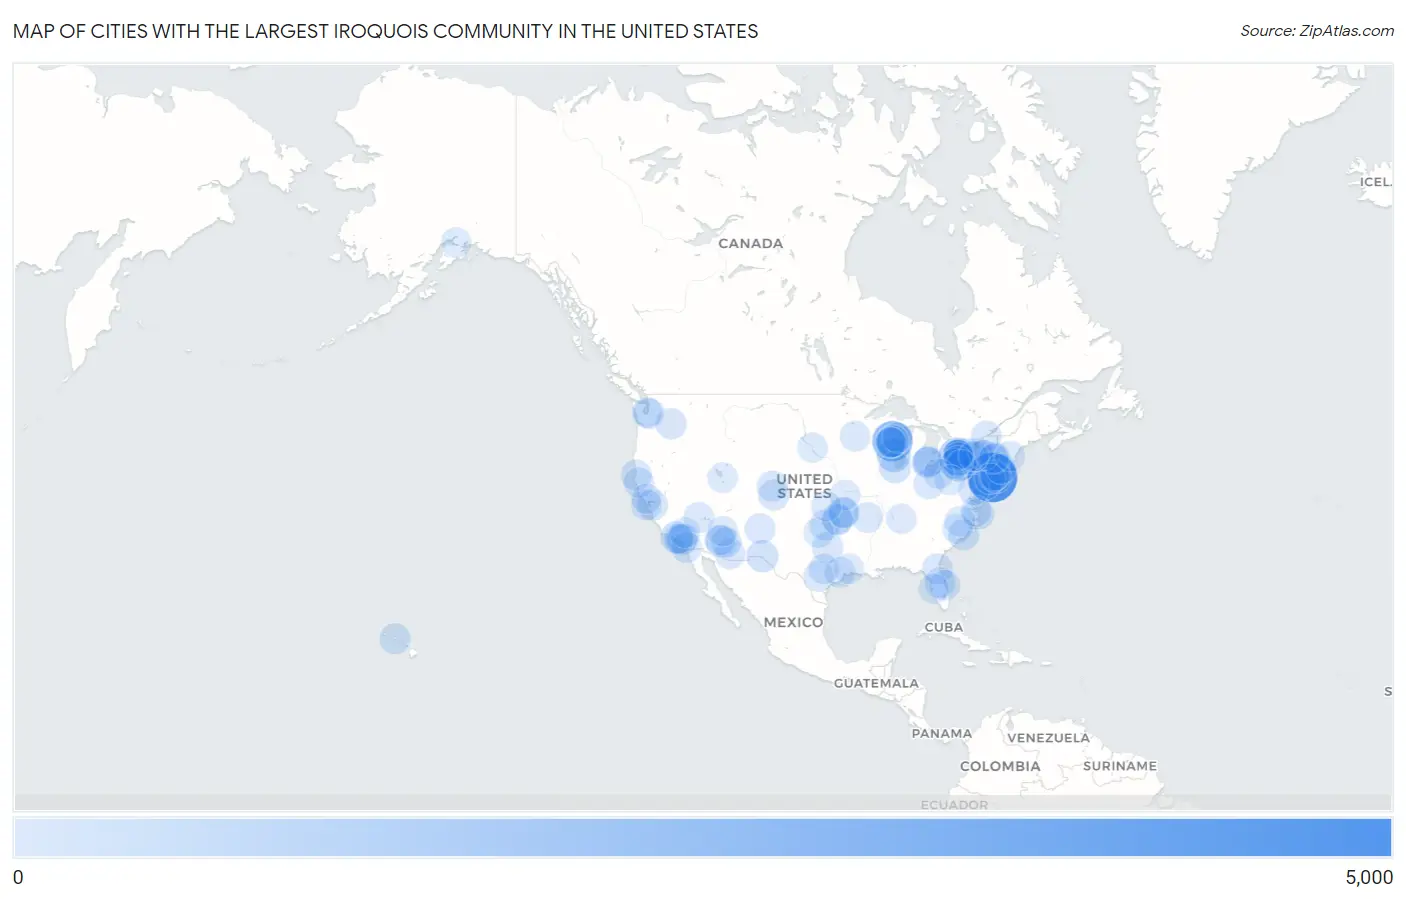
Map of Cities with the Largest Iroquois Community in the United States
0
5,000
Cities with the Largest Iroquois Community in the United States
| City | Iroquois | vs State | vs National | |
| 1. | New York | 4,389 | 26,986(16.26%)#1 | 95,118(4.61%)#1 |
| 2. | Green Bay | 2,292 | 9,448(24.26%)#1 | 95,118(2.41%)#2 |
| 3. | Akwesasne | 2,263 | 26,986(8.39%)#2 | 95,118(2.38%)#3 |
| 4. | Buffalo | 1,616 | 26,986(5.99%)#3 | 95,118(1.70%)#4 |
| 5. | Salamanca | 1,107 | 26,986(4.10%)#4 | 95,118(1.16%)#5 |
| 6. | Milwaukee | 872 | 9,448(9.23%)#2 | 95,118(0.92%)#6 |
| 7. | Syracuse | 698 | 26,986(2.59%)#5 | 95,118(0.73%)#7 |
| 8. | Hobart | 602 | 9,448(6.37%)#3 | 95,118(0.63%)#8 |
| 9. | Los Angeles | 456 | 6,395(7.13%)#1 | 95,118(0.48%)#9 |
| 10. | Philadelphia | 445 | 3,149(14.13%)#1 | 95,118(0.47%)#10 |
| 11. | El Paso | 442 | 2,822(15.66%)#1 | 95,118(0.46%)#11 |
| 12. | Phoenix | 373 | 1,609(23.18%)#1 | 95,118(0.39%)#12 |
| 13. | Chicago | 365 | 1,502(24.30%)#1 | 95,118(0.38%)#13 |
| 14. | De Pere | 348 | 9,448(3.68%)#4 | 95,118(0.37%)#14 |
| 15. | Virginia Beach | 318 | 1,932(16.46%)#1 | 95,118(0.33%)#15 |
| 16. | Miami | 312 | 4,038(7.73%)#1 | 95,118(0.33%)#16 |
| 17. | Tulsa | 308 | 4,038(7.63%)#2 | 95,118(0.32%)#17 |
| 18. | Niagara Falls | 296 | 26,986(1.10%)#6 | 95,118(0.31%)#18 |
| 19. | Irvine | 295 | 6,395(4.61%)#2 | 95,118(0.31%)#19 |
| 20. | Navassa | 273 | 3,227(8.46%)#1 | 95,118(0.29%)#20 |
| 21. | Rochester | 269 | 26,986(1.00%)#7 | 95,118(0.28%)#21 |
| 22. | Cheektowaga | 254 | 26,986(0.94%)#8 | 95,118(0.27%)#22 |
| 23. | North Richland Hills | 244 | 2,822(8.65%)#2 | 95,118(0.26%)#23 |
| 24. | Schenectady | 238 | 26,986(0.88%)#9 | 95,118(0.25%)#24 |
| 25. | Colorado Springs | 235 | 1,496(15.71%)#1 | 95,118(0.25%)#25 |
| 26. | Pearl City | 231 | 736(31.39%)#1 | 95,118(0.24%)#26 |
| 27. | Oklahoma City | 230 | 4,038(5.70%)#3 | 95,118(0.24%)#27 |
| 28. | Livermore | 228 | 6,395(3.57%)#3 | 95,118(0.24%)#28 |
| 29. | Denver | 227 | 1,496(15.17%)#2 | 95,118(0.24%)#29 |
| 30. | Pasco | 224 | 2,593(8.64%)#1 | 95,118(0.24%)#30 |
| 31. | Appleton | 216 | 9,448(2.29%)#5 | 95,118(0.23%)#31 |
| 32. | Nedrow | 214 | 26,986(0.79%)#10 | 95,118(0.22%)#32 |
| 33. | Detroit | 208 | 2,780(7.48%)#1 | 95,118(0.22%)#33 |
| 34. | San Antonio | 201 | 2,822(7.12%)#3 | 95,118(0.21%)#34 |
| 35. | San Francisco | 201 | 6,395(3.14%)#4 | 95,118(0.21%)#35 |
| 36. | North Tonawanda | 201 | 26,986(0.74%)#11 | 95,118(0.21%)#36 |
| 37. | Corona | 195 | 6,395(3.05%)#5 | 95,118(0.21%)#37 |
| 38. | San Diego | 194 | 6,395(3.03%)#6 | 95,118(0.20%)#38 |
| 39. | South Hill | 191 | 2,593(7.37%)#2 | 95,118(0.20%)#39 |
| 40. | Mckinleyville | 190 | 6,395(2.97%)#7 | 95,118(0.20%)#40 |
| 41. | Cherokee Village | 187 | 490(38.16%)#1 | 95,118(0.20%)#41 |
| 42. | Jacksonville | 175 | 4,360(4.01%)#1 | 95,118(0.18%)#42 |
| 43. | Albuquerque | 174 | 412(42.23%)#1 | 95,118(0.18%)#43 |
| 44. | South Lockport | 172 | 26,986(0.64%)#12 | 95,118(0.18%)#44 |
| 45. | Houston | 171 | 2,822(6.06%)#4 | 95,118(0.18%)#45 |
| 46. | Columbus | 171 | 1,991(8.59%)#1 | 95,118(0.18%)#46 |
| 47. | Lincoln Park | 171 | 2,780(6.15%)#2 | 95,118(0.18%)#47 |
| 48. | Las Vegas | 170 | 688(24.71%)#1 | 95,118(0.18%)#48 |
| 49. | Miranda | 170 | 6,395(2.66%)#8 | 95,118(0.18%)#49 |
| 50. | Minneapolis | 165 | 842(19.60%)#1 | 95,118(0.17%)#50 |
| 51. | Hampton | 164 | 1,932(8.49%)#2 | 95,118(0.17%)#51 |
| 52. | Towson | 162 | 1,072(15.11%)#1 | 95,118(0.17%)#52 |
| 53. | Tucson | 157 | 1,609(9.76%)#2 | 95,118(0.17%)#53 |
| 54. | Fort Covington | 155 | 26,986(0.57%)#13 | 95,118(0.16%)#54 |
| 55. | East Meadow | 154 | 26,986(0.57%)#14 | 95,118(0.16%)#55 |
| 56. | Altamonte Springs | 152 | 4,360(3.49%)#2 | 95,118(0.16%)#56 |
| 57. | Apache Junction | 149 | 1,609(9.26%)#3 | 95,118(0.16%)#57 |
| 58. | Massena | 144 | 26,986(0.53%)#15 | 95,118(0.15%)#58 |
| 59. | Viera West | 141 | 4,360(3.23%)#3 | 95,118(0.15%)#59 |
| 60. | Austin | 139 | 2,822(4.93%)#5 | 95,118(0.15%)#60 |
| 61. | Broken Arrow | 138 | 4,038(3.42%)#4 | 95,118(0.15%)#61 |
| 62. | Center Line | 138 | 2,780(4.96%)#3 | 95,118(0.15%)#62 |
| 63. | Tonawanda | 136 | 26,986(0.50%)#16 | 95,118(0.14%)#63 |
| 64. | Mount Vernon | 135 | 26,986(0.50%)#17 | 95,118(0.14%)#64 |
| 65. | Port Chester | 133 | 26,986(0.49%)#18 | 95,118(0.14%)#65 |
| 66. | Sturgeon Bay | 133 | 9,448(1.41%)#6 | 95,118(0.14%)#66 |
| 67. | Lawton | 131 | 4,038(3.24%)#5 | 95,118(0.14%)#67 |
| 68. | Riverview | 130 | 4,360(2.98%)#4 | 95,118(0.14%)#68 |
| 69. | Cohoes | 130 | 26,986(0.48%)#19 | 95,118(0.14%)#69 |
| 70. | Utica | 129 | 26,986(0.48%)#20 | 95,118(0.14%)#70 |
| 71. | Olathe | 128 | 859(14.90%)#1 | 95,118(0.13%)#71 |
| 72. | Kaukauna | 128 | 9,448(1.35%)#7 | 95,118(0.13%)#72 |
| 73. | Raleigh | 126 | 3,227(3.90%)#2 | 95,118(0.13%)#73 |
| 74. | Apple Valley | 125 | 6,395(1.95%)#9 | 95,118(0.13%)#74 |
| 75. | Nashville | 121 | 586(20.65%)#1 | 95,118(0.13%)#75 |
| 76. | Taylorsville | 119 | 568(20.95%)#1 | 95,118(0.13%)#76 |
| 77. | Lackawanna | 119 | 26,986(0.44%)#21 | 95,118(0.13%)#77 |
| 78. | Jamestown | 116 | 26,986(0.43%)#22 | 95,118(0.12%)#78 |
| 79. | Paramount | 115 | 6,395(1.80%)#10 | 95,118(0.12%)#79 |
| 80. | Peoria | 114 | 1,609(7.09%)#4 | 95,118(0.12%)#80 |
| 81. | Gowanda | 113 | 26,986(0.42%)#23 | 95,118(0.12%)#81 |
| 82. | Albany | 112 | 26,986(0.42%)#24 | 95,118(0.12%)#82 |
| 83. | Silsbee | 112 | 2,822(3.97%)#6 | 95,118(0.12%)#83 |
| 84. | Pinardville | 112 | 776(14.43%)#1 | 95,118(0.12%)#84 |
| 85. | Commerce | 112 | 4,038(2.77%)#6 | 95,118(0.12%)#85 |
| 86. | Cottonwood | 111 | 1,609(6.90%)#5 | 95,118(0.12%)#86 |
| 87. | Wichita | 109 | 859(12.69%)#2 | 95,118(0.11%)#87 |
| 88. | Lockport | 109 | 26,986(0.40%)#25 | 95,118(0.11%)#88 |
| 89. | Iselin | 109 | 1,323(8.24%)#1 | 95,118(0.11%)#89 |
| 90. | Olean | 109 | 26,986(0.40%)#26 | 95,118(0.11%)#90 |
| 91. | Chamberlain | 107 | 277(38.63%)#1 | 95,118(0.11%)#91 |
| 92. | Pittsburgh | 106 | 3,149(3.37%)#2 | 95,118(0.11%)#92 |
| 93. | Anchorage | 106 | 269(39.41%)#1 | 95,118(0.11%)#93 |
| 94. | Newington | 106 | 1,012(10.47%)#1 | 95,118(0.11%)#94 |
| 95. | Tacoma | 105 | 2,593(4.05%)#3 | 95,118(0.11%)#95 |
| 96. | Akron | 105 | 1,991(5.27%)#2 | 95,118(0.11%)#96 |
| 97. | Auburn | 104 | 26,986(0.39%)#27 | 95,118(0.11%)#97 |
| 98. | Santa Rosa | 102 | 6,395(1.59%)#11 | 95,118(0.11%)#98 |
| 99. | Ringwood Borough | 101 | 1,323(7.63%)#2 | 95,118(0.11%)#99 |
| 100. | Fayetteville | 100 | 3,227(3.10%)#3 | 95,118(0.11%)#100 |
Common Questions
What are the Top 10 Cities with the Largest Iroquois Community in the United States?
Top 10 Cities with the Largest Iroquois Community in the United States are:
What city has the Largest Iroquois Community in the United States?
New York has the Largest Iroquois Community in the United States with 4,389.
What is the Total Iroquois Population in the United States?
Total Iroquois Population in the United States is 95,118.