Cities with the Most Immigrants from Middle Africa in the United States
RELATED REPORTS & OPTIONS
Middle Africa
United States
Compare Cities
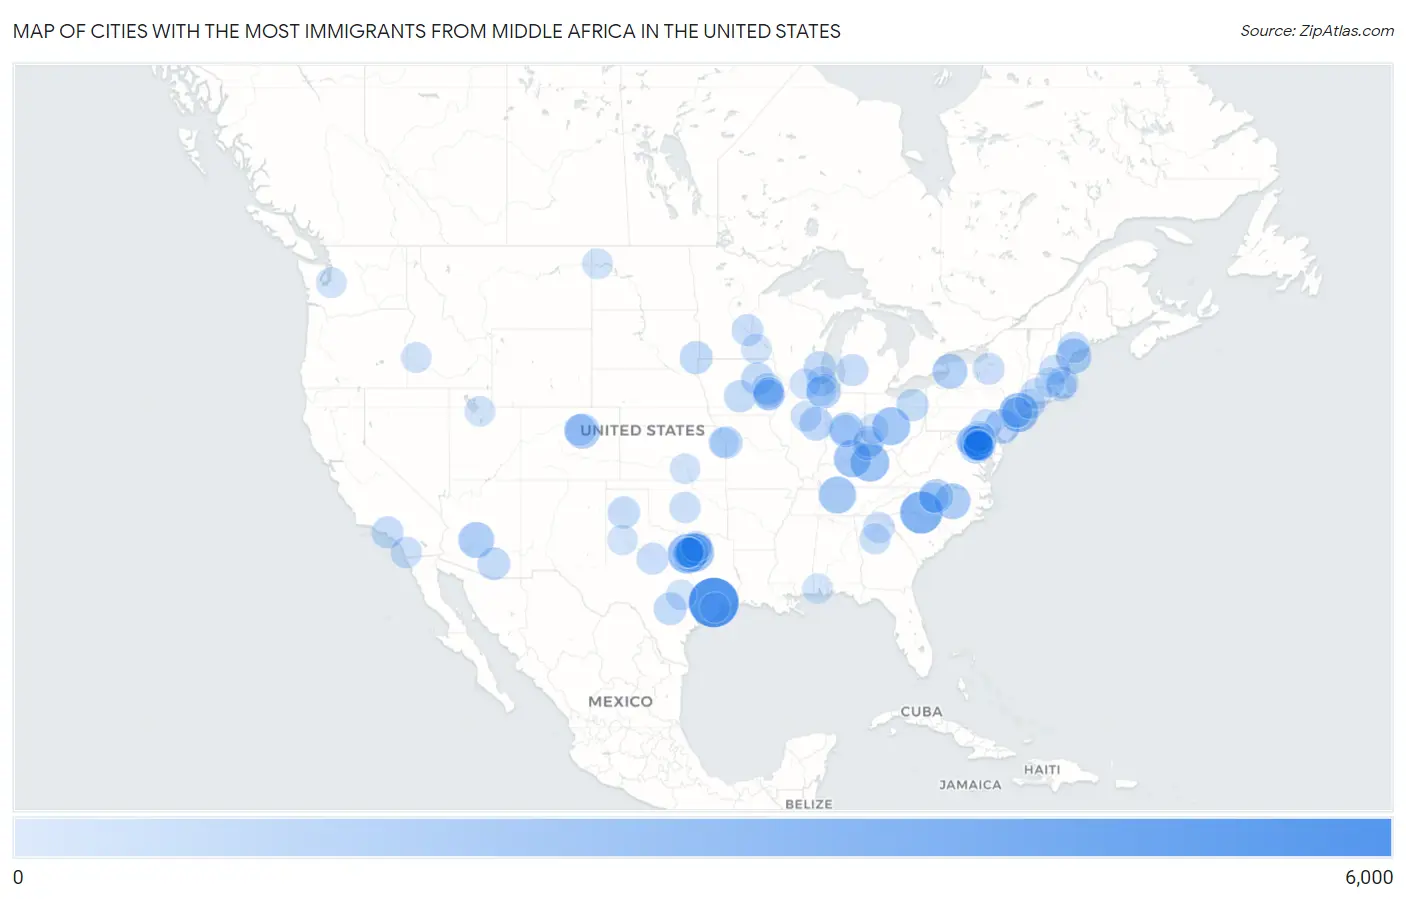
Map of Cities with the Most Immigrants from Middle Africa in the United States
0
6,000
Cities with the Most Immigrants from Middle Africa in the United States
| City | Middle Africa | vs State | vs National | |
| 1. | Houston | 5,357 | 30,968(17.30%)#1 | 193,874(2.76%)#1 |
| 2. | Charlotte | 3,389 | 9,446(35.88%)#1 | 193,874(1.75%)#2 |
| 3. | Fort Worth | 2,699 | 30,968(8.72%)#2 | 193,874(1.39%)#3 |
| 4. | New York | 2,619 | 7,089(36.94%)#1 | 193,874(1.35%)#4 |
| 5. | Lexington | 2,414 | 6,589(36.64%)#1 | 193,874(1.25%)#5 |
| 6. | Dallas | 2,371 | 30,968(7.66%)#3 | 193,874(1.22%)#6 |
| 7. | Columbus | 2,254 | 7,017(32.12%)#1 | 193,874(1.16%)#7 |
| 8. | Louisville | 2,119 | 6,589(32.16%)#2 | 193,874(1.09%)#8 |
| 9. | Nashville | 2,063 | 3,746(55.07%)#1 | 193,874(1.06%)#9 |
| 10. | Raleigh | 1,782 | 9,446(18.87%)#2 | 193,874(0.92%)#10 |
| 11. | Phoenix | 1,728 | 3,657(47.25%)#1 | 193,874(0.89%)#11 |
| 12. | Portland | 1,631 | 3,005(54.28%)#1 | 193,874(0.84%)#12 |
| 13. | Aurora | 1,569 | 3,224(48.67%)#1 | 193,874(0.81%)#13 |
| 14. | Indianapolis | 1,551 | 3,282(47.26%)#1 | 193,874(0.80%)#14 |
| 15. | Buffalo | 1,488 | 7,089(20.99%)#2 | 193,874(0.77%)#15 |
| 16. | Arlington | 1,484 | 30,968(4.79%)#4 | 193,874(0.77%)#16 |
| 17. | Philadelphia | 1,470 | 5,179(28.38%)#1 | 193,874(0.76%)#17 |
| 18. | Washington | 1,430 | 1,430(100.00%)#1 | 193,874(0.74%)#18 |
| 19. | White Oak | 1,392 | 27,057(5.14%)#1 | 193,874(0.72%)#19 |
| 20. | Greensboro | 1,360 | 9,446(14.40%)#3 | 193,874(0.70%)#20 |
| 21. | Chicago | 1,348 | 7,830(17.22%)#1 | 193,874(0.70%)#21 |
| 22. | South Laurel | 1,269 | 27,057(4.69%)#2 | 193,874(0.65%)#22 |
| 23. | Champaign | 1,201 | 7,830(15.34%)#2 | 193,874(0.62%)#23 |
| 24. | New Carrollton | 1,064 | 27,057(3.93%)#3 | 193,874(0.55%)#24 |
| 25. | Sioux Falls | 1,026 | 1,079(95.09%)#1 | 193,874(0.53%)#25 |
| 26. | Greenbelt | 1,017 | 27,057(3.76%)#4 | 193,874(0.52%)#26 |
| 27. | Milwaukee | 988 | 1,989(49.67%)#1 | 193,874(0.51%)#27 |
| 28. | Tucson | 982 | 3,657(26.85%)#2 | 193,874(0.51%)#28 |
| 29. | Waterloo | 976 | 5,594(17.45%)#1 | 193,874(0.50%)#29 |
| 30. | Irving | 972 | 30,968(3.14%)#5 | 193,874(0.50%)#30 |
| 31. | San Antonio | 964 | 30,968(3.11%)#6 | 193,874(0.50%)#31 |
| 32. | Adelphi | 956 | 27,057(3.53%)#5 | 193,874(0.49%)#32 |
| 33. | Coralville | 942 | 5,594(16.84%)#2 | 193,874(0.49%)#33 |
| 34. | Akron | 915 | 7,017(13.04%)#2 | 193,874(0.47%)#34 |
| 35. | Fairland | 911 | 27,057(3.37%)#6 | 193,874(0.47%)#35 |
| 36. | Richardson | 889 | 30,968(2.87%)#7 | 193,874(0.46%)#36 |
| 37. | Kansas City | 860 | 2,836(30.32%)#1 | 193,874(0.44%)#37 |
| 38. | Des Moines | 852 | 5,594(15.23%)#3 | 193,874(0.44%)#38 |
| 39. | Amarillo | 835 | 30,968(2.70%)#8 | 193,874(0.43%)#39 |
| 40. | Boston | 801 | 5,098(15.71%)#1 | 193,874(0.41%)#40 |
| 41. | Los Angeles | 793 | 7,302(10.86%)#1 | 193,874(0.41%)#41 |
| 42. | Naugatuck Borough | 787 | 3,025(26.02%)#1 | 193,874(0.41%)#42 |
| 43. | Grand Rapids | 775 | 3,833(20.22%)#1 | 193,874(0.40%)#43 |
| 44. | Abilene | 754 | 30,968(2.43%)#9 | 193,874(0.39%)#44 |
| 45. | Cedar Rapids | 735 | 5,594(13.14%)#4 | 193,874(0.38%)#45 |
| 46. | Denver | 734 | 3,224(22.77%)#2 | 193,874(0.38%)#46 |
| 47. | Syracuse | 721 | 7,089(10.17%)#3 | 193,874(0.37%)#47 |
| 48. | Bowie | 702 | 27,057(2.59%)#7 | 193,874(0.36%)#48 |
| 49. | St Paul | 690 | 4,581(15.06%)#1 | 193,874(0.36%)#49 |
| 50. | Silver Spring | 658 | 27,057(2.43%)#8 | 193,874(0.34%)#50 |
| 51. | Lewiston | 654 | 3,005(21.76%)#2 | 193,874(0.34%)#51 |
| 52. | Lancaster | 650 | 5,179(12.55%)#2 | 193,874(0.34%)#52 |
| 53. | Germantown | 647 | 27,057(2.39%)#9 | 193,874(0.33%)#53 |
| 54. | San Diego | 644 | 7,302(8.82%)#2 | 193,874(0.33%)#54 |
| 55. | Gaithersburg | 644 | 27,057(2.38%)#10 | 193,874(0.33%)#55 |
| 56. | Chillum | 620 | 27,057(2.29%)#11 | 193,874(0.32%)#56 |
| 57. | Seabrook | 614 | 27,057(2.27%)#12 | 193,874(0.32%)#57 |
| 58. | New Britain | 597 | 3,025(19.74%)#2 | 193,874(0.31%)#58 |
| 59. | Gainesville | 586 | 8,851(6.62%)#1 | 193,874(0.30%)#59 |
| 60. | Baltimore | 585 | 27,057(2.16%)#13 | 193,874(0.30%)#60 |
| 61. | Oklahoma City | 581 | 1,031(56.35%)#1 | 193,874(0.30%)#61 |
| 62. | North Plainfield Borough | 571 | 4,475(12.76%)#1 | 193,874(0.29%)#62 |
| 63. | Normal | 544 | 7,830(6.95%)#3 | 193,874(0.28%)#63 |
| 64. | Stonecrest | 537 | 8,851(6.07%)#2 | 193,874(0.28%)#64 |
| 65. | Cincinnati | 529 | 7,017(7.54%)#3 | 193,874(0.27%)#65 |
| 66. | Haltom City | 522 | 30,968(1.69%)#10 | 193,874(0.27%)#66 |
| 67. | Newark | 518 | 4,475(11.58%)#2 | 193,874(0.27%)#67 |
| 68. | Mckinney | 513 | 30,968(1.66%)#11 | 193,874(0.26%)#68 |
| 69. | Owings Mills | 507 | 27,057(1.87%)#14 | 193,874(0.26%)#69 |
| 70. | Manchester | 491 | 940(52.23%)#1 | 193,874(0.25%)#70 |
| 71. | Columbia | 487 | 27,057(1.80%)#15 | 193,874(0.25%)#71 |
| 72. | Iowa City | 483 | 5,594(8.63%)#5 | 193,874(0.25%)#72 |
| 73. | Rockford | 481 | 7,830(6.14%)#4 | 193,874(0.25%)#73 |
| 74. | Austin | 477 | 30,968(1.54%)#12 | 193,874(0.25%)#74 |
| 75. | Williston | 463 | 1,007(45.98%)#1 | 193,874(0.24%)#75 |
| 76. | Pearland | 446 | 30,968(1.44%)#13 | 193,874(0.23%)#76 |
| 77. | Federal Way | 444 | 2,062(21.53%)#1 | 193,874(0.23%)#77 |
| 78. | Florence | 441 | 6,589(6.69%)#3 | 193,874(0.23%)#78 |
| 79. | Meridian | 439 | 807(54.40%)#1 | 193,874(0.23%)#79 |
| 80. | North Liberty | 435 | 5,594(7.78%)#6 | 193,874(0.22%)#80 |
| 81. | Dayton | 422 | 7,017(6.01%)#4 | 193,874(0.22%)#81 |
| 82. | Wichita | 417 | 1,133(36.80%)#1 | 193,874(0.22%)#82 |
| 83. | Jersey City | 416 | 4,475(9.30%)#3 | 193,874(0.21%)#83 |
| 84. | Lubbock | 414 | 30,968(1.34%)#14 | 193,874(0.21%)#84 |
| 85. | Waukegan | 414 | 7,830(5.29%)#5 | 193,874(0.21%)#85 |
| 86. | Rochester | 410 | 4,581(8.95%)#2 | 193,874(0.21%)#86 |
| 87. | Landover | 408 | 27,057(1.51%)#16 | 193,874(0.21%)#87 |
| 88. | Brockton | 407 | 5,098(7.98%)#2 | 193,874(0.21%)#88 |
| 89. | Salt Lake City | 403 | 995(40.50%)#1 | 193,874(0.21%)#89 |
| 90. | Bridgeport | 403 | 3,025(13.32%)#3 | 193,874(0.21%)#90 |
| 91. | Lanham | 403 | 27,057(1.49%)#17 | 193,874(0.21%)#91 |
| 92. | Euless | 400 | 30,968(1.29%)#15 | 193,874(0.21%)#92 |
| 93. | High Point | 397 | 9,446(4.20%)#4 | 193,874(0.20%)#93 |
| 94. | Worcester | 394 | 5,098(7.73%)#3 | 193,874(0.20%)#94 |
| 95. | Speedway | 393 | 3,282(11.97%)#2 | 193,874(0.20%)#95 |
| 96. | North Richland Hills | 392 | 30,968(1.27%)#16 | 193,874(0.20%)#96 |
| 97. | Kansas City | 390 | 1,133(34.42%)#2 | 193,874(0.20%)#97 |
| 98. | Mobile | 388 | 819(47.37%)#1 | 193,874(0.20%)#98 |
| 99. | Hillside | 387 | 7,830(4.94%)#6 | 193,874(0.20%)#99 |
| 100. | Lake Arbor | 380 | 27,057(1.40%)#18 | 193,874(0.20%)#100 |
Common Questions
What are the Top 10 Cities with the Most Immigrants from Middle Africa in the United States?
Top 10 Cities with the Most Immigrants from Middle Africa in the United States are:
What city has the Most Immigrants from Middle Africa in the United States?
Houston has the Most Immigrants from Middle Africa in the United States with 5,357.
What is the Total Immigrants from Middle Africa in the United States?
Total Immigrants from Middle Africa in the United States is 193,874.