Lanham, MD Map & Demographics
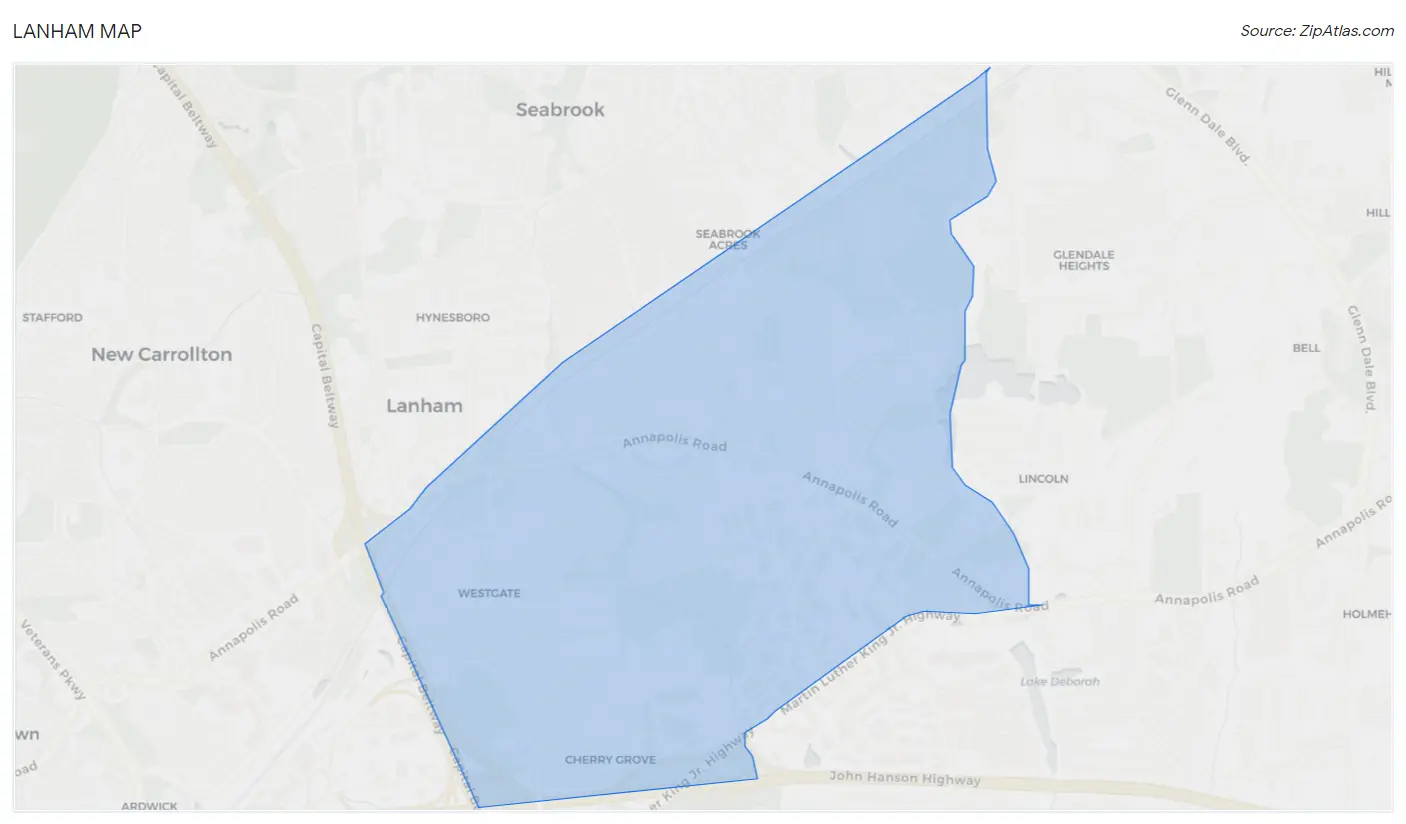
Lanham Map
Lanham Overview
$33,272
PER CAPITA INCOME
$112,139
AVG FAMILY INCOME
$100,974
AVG HOUSEHOLD INCOME
14.9%
WAGE / INCOME GAP [ % ]
85.1¢/ $1
WAGE / INCOME GAP [ $ ]
0.36
INEQUALITY / GINI INDEX
11,662
TOTAL POPULATION
5,925
MALE POPULATION
5,737
FEMALE POPULATION
103.28
MALES / 100 FEMALES
96.83
FEMALES / 100 MALES
39.8
MEDIAN AGE
4.3
AVG FAMILY SIZE
3.7
AVG HOUSEHOLD SIZE
6,124
LABOR FORCE [ PEOPLE ]
67.4%
PERCENT IN LABOR FORCE
9.0%
UNEMPLOYMENT RATE
Lanham Zip Codes
Income in Lanham
Income Overview in Lanham
Per Capita Income in Lanham is $33,272, while median incomes of families and households are $112,139 and $100,974 respectively.
| Characteristic | Number | Measure |
| Per Capita Income | 11,662 | $33,272 |
| Median Family Income | 2,379 | $112,139 |
| Mean Family Income | 2,379 | $128,420 |
| Median Household Income | 3,125 | $100,974 |
| Mean Household Income | 3,125 | $119,518 |
| Income Deficit | 2,379 | $0 |
| Wage / Income Gap (%) | 11,662 | 14.89% |
| Wage / Income Gap ($) | 11,662 | 85.11¢ per $1 |
| Gini / Inequality Index | 11,662 | 0.36 |
Earnings by Sex in Lanham
Average Earnings in Lanham are $38,067, $40,451 for men and $34,429 for women, a difference of 14.9%.
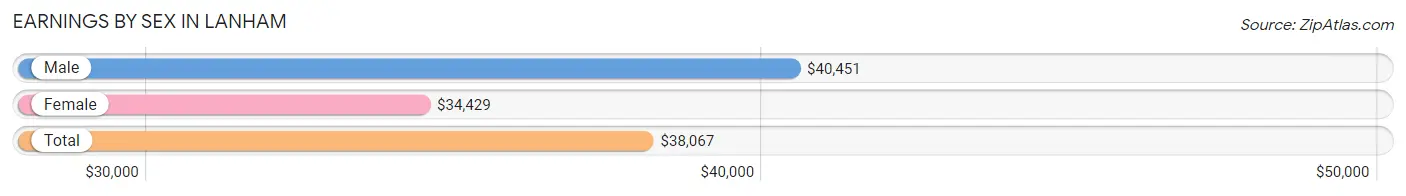
| Sex | Number | Average Earnings |
| Male | 3,484 (55.6%) | $40,451 |
| Female | 2,782 (44.4%) | $34,429 |
| Total | 6,266 (100.0%) | $38,067 |
Earnings by Sex by Income Bracket in Lanham
The most common earnings brackets in Lanham are $100,000+ for men (318 | 9.1%) and $30,000 to $34,999 for women (356 | 12.8%).
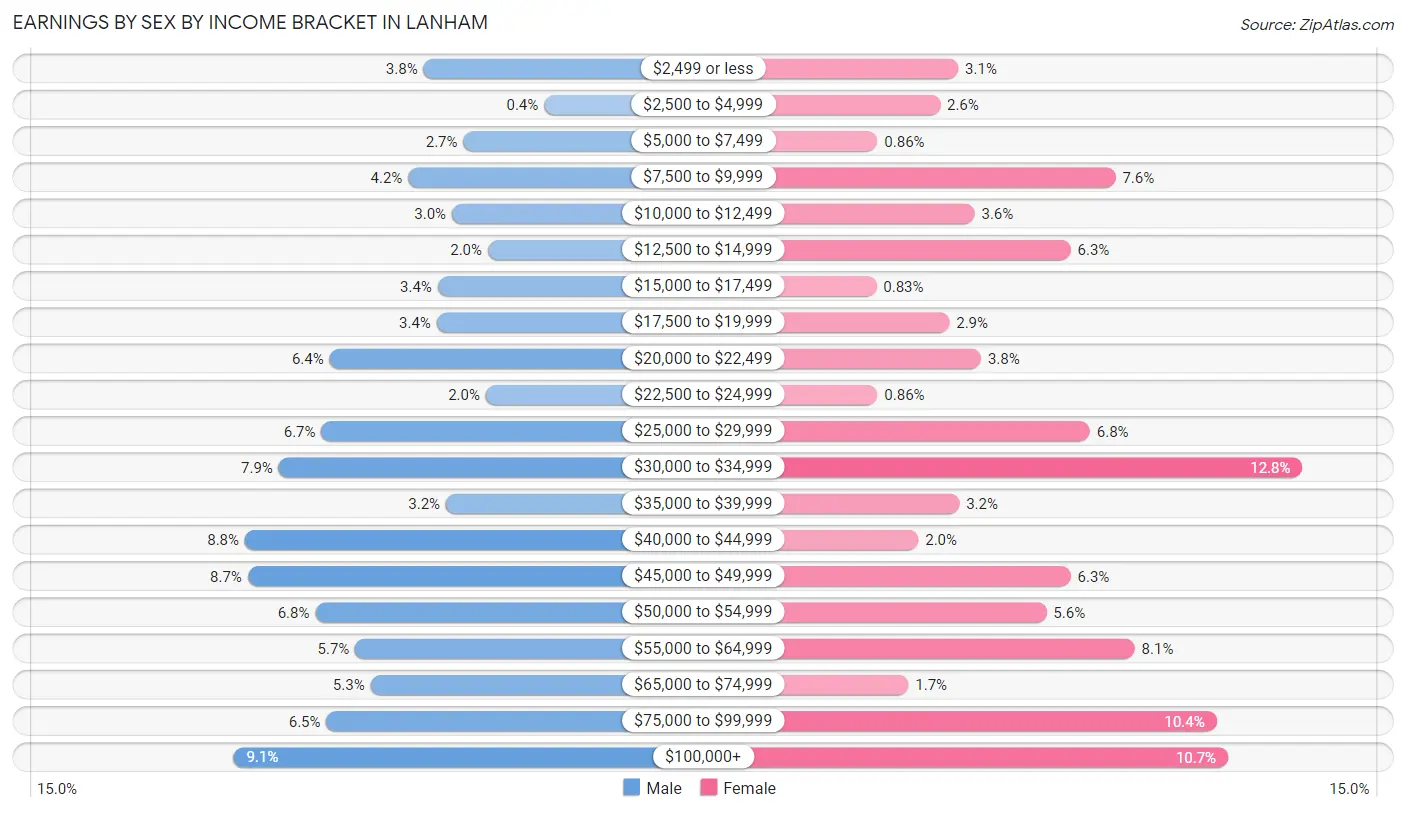
| Income | Male | Female |
| $2,499 or less | 132 (3.8%) | 87 (3.1%) |
| $2,500 to $4,999 | 14 (0.4%) | 73 (2.6%) |
| $5,000 to $7,499 | 93 (2.7%) | 24 (0.9%) |
| $7,500 to $9,999 | 147 (4.2%) | 210 (7.5%) |
| $10,000 to $12,499 | 104 (3.0%) | 100 (3.6%) |
| $12,500 to $14,999 | 69 (2.0%) | 175 (6.3%) |
| $15,000 to $17,499 | 118 (3.4%) | 23 (0.8%) |
| $17,500 to $19,999 | 119 (3.4%) | 80 (2.9%) |
| $20,000 to $22,499 | 224 (6.4%) | 105 (3.8%) |
| $22,500 to $24,999 | 71 (2.0%) | 24 (0.9%) |
| $25,000 to $29,999 | 232 (6.7%) | 190 (6.8%) |
| $30,000 to $34,999 | 274 (7.9%) | 356 (12.8%) |
| $35,000 to $39,999 | 110 (3.2%) | 88 (3.2%) |
| $40,000 to $44,999 | 307 (8.8%) | 56 (2.0%) |
| $45,000 to $49,999 | 304 (8.7%) | 175 (6.3%) |
| $50,000 to $54,999 | 238 (6.8%) | 156 (5.6%) |
| $55,000 to $64,999 | 199 (5.7%) | 225 (8.1%) |
| $65,000 to $74,999 | 184 (5.3%) | 48 (1.7%) |
| $75,000 to $99,999 | 227 (6.5%) | 289 (10.4%) |
| $100,000+ | 318 (9.1%) | 298 (10.7%) |
| Total | 3,484 (100.0%) | 2,782 (100.0%) |
Earnings by Sex by Educational Attainment in Lanham
Average earnings in Lanham are $43,252 for men and $34,836 for women, a difference of 19.5%. Men with an educational attainment of bachelor's degree enjoy the highest average annual earnings of $47,171, while those with less than high school education earn the least with $34,974. Women with an educational attainment of graduate degree earn the most with the average annual earnings of $87,292, while those with less than high school education have the smallest earnings of $26,667.
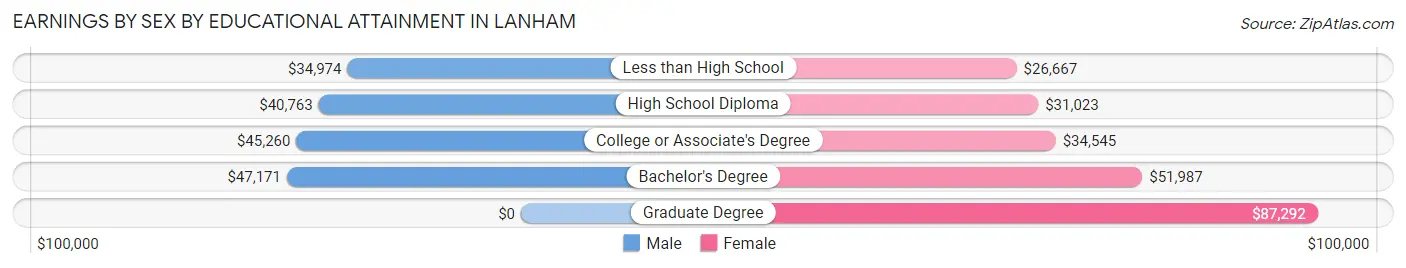
| Educational Attainment | Male Income | Female Income |
| Less than High School | $34,974 | $26,667 |
| High School Diploma | $40,763 | $31,023 |
| College or Associate's Degree | $45,260 | $34,545 |
| Bachelor's Degree | $47,171 | $51,987 |
| Graduate Degree | - | - |
| Total | $43,252 | $34,836 |
Family Income in Lanham
Family Income Brackets in Lanham
According to the Lanham family income data, there are 540 families falling into the $100,000 to $149,999 income range, which is the most common income bracket and makes up 22.7% of all families. Conversely, the $10,000 to $14,999 income bracket is the least frequent group with only 12 families (0.5%) belonging to this category.
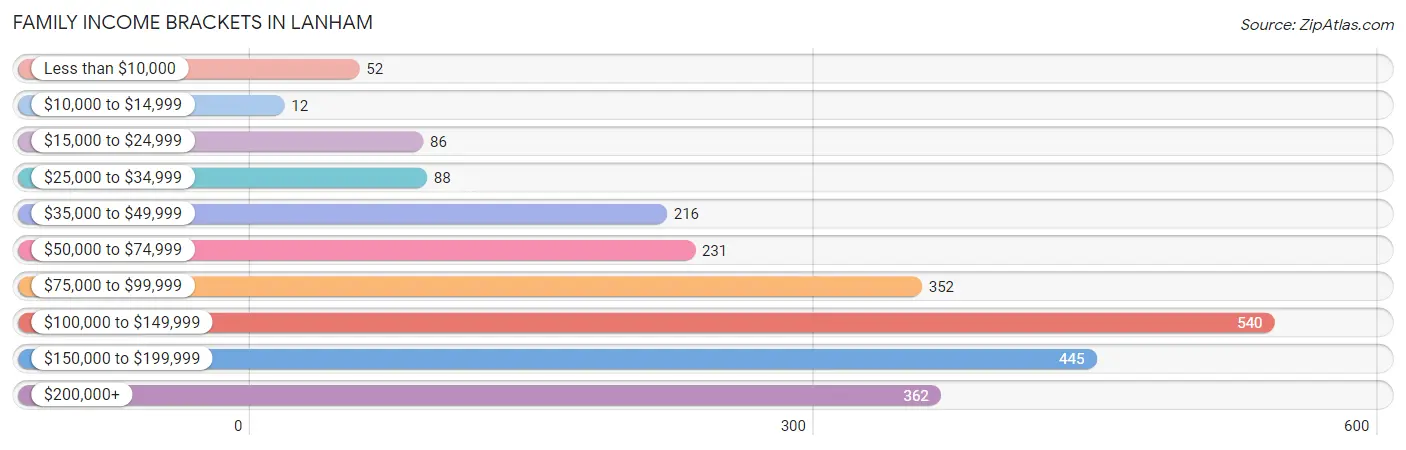
| Income Bracket | # Families | % Families |
| Less than $10,000 | 52 | 2.2% |
| $10,000 to $14,999 | 12 | 0.5% |
| $15,000 to $24,999 | 86 | 3.6% |
| $25,000 to $34,999 | 88 | 3.7% |
| $35,000 to $49,999 | 216 | 9.1% |
| $50,000 to $74,999 | 231 | 9.7% |
| $75,000 to $99,999 | 352 | 14.8% |
| $100,000 to $149,999 | 540 | 22.7% |
| $150,000 to $199,999 | 445 | 18.7% |
| $200,000+ | 362 | 15.2% |
Family Income by Famaliy Size in Lanham
7+ person families (301 | 12.7%) account for the highest median family income in Lanham with $164,110 per family, while 2-person families (624 | 26.2%) have the highest median income of $43,572 per family member.
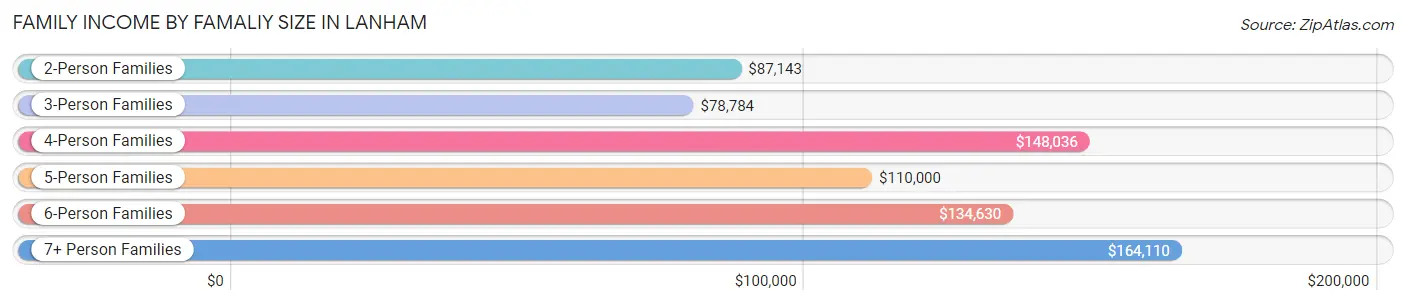
| Income Bracket | # Families | Median Income |
| 2-Person Families | 624 (26.2%) | $87,143 |
| 3-Person Families | 556 (23.4%) | $78,784 |
| 4-Person Families | 566 (23.8%) | $148,036 |
| 5-Person Families | 224 (9.4%) | $110,000 |
| 6-Person Families | 108 (4.5%) | $134,630 |
| 7+ Person Families | 301 (12.7%) | $164,110 |
| Total | 2,379 (100.0%) | $112,139 |
Family Income by Number of Earners in Lanham
The median family income in Lanham is $112,139, with families comprising 3+ earners (766) having the highest median family income of $149,936, while families with 1 earner (717) have the lowest median family income of $56,250, accounting for 32.2% and 30.1% of families, respectively.
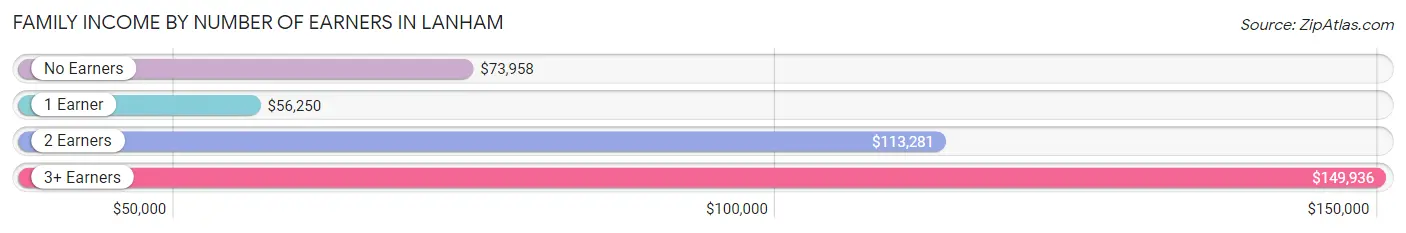
| Number of Earners | # Families | Median Income |
| No Earners | 216 (9.1%) | $73,958 |
| 1 Earner | 717 (30.1%) | $56,250 |
| 2 Earners | 680 (28.6%) | $113,281 |
| 3+ Earners | 766 (32.2%) | $149,936 |
| Total | 2,379 (100.0%) | $112,139 |
Household Income in Lanham
Household Income Brackets in Lanham
With 722 households falling in the category, the $100,000 to $149,999 income range is the most frequent in Lanham, accounting for 23.1% of all households. In contrast, only 22 households (0.7%) fall into the $10,000 to $14,999 income bracket, making it the least populous group.
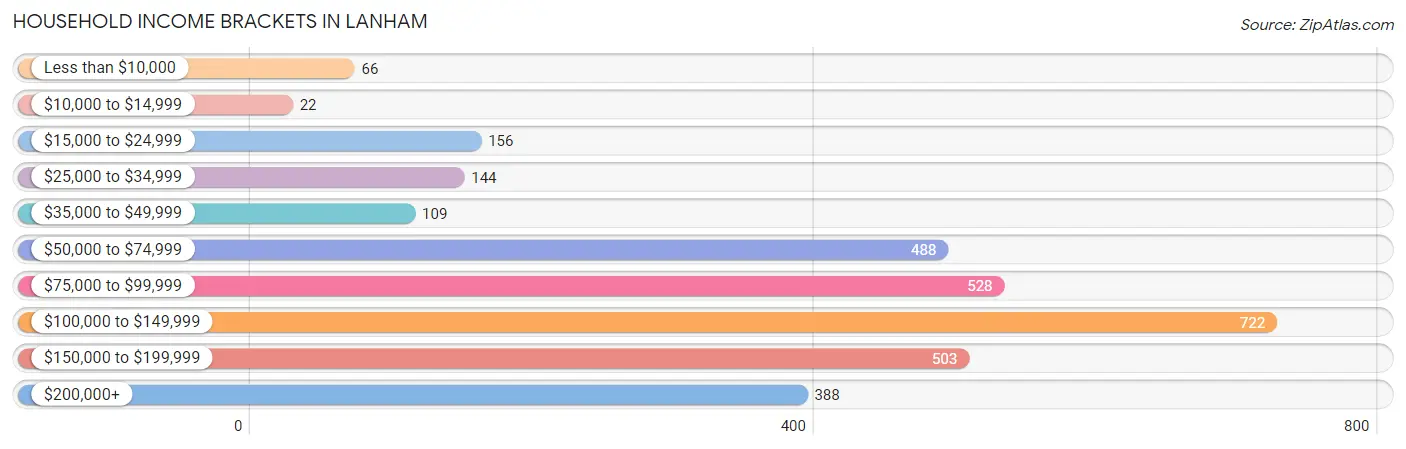
| Income Bracket | # Households | % Households |
| Less than $10,000 | 66 | 2.1% |
| $10,000 to $14,999 | 22 | 0.7% |
| $15,000 to $24,999 | 156 | 5.0% |
| $25,000 to $34,999 | 144 | 4.6% |
| $35,000 to $49,999 | 109 | 3.5% |
| $50,000 to $74,999 | 488 | 15.6% |
| $75,000 to $99,999 | 528 | 16.9% |
| $100,000 to $149,999 | 722 | 23.1% |
| $150,000 to $199,999 | 503 | 16.1% |
| $200,000+ | 388 | 12.4% |
Household Income by Householder Age in Lanham
The median household income in Lanham is $100,974, with the highest median household income of $122,721 found in the 45 to 64 years age bracket for the primary householder. A total of 1,285 households (41.1%) fall into this category. Meanwhile, the 15 to 24 years age bracket for the primary householder has the lowest median household income of $0, with 28 households (0.9%) in this group.
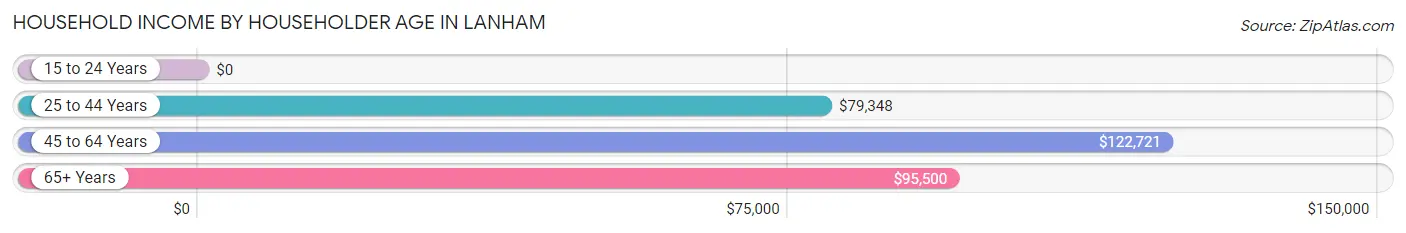
| Income Bracket | # Households | Median Income |
| 15 to 24 Years | 28 (0.9%) | $0 |
| 25 to 44 Years | 804 (25.7%) | $79,348 |
| 45 to 64 Years | 1,285 (41.1%) | $122,721 |
| 65+ Years | 1,008 (32.3%) | $95,500 |
| Total | 3,125 (100.0%) | $100,974 |
Poverty in Lanham
Income Below Poverty by Sex and Age in Lanham
With 7.0% poverty level for males and 5.6% for females among the residents of Lanham, under 5 year old males and 5 year old females are the most vulnerable to poverty, with 60 males (21.0%) and 21 females (48.8%) in their respective age groups living below the poverty level.
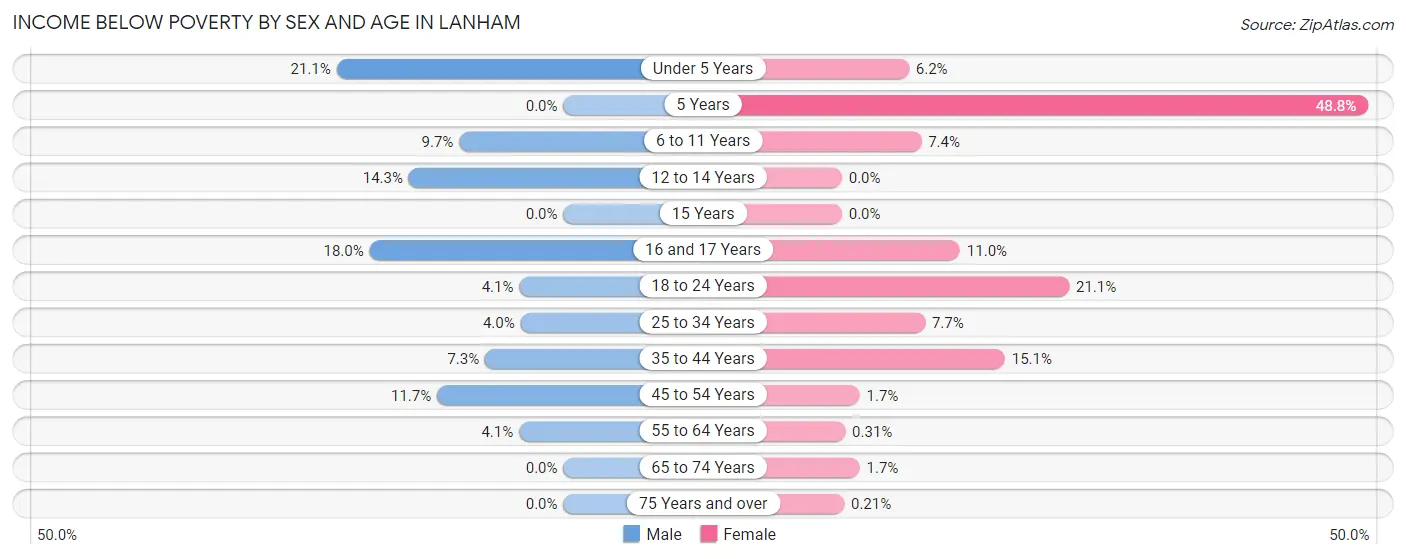
| Age Bracket | Male | Female |
| Under 5 Years | 60 (21.0%) | 15 (6.2%) |
| 5 Years | 0 (0.0%) | 21 (48.8%) |
| 6 to 11 Years | 44 (9.7%) | 41 (7.4%) |
| 12 to 14 Years | 35 (14.3%) | 0 (0.0%) |
| 15 Years | 0 (0.0%) | 0 (0.0%) |
| 16 and 17 Years | 34 (18.0%) | 8 (11.0%) |
| 18 to 24 Years | 19 (4.1%) | 58 (21.1%) |
| 25 to 34 Years | 31 (4.0%) | 59 (7.7%) |
| 35 to 44 Years | 64 (7.3%) | 90 (15.1%) |
| 45 to 54 Years | 92 (11.7%) | 17 (1.7%) |
| 55 to 64 Years | 35 (4.1%) | 2 (0.3%) |
| 65 to 74 Years | 0 (0.0%) | 9 (1.7%) |
| 75 Years and over | 0 (0.0%) | 1 (0.2%) |
| Total | 414 (7.0%) | 321 (5.6%) |
Income Above Poverty by Sex and Age in Lanham
According to the poverty statistics in Lanham, males aged 5 years and females aged 12 to 14 years are the age groups that are most secure financially, with 100.0% of males and 100.0% of females in these age groups living above the poverty line.
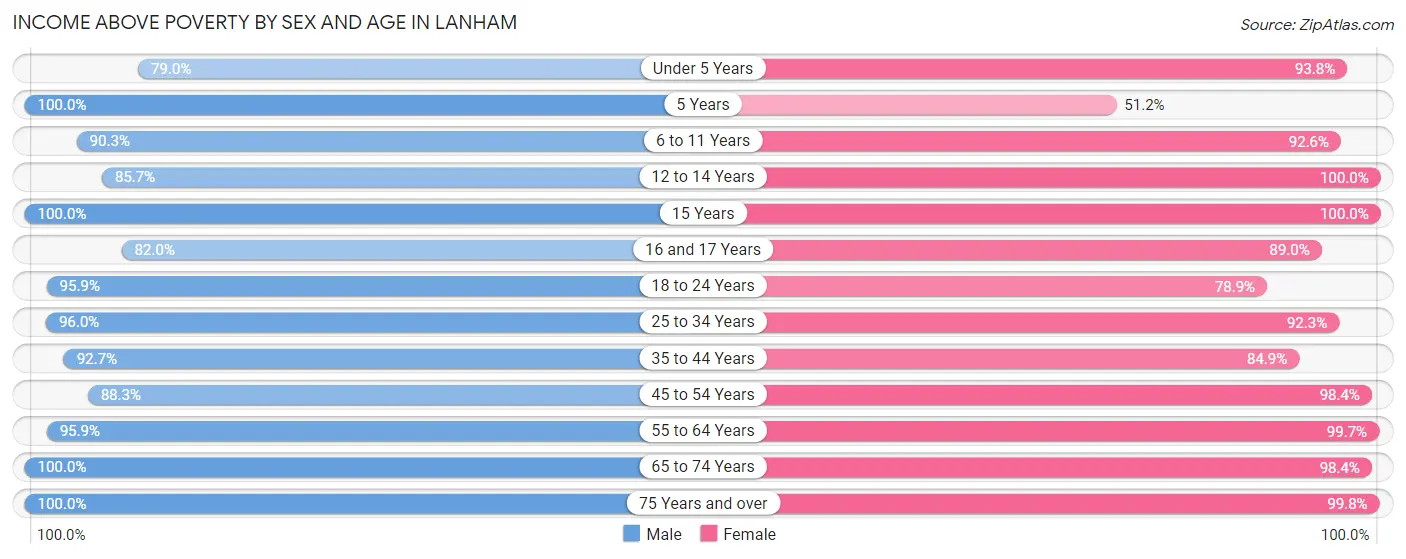
| Age Bracket | Male | Female |
| Under 5 Years | 225 (78.9%) | 226 (93.8%) |
| 5 Years | 89 (100.0%) | 22 (51.2%) |
| 6 to 11 Years | 411 (90.3%) | 515 (92.6%) |
| 12 to 14 Years | 209 (85.7%) | 321 (100.0%) |
| 15 Years | 186 (100.0%) | 137 (100.0%) |
| 16 and 17 Years | 155 (82.0%) | 65 (89.0%) |
| 18 to 24 Years | 446 (95.9%) | 217 (78.9%) |
| 25 to 34 Years | 749 (96.0%) | 705 (92.3%) |
| 35 to 44 Years | 816 (92.7%) | 505 (84.9%) |
| 45 to 54 Years | 693 (88.3%) | 1,011 (98.4%) |
| 55 to 64 Years | 817 (95.9%) | 641 (99.7%) |
| 65 to 74 Years | 467 (100.0%) | 538 (98.4%) |
| 75 Years and over | 230 (100.0%) | 484 (99.8%) |
| Total | 5,493 (93.0%) | 5,387 (94.4%) |
Income Below Poverty Among Married-Couple Families in Lanham
The poverty statistics for married-couple families in Lanham show that 4.0% or 58 of the total 1,470 families live below the poverty line. Families with 1 or 2 children have the highest poverty rate of 10.2%, comprising of 51 families. On the other hand, families with 3 or 4 children have the lowest poverty rate of 0.0%, which includes 0 families.
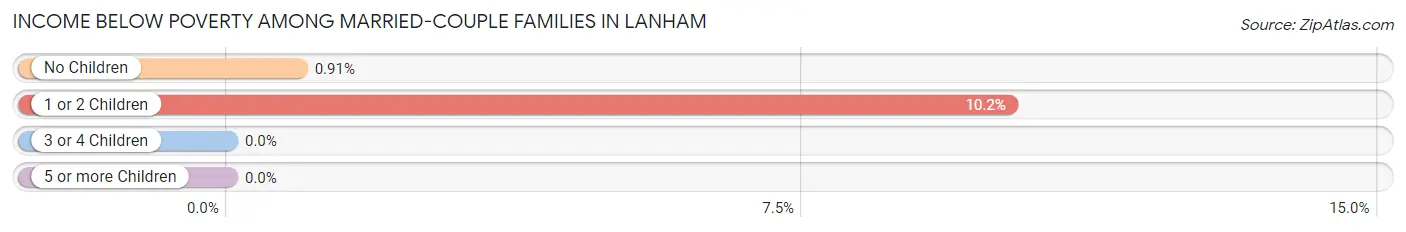
| Children | Above Poverty | Below Poverty |
| No Children | 766 (99.1%) | 7 (0.9%) |
| 1 or 2 Children | 450 (89.8%) | 51 (10.2%) |
| 3 or 4 Children | 165 (100.0%) | 0 (0.0%) |
| 5 or more Children | 31 (100.0%) | 0 (0.0%) |
| Total | 1,412 (96.1%) | 58 (4.0%) |
Income Below Poverty Among Single-Parent Households in Lanham
According to the poverty data in Lanham, 3.5% or 11 single-father households and 8.9% or 53 single-mother households are living below the poverty line. Among single-father households, those with 3 or 4 children have the highest poverty rate, with 11 households (12.6%) experiencing poverty. Likewise, among single-mother households, those with 1 or 2 children have the highest poverty rate, with 37 households (14.0%) falling below the poverty line.
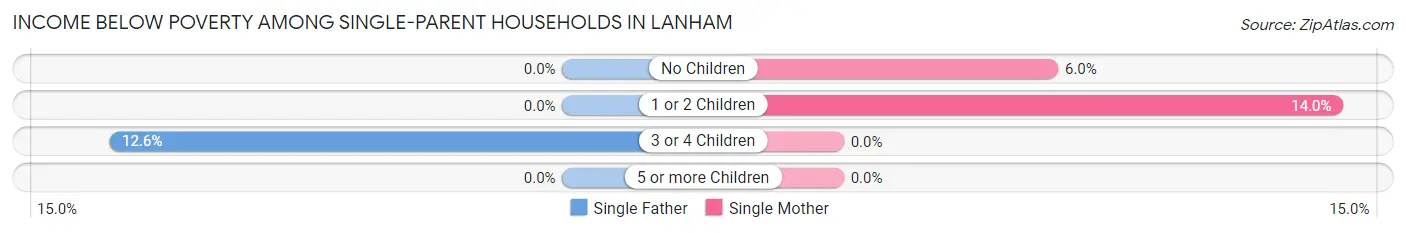
| Children | Single Father | Single Mother |
| No Children | 0 (0.0%) | 16 (6.0%) |
| 1 or 2 Children | 0 (0.0%) | 37 (14.0%) |
| 3 or 4 Children | 11 (12.6%) | 0 (0.0%) |
| 5 or more Children | 0 (0.0%) | 0 (0.0%) |
| Total | 11 (3.5%) | 53 (8.9%) |
Income Below Poverty Among Married-Couple vs Single-Parent Households in Lanham
The poverty data for Lanham shows that 58 of the married-couple family households (4.0%) and 64 of the single-parent households (7.0%) are living below the poverty level. Within the married-couple family households, those with 1 or 2 children have the highest poverty rate, with 51 households (10.2%) falling below the poverty line. Among the single-parent households, those with 1 or 2 children have the highest poverty rate, with 37 household (10.3%) living below poverty.
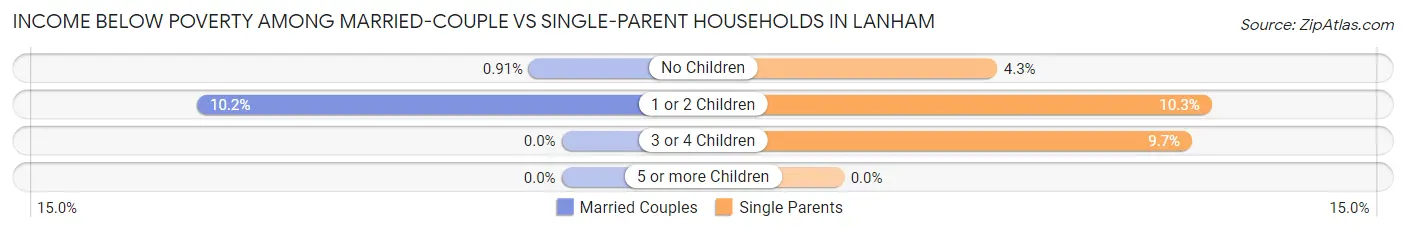
| Children | Married-Couple Families | Single-Parent Households |
| No Children | 7 (0.9%) | 16 (4.3%) |
| 1 or 2 Children | 51 (10.2%) | 37 (10.3%) |
| 3 or 4 Children | 0 (0.0%) | 11 (9.7%) |
| 5 or more Children | 0 (0.0%) | 0 (0.0%) |
| Total | 58 (4.0%) | 64 (7.0%) |
Race in Lanham
The most populous races in Lanham are Black / African American (6,284 | 53.9%), Hispanic or Latino (3,438 | 29.5%), and Some other Race (2,693 | 23.1%).
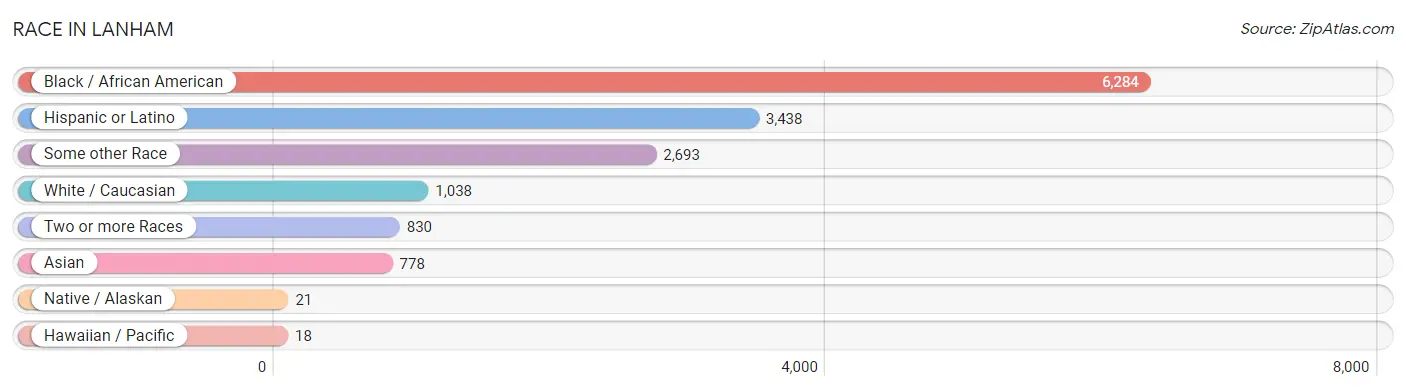
| Race | # Population | % Population |
| Asian | 778 | 6.7% |
| Black / African American | 6,284 | 53.9% |
| Hawaiian / Pacific | 18 | 0.2% |
| Hispanic or Latino | 3,438 | 29.5% |
| Native / Alaskan | 21 | 0.2% |
| White / Caucasian | 1,038 | 8.9% |
| Two or more Races | 830 | 7.1% |
| Some other Race | 2,693 | 23.1% |
| Total | 11,662 | 100.0% |
Ancestry in Lanham
The most populous ancestries reported in Lanham are Central American (2,158 | 18.5%), Salvadoran (1,485 | 12.7%), Subsaharan African (1,069 | 9.2%), Mexican (716 | 6.1%), and Guatemalan (648 | 5.6%), together accounting for 52.1% of all Lanham residents.
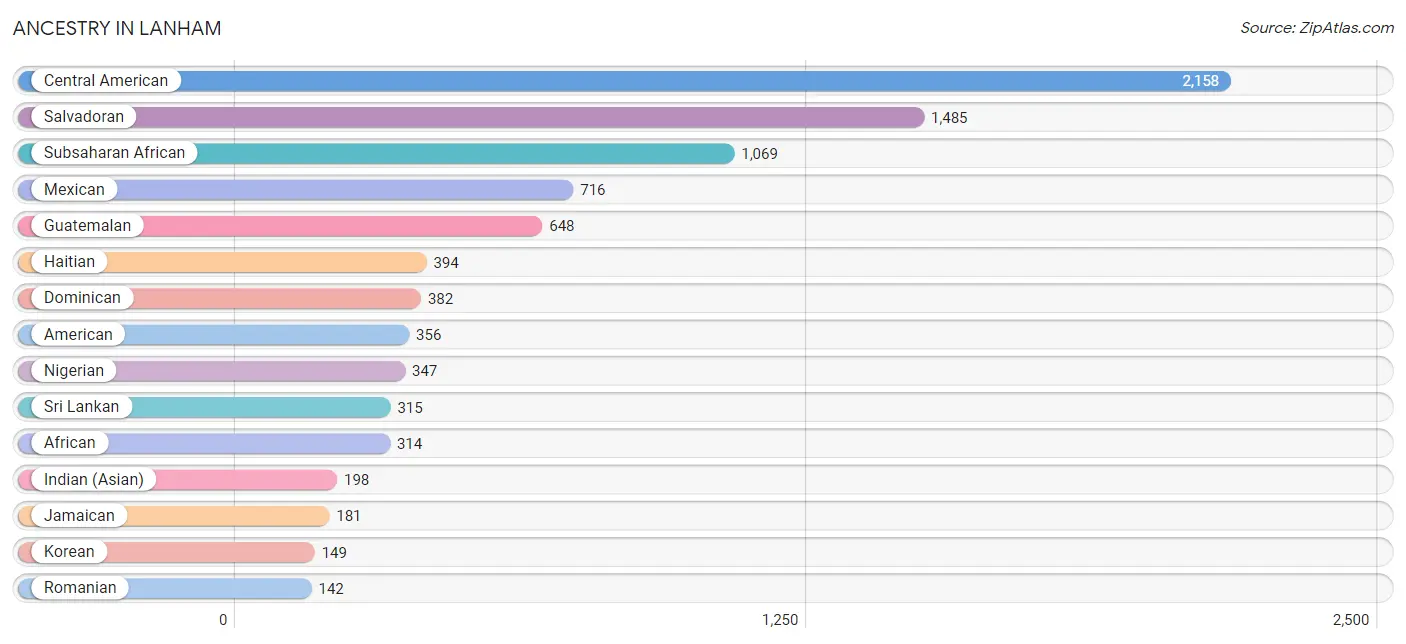
| Ancestry | # Population | % Population |
| African | 314 | 2.7% |
| American | 356 | 3.0% |
| Arab | 12 | 0.1% |
| Argentinean | 24 | 0.2% |
| Austrian | 43 | 0.4% |
| Bhutanese | 44 | 0.4% |
| British | 7 | 0.1% |
| Canadian | 6 | 0.1% |
| Central American | 2,158 | 18.5% |
| Central American Indian | 31 | 0.3% |
| Chilean | 7 | 0.1% |
| Dominican | 382 | 3.3% |
| Dutch | 6 | 0.1% |
| English | 117 | 1.0% |
| Ethiopian | 79 | 0.7% |
| European | 21 | 0.2% |
| French | 23 | 0.2% |
| French American Indian | 6 | 0.1% |
| French Canadian | 5 | 0.0% |
| German | 72 | 0.6% |
| Guatemalan | 648 | 5.6% |
| Guyanese | 111 | 0.9% |
| Haitian | 394 | 3.4% |
| Honduran | 25 | 0.2% |
| Hungarian | 19 | 0.2% |
| Indian (Asian) | 198 | 1.7% |
| Irish | 90 | 0.8% |
| Italian | 19 | 0.2% |
| Jamaican | 181 | 1.5% |
| Korean | 149 | 1.3% |
| Laotian | 17 | 0.2% |
| Lebanese | 5 | 0.0% |
| Liberian | 15 | 0.1% |
| Mexican | 716 | 6.1% |
| Mexican American Indian | 36 | 0.3% |
| Mongolian | 3 | 0.0% |
| Moroccan | 7 | 0.1% |
| Native Hawaiian | 18 | 0.2% |
| Nigerian | 347 | 3.0% |
| Norwegian | 6 | 0.1% |
| Peruvian | 8 | 0.1% |
| Polish | 93 | 0.8% |
| Romanian | 142 | 1.2% |
| Russian | 24 | 0.2% |
| Salvadoran | 1,485 | 12.7% |
| Scottish | 9 | 0.1% |
| Sierra Leonean | 27 | 0.2% |
| South American | 39 | 0.3% |
| Spanish | 30 | 0.3% |
| Sri Lankan | 315 | 2.7% |
| Subsaharan African | 1,069 | 9.2% |
| Thai | 43 | 0.4% |
| Trinidadian and Tobagonian | 34 | 0.3% |
| Turkish | 50 | 0.4% | View All 54 Rows |
Immigrants in Lanham
The most numerous immigrant groups reported in Lanham came from Latin America (2,821 | 24.2%), Central America (1,826 | 15.7%), Africa (1,073 | 9.2%), Caribbean (869 | 7.4%), and El Salvador (797 | 6.8%), together accounting for 63.3% of all Lanham residents.
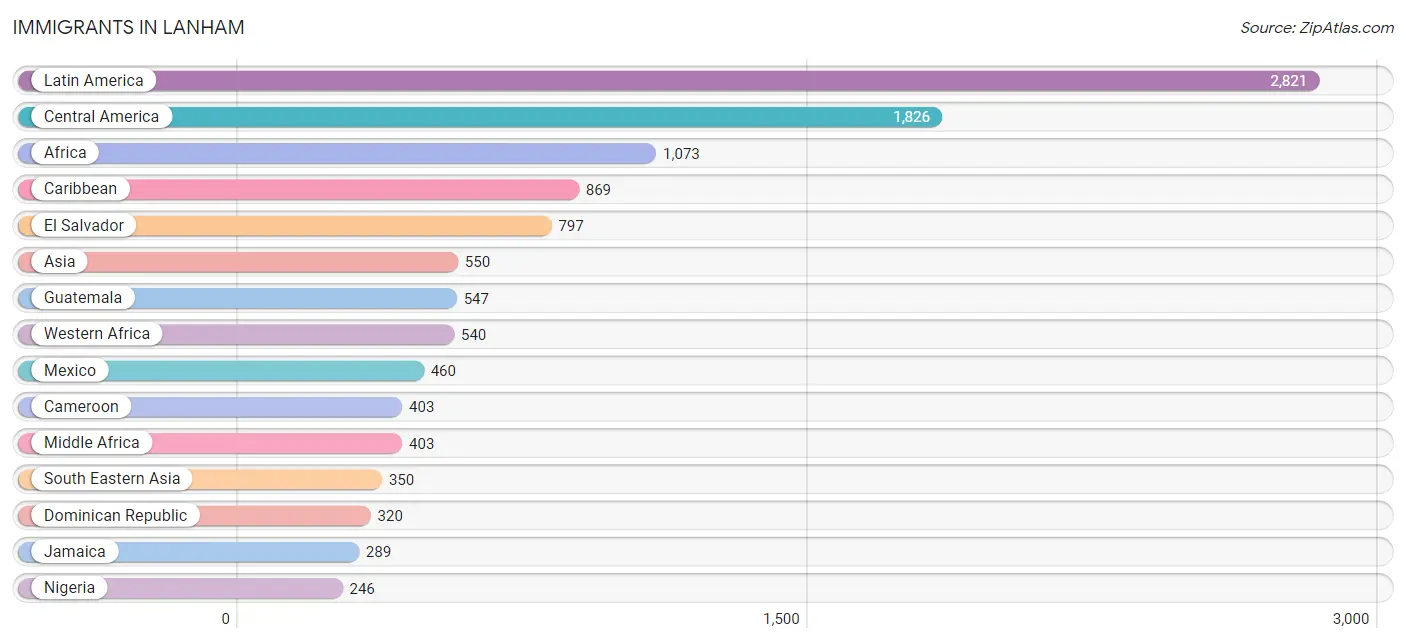
| Immigration Origin | # Population | % Population |
| Africa | 1,073 | 9.2% |
| Asia | 550 | 4.7% |
| Austria | 20 | 0.2% |
| Cameroon | 403 | 3.5% |
| Canada | 9 | 0.1% |
| Caribbean | 869 | 7.4% |
| Central America | 1,826 | 15.7% |
| Chile | 7 | 0.1% |
| China | 148 | 1.3% |
| Dominican Republic | 320 | 2.7% |
| Eastern Africa | 90 | 0.8% |
| Eastern Asia | 158 | 1.3% |
| Eastern Europe | 78 | 0.7% |
| El Salvador | 797 | 6.8% |
| Eritrea | 13 | 0.1% |
| Ethiopia | 77 | 0.7% |
| Europe | 186 | 1.6% |
| Germany | 18 | 0.2% |
| Guatemala | 547 | 4.7% |
| Guyana | 111 | 0.9% |
| Haiti | 218 | 1.9% |
| Honduras | 22 | 0.2% |
| Hungary | 6 | 0.1% |
| India | 2 | 0.0% |
| Indonesia | 17 | 0.2% |
| Ireland | 70 | 0.6% |
| Jamaica | 289 | 2.5% |
| Korea | 10 | 0.1% |
| Latin America | 2,821 | 24.2% |
| Mexico | 460 | 3.9% |
| Middle Africa | 403 | 3.5% |
| Morocco | 7 | 0.1% |
| Nigeria | 246 | 2.1% |
| Northern Africa | 7 | 0.1% |
| Northern Europe | 70 | 0.6% |
| Pakistan | 29 | 0.3% |
| Peru | 8 | 0.1% |
| Philippines | 139 | 1.2% |
| Romania | 72 | 0.6% |
| Sierra Leone | 85 | 0.7% |
| South America | 126 | 1.1% |
| South Central Asia | 31 | 0.3% |
| South Eastern Asia | 350 | 3.0% |
| Trinidad and Tobago | 42 | 0.4% |
| Turkey | 11 | 0.1% |
| Vietnam | 194 | 1.7% |
| Western Africa | 540 | 4.6% |
| Western Asia | 11 | 0.1% |
| Western Europe | 38 | 0.3% | View All 49 Rows |
Sex and Age in Lanham
Sex and Age in Lanham
The most populous age groups in Lanham are 60 to 64 Years (505 | 8.5%) for men and 50 to 54 Years (679 | 11.8%) for women.
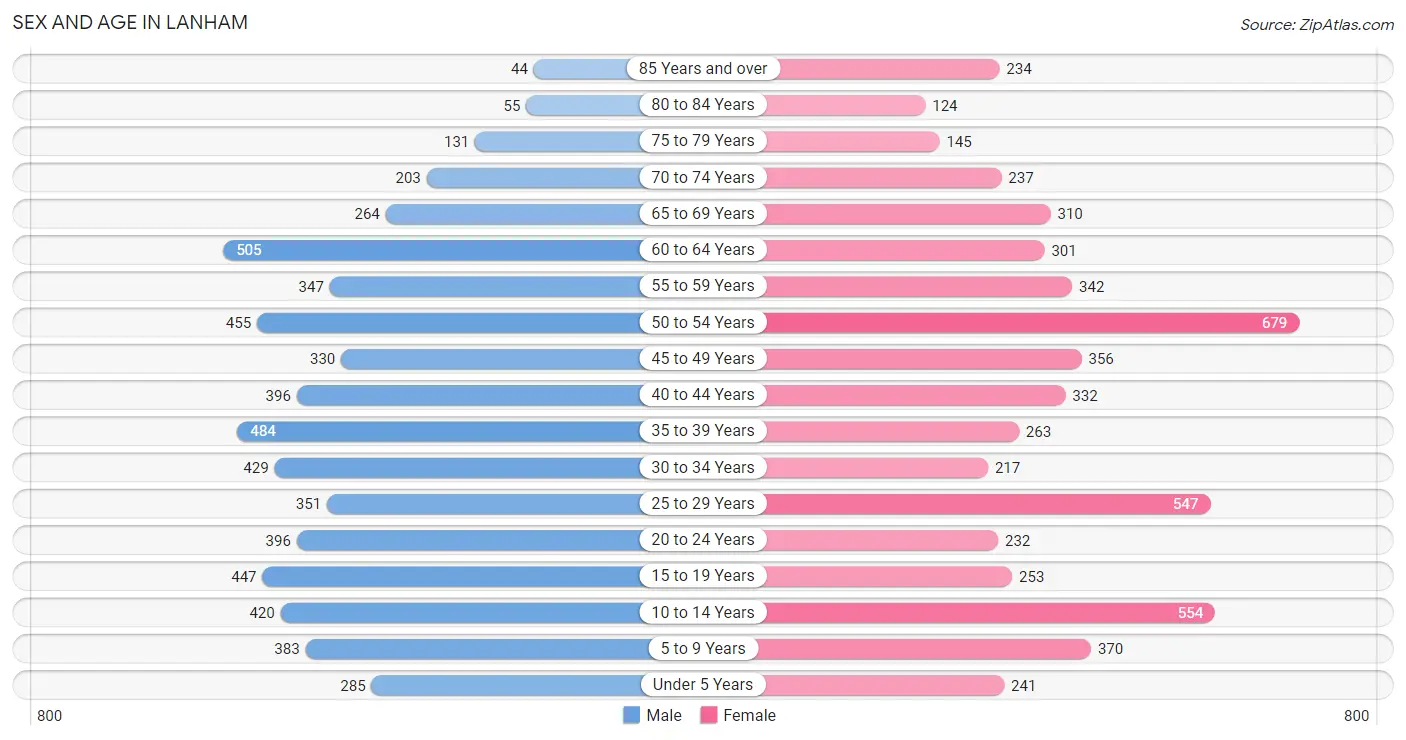
| Age Bracket | Male | Female |
| Under 5 Years | 285 (4.8%) | 241 (4.2%) |
| 5 to 9 Years | 383 (6.5%) | 370 (6.5%) |
| 10 to 14 Years | 420 (7.1%) | 554 (9.7%) |
| 15 to 19 Years | 447 (7.5%) | 253 (4.4%) |
| 20 to 24 Years | 396 (6.7%) | 232 (4.0%) |
| 25 to 29 Years | 351 (5.9%) | 547 (9.5%) |
| 30 to 34 Years | 429 (7.2%) | 217 (3.8%) |
| 35 to 39 Years | 484 (8.2%) | 263 (4.6%) |
| 40 to 44 Years | 396 (6.7%) | 332 (5.8%) |
| 45 to 49 Years | 330 (5.6%) | 356 (6.2%) |
| 50 to 54 Years | 455 (7.7%) | 679 (11.8%) |
| 55 to 59 Years | 347 (5.9%) | 342 (6.0%) |
| 60 to 64 Years | 505 (8.5%) | 301 (5.2%) |
| 65 to 69 Years | 264 (4.5%) | 310 (5.4%) |
| 70 to 74 Years | 203 (3.4%) | 237 (4.1%) |
| 75 to 79 Years | 131 (2.2%) | 145 (2.5%) |
| 80 to 84 Years | 55 (0.9%) | 124 (2.2%) |
| 85 Years and over | 44 (0.7%) | 234 (4.1%) |
| Total | 5,925 (100.0%) | 5,737 (100.0%) |
Families and Households in Lanham
Median Family Size in Lanham
The median family size in Lanham is 4.27 persons per family, with single female/mother families (598 | 25.1%) accounting for the largest median family size of 4.84 persons per family. On the other hand, single male/father families (311 | 13.1%) represent the smallest median family size with 4.07 persons per family.
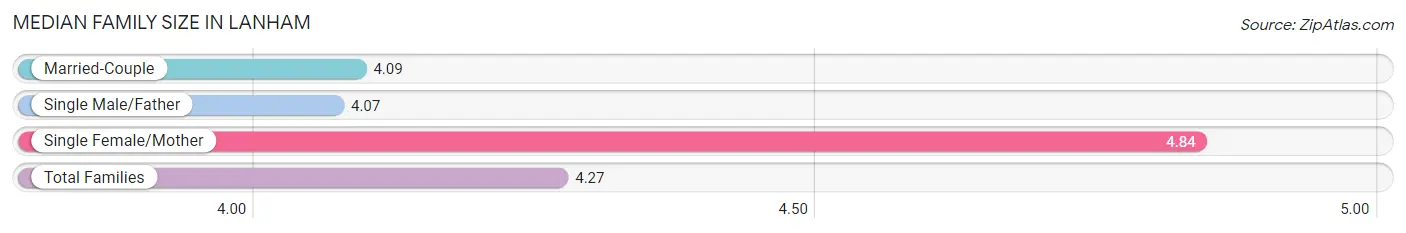
| Family Type | # Families | Family Size |
| Married-Couple | 1,470 (61.8%) | 4.09 |
| Single Male/Father | 311 (13.1%) | 4.07 |
| Single Female/Mother | 598 (25.1%) | 4.84 |
| Total Families | 2,379 (100.0%) | 4.27 |
Median Household Size in Lanham
The median household size in Lanham is 3.71 persons per household, with single female/mother households (598 | 19.1%) accounting for the largest median household size of 5.28 persons per household. non-family households (746 | 23.9%) represent the smallest median household size with 1.17 persons per household.
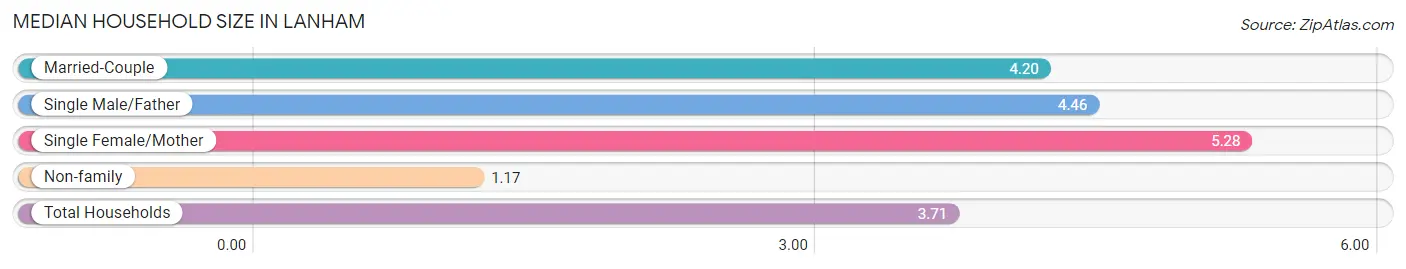
| Household Type | # Households | Household Size |
| Married-Couple | 1,470 (47.0%) | 4.20 |
| Single Male/Father | 311 (10.0%) | 4.46 |
| Single Female/Mother | 598 (19.1%) | 5.28 |
| Non-family | 746 (23.9%) | 1.17 |
| Total Households | 3,125 (100.0%) | 3.71 |
Household Size by Marriage Status in Lanham
Out of a total of 3,125 households in Lanham, 2,379 (76.1%) are family households, while 746 (23.9%) are nonfamily households. The most numerous type of family households are 4-person households, comprising 659, and the most common type of nonfamily households are 1-person households, comprising 653.
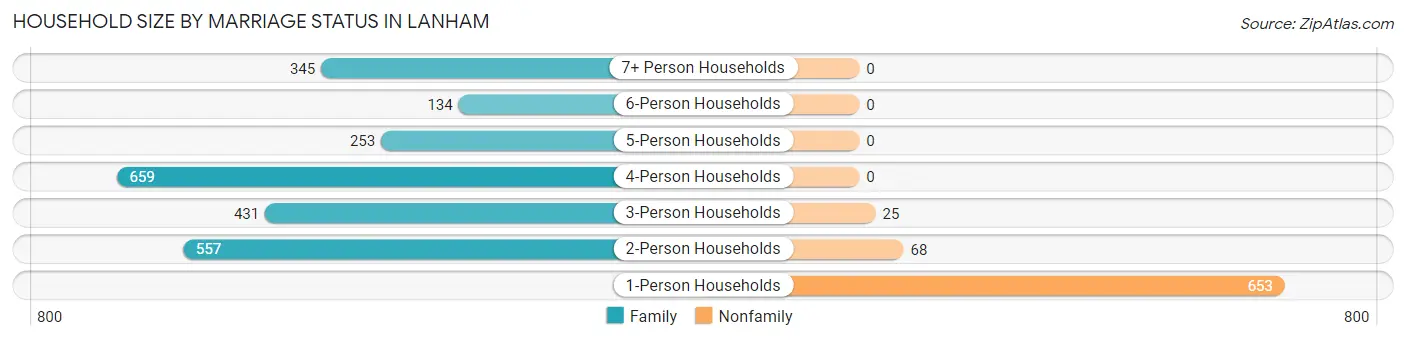
| Household Size | Family Households | Nonfamily Households |
| 1-Person Households | - | 653 (20.9%) |
| 2-Person Households | 557 (17.8%) | 68 (2.2%) |
| 3-Person Households | 431 (13.8%) | 25 (0.8%) |
| 4-Person Households | 659 (21.1%) | 0 (0.0%) |
| 5-Person Households | 253 (8.1%) | 0 (0.0%) |
| 6-Person Households | 134 (4.3%) | 0 (0.0%) |
| 7+ Person Households | 345 (11.0%) | 0 (0.0%) |
| Total | 2,379 (76.1%) | 746 (23.9%) |
Female Fertility in Lanham
Fertility by Age in Lanham
Average fertility rate in Lanham is 69.0 births per 1,000 women. Women in the age bracket of 20 to 34 years have the highest fertility rate with 91.0 births per 1,000 women. Women in the age bracket of 20 to 34 years acount for 56.9% of all women with births.
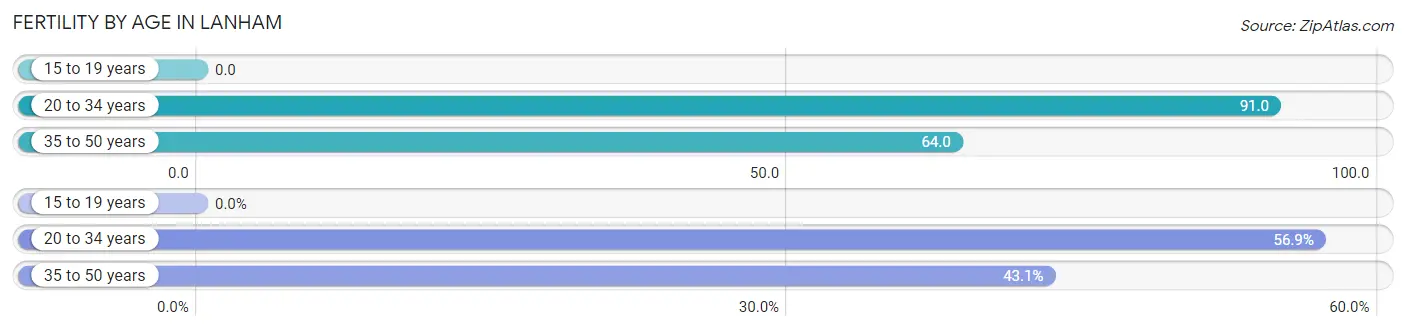
| Age Bracket | Women with Births | Births / 1,000 Women |
| 15 to 19 years | 0 (0.0%) | 0.0 |
| 20 to 34 years | 91 (56.9%) | 91.0 |
| 35 to 50 years | 69 (43.1%) | 64.0 |
| Total | 160 (100.0%) | 69.0 |
Fertility by Age by Marriage Status in Lanham
49.4% of women with births (160) in Lanham are married. The highest percentage of unmarried women with births falls into 20 to 34 years age bracket with 89.0% of them unmarried at the time of birth, while the lowest percentage of unmarried women with births belong to 35 to 50 years age bracket with 0.0% of them unmarried.
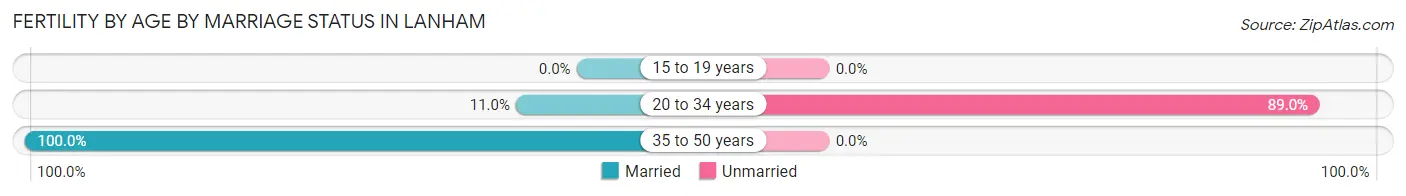
| Age Bracket | Married | Unmarried |
| 15 to 19 years | 0 (0.0%) | 0 (0.0%) |
| 20 to 34 years | 10 (11.0%) | 81 (89.0%) |
| 35 to 50 years | 69 (100.0%) | 0 (0.0%) |
| Total | 79 (49.4%) | 81 (50.6%) |
Fertility by Education in Lanham
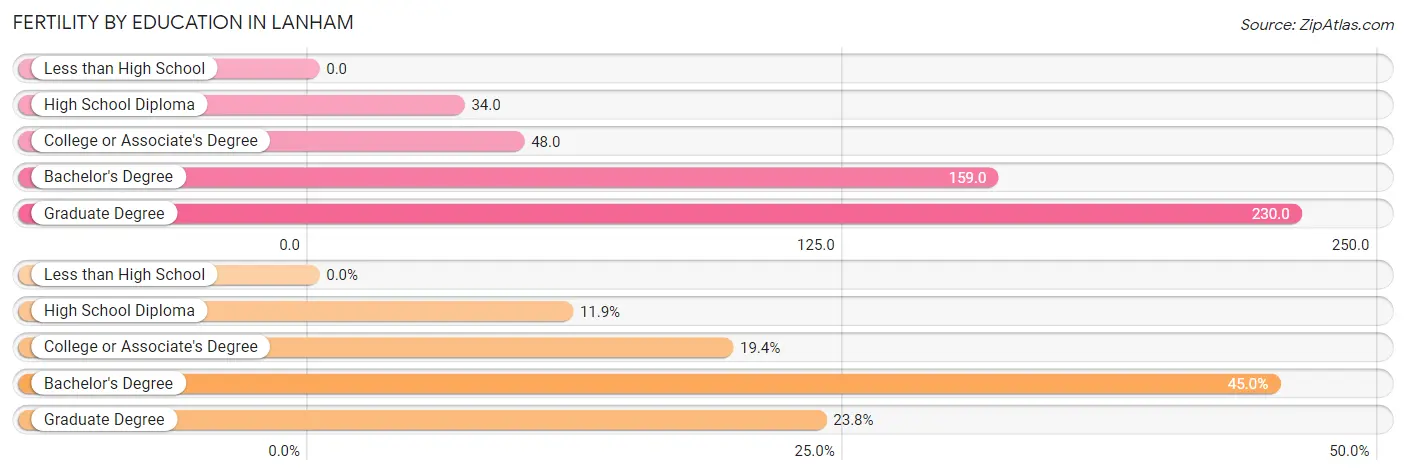
| Educational Attainment | Women with Births | Births / 1,000 Women |
| Less than High School | 0 (0.0%) | 0.0 |
| High School Diploma | 19 (11.9%) | 34.0 |
| College or Associate's Degree | 31 (19.4%) | 48.0 |
| Bachelor's Degree | 72 (45.0%) | 159.0 |
| Graduate Degree | 38 (23.7%) | 230.0 |
| Total | 160 (100.0%) | 69.0 |
Fertility by Education by Marriage Status in Lanham
50.6% of women with births in Lanham are unmarried. Women with the educational attainment of college or associate's degree are most likely to be married with 100.0% of them married at childbirth, while women with the educational attainment of bachelor's degree are least likely to be married with 100.0% of them unmarried at childbirth.
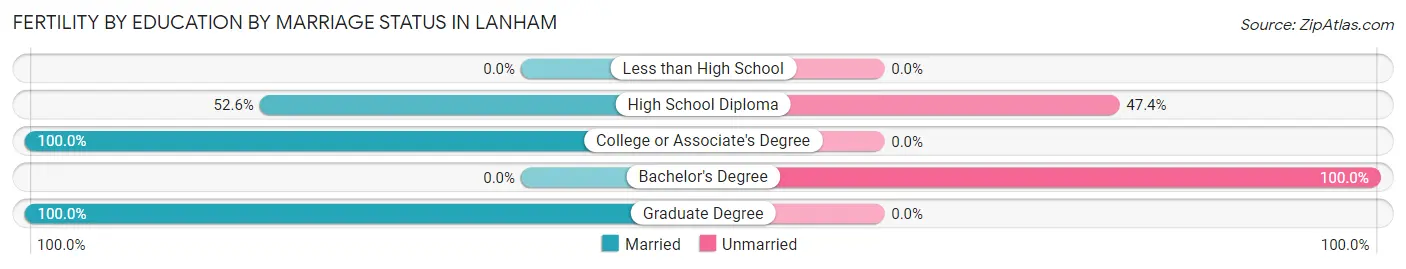
| Educational Attainment | Married | Unmarried |
| Less than High School | 0 (0.0%) | 0 (0.0%) |
| High School Diploma | 10 (52.6%) | 9 (47.4%) |
| College or Associate's Degree | 31 (100.0%) | 0 (0.0%) |
| Bachelor's Degree | 0 (0.0%) | 72 (100.0%) |
| Graduate Degree | 38 (100.0%) | 0 (0.0%) |
| Total | 79 (49.4%) | 81 (50.6%) |
Employment Characteristics in Lanham
Employment by Class of Employer in Lanham
Among the 5,442 employed individuals in Lanham, private company employees (3,457 | 63.5%), federal government employees (517 | 9.5%), and not-for-profit organizations (365 | 6.7%) make up the most common classes of employment.
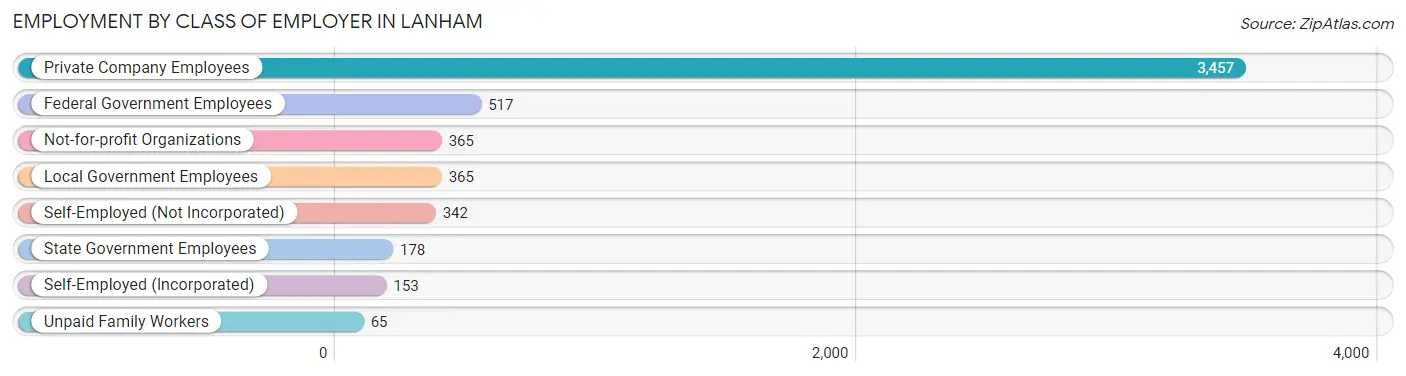
| Employer Class | # Employees | % Employees |
| Private Company Employees | 3,457 | 63.5% |
| Self-Employed (Incorporated) | 153 | 2.8% |
| Self-Employed (Not Incorporated) | 342 | 6.3% |
| Not-for-profit Organizations | 365 | 6.7% |
| Local Government Employees | 365 | 6.7% |
| State Government Employees | 178 | 3.3% |
| Federal Government Employees | 517 | 9.5% |
| Unpaid Family Workers | 65 | 1.2% |
| Total | 5,442 | 100.0% |
Employment Status by Age in Lanham
According to the labor force statistics for Lanham, out of the total population over 16 years of age (9,086), 67.4% or 6,124 individuals are in the labor force, with 9.0% or 551 of them unemployed. The age group with the highest labor force participation rate is 30 to 34 years, with 93.7% or 605 individuals in the labor force. Within the labor force, the 16 to 19 years age range has the highest percentage of unemployed individuals, with 24.0% or 24 of them being unemployed.
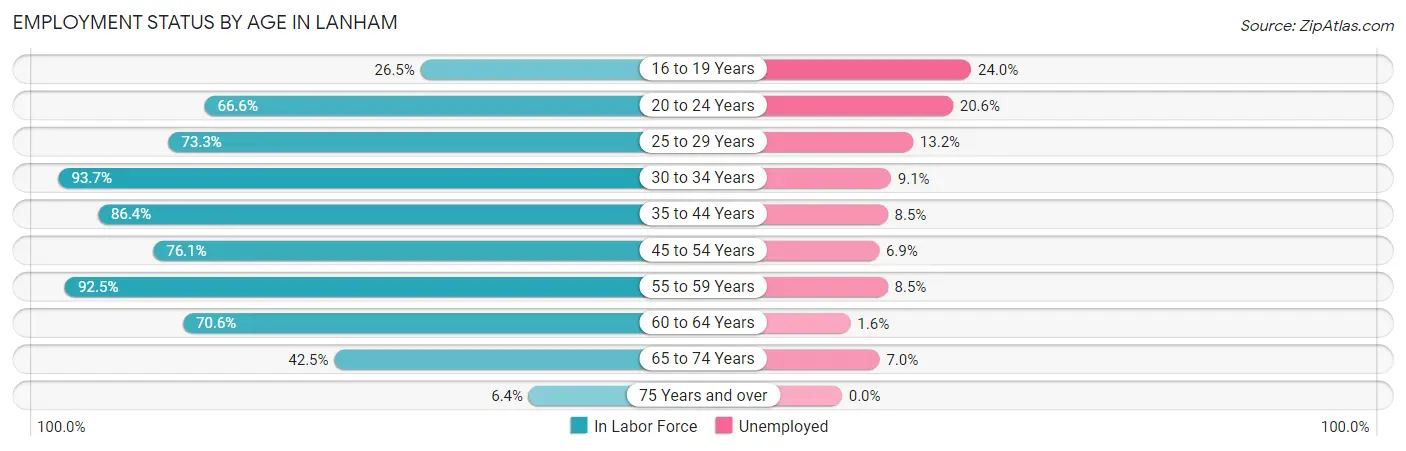
| Age Bracket | In Labor Force | Unemployed |
| 16 to 19 Years | 100 (26.5%) | 24 (24.0%) |
| 20 to 24 Years | 418 (66.6%) | 86 (20.6%) |
| 25 to 29 Years | 658 (73.3%) | 87 (13.2%) |
| 30 to 34 Years | 605 (93.7%) | 55 (9.1%) |
| 35 to 44 Years | 1,274 (86.4%) | 108 (8.5%) |
| 45 to 54 Years | 1,385 (76.1%) | 96 (6.9%) |
| 55 to 59 Years | 637 (92.5%) | 54 (8.5%) |
| 60 to 64 Years | 569 (70.6%) | 9 (1.6%) |
| 65 to 74 Years | 431 (42.5%) | 30 (7.0%) |
| 75 Years and over | 47 (6.4%) | 0 (0.0%) |
| Total | 6,124 (67.4%) | 551 (9.0%) |
Employment Status by Educational Attainment in Lanham
According to labor force statistics for Lanham, 81.0% of individuals (5,131) out of the total population between 25 and 64 years of age (6,334) are in the labor force, with 8.0% or 410 of them being unemployed. The group with the highest labor force participation rate are those with the educational attainment of bachelor's degree or higher, with 89.4% or 1,468 individuals in the labor force. Within the labor force, individuals with high school diploma education have the highest percentage of unemployment, with 17.1% or 234 of them being unemployed.
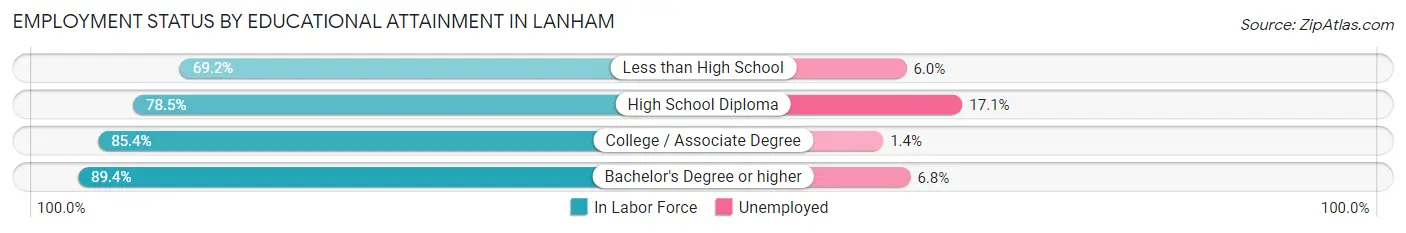
| Educational Attainment | In Labor Force | Unemployed |
| Less than High School | 961 (69.2%) | 83 (6.0%) |
| High School Diploma | 1,370 (78.5%) | 298 (17.1%) |
| College / Associate Degree | 1,331 (85.4%) | 22 (1.4%) |
| Bachelor's Degree or higher | 1,468 (89.4%) | 112 (6.8%) |
| Total | 5,131 (81.0%) | 507 (8.0%) |
Employment Occupations by Sex in Lanham
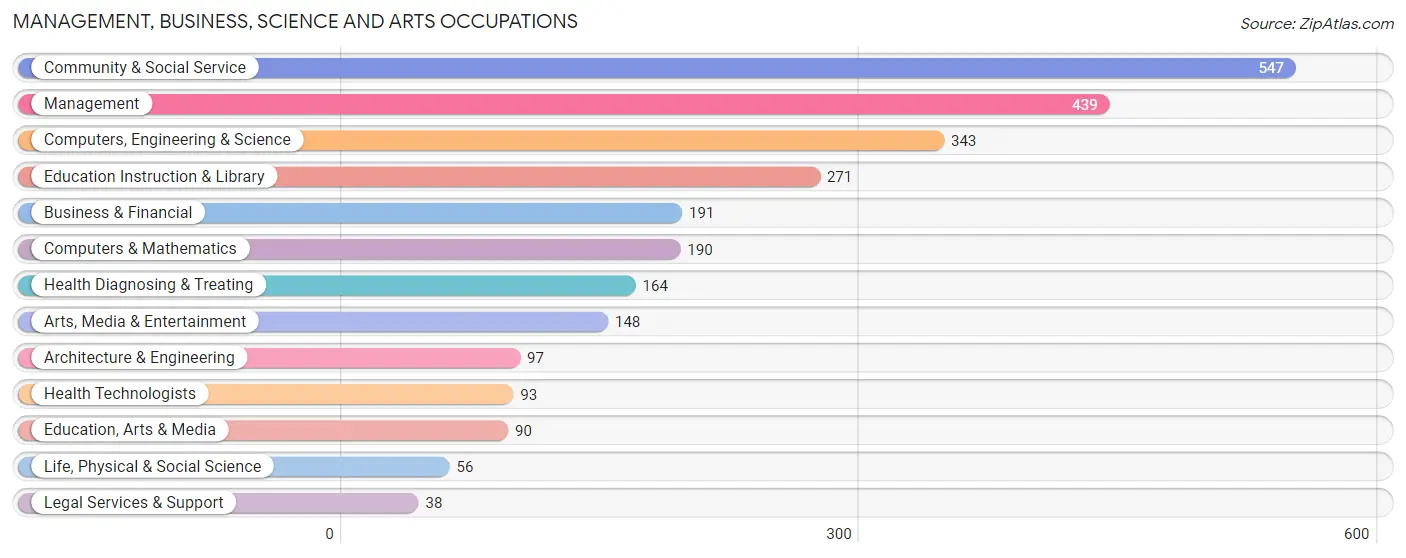
Management, Business, Science and Arts Occupations
The most common Management, Business, Science and Arts occupations in Lanham are Community & Social Service (547 | 9.8%), Management (439 | 7.9%), Computers, Engineering & Science (343 | 6.1%), Education Instruction & Library (271 | 4.9%), and Business & Financial (191 | 3.4%).
Management, Business, Science and Arts Occupations by Sex
Within the Management, Business, Science and Arts occupations in Lanham, the most male-oriented occupations are Architecture & Engineering (100.0%), Management (71.5%), and Life, Physical & Social Science (67.9%), while the most female-oriented occupations are Business & Financial (97.9%), Arts, Media & Entertainment (89.2%), and Education Instruction & Library (85.6%).
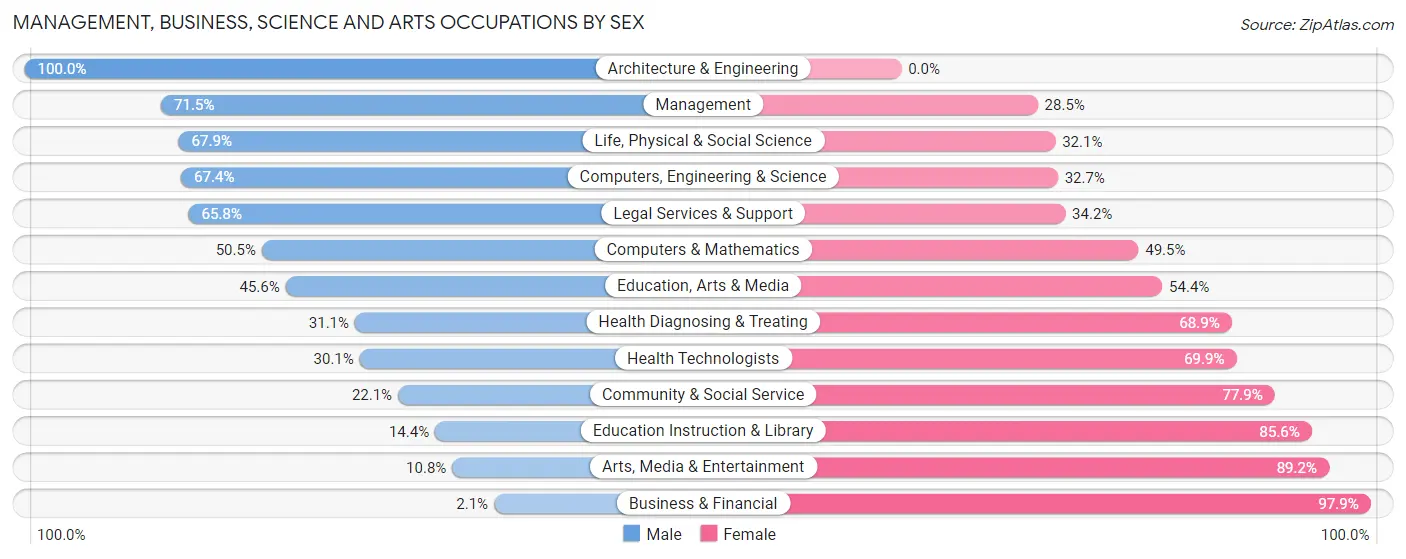
| Occupation | Male | Female |
| Management | 314 (71.5%) | 125 (28.5%) |
| Business & Financial | 4 (2.1%) | 187 (97.9%) |
| Computers, Engineering & Science | 231 (67.3%) | 112 (32.7%) |
| Computers & Mathematics | 96 (50.5%) | 94 (49.5%) |
| Architecture & Engineering | 97 (100.0%) | 0 (0.0%) |
| Life, Physical & Social Science | 38 (67.9%) | 18 (32.1%) |
| Community & Social Service | 121 (22.1%) | 426 (77.9%) |
| Education, Arts & Media | 41 (45.6%) | 49 (54.4%) |
| Legal Services & Support | 25 (65.8%) | 13 (34.2%) |
| Education Instruction & Library | 39 (14.4%) | 232 (85.6%) |
| Arts, Media & Entertainment | 16 (10.8%) | 132 (89.2%) |
| Health Diagnosing & Treating | 51 (31.1%) | 113 (68.9%) |
| Health Technologists | 28 (30.1%) | 65 (69.9%) |
| Total (Category) | 721 (42.8%) | 963 (57.2%) |
| Total (Overall) | 3,152 (56.5%) | 2,423 (43.5%) |
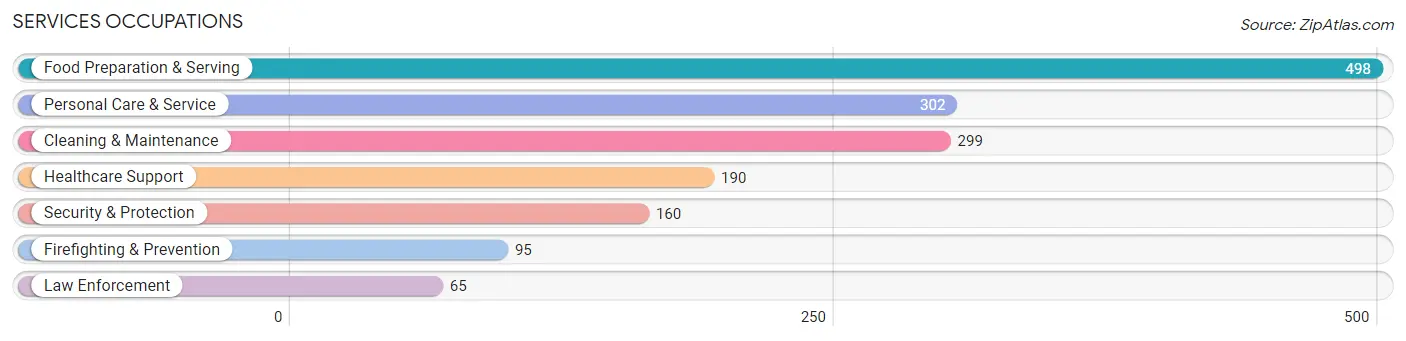
Services Occupations
The most common Services occupations in Lanham are Food Preparation & Serving (498 | 8.9%), Personal Care & Service (302 | 5.4%), Cleaning & Maintenance (299 | 5.4%), Healthcare Support (190 | 3.4%), and Security & Protection (160 | 2.9%).
Services Occupations by Sex
Within the Services occupations in Lanham, the most male-oriented occupations are Law Enforcement (100.0%), Security & Protection (85.0%), and Firefighting & Prevention (74.7%), while the most female-oriented occupations are Food Preparation & Serving (59.0%), Personal Care & Service (55.0%), and Cleaning & Maintenance (53.8%).
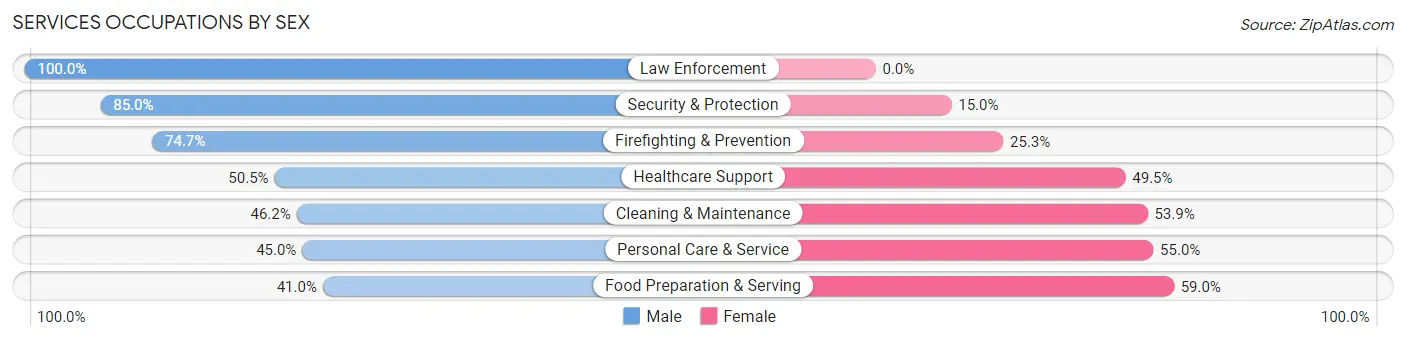
| Occupation | Male | Female |
| Healthcare Support | 96 (50.5%) | 94 (49.5%) |
| Security & Protection | 136 (85.0%) | 24 (15.0%) |
| Firefighting & Prevention | 71 (74.7%) | 24 (25.3%) |
| Law Enforcement | 65 (100.0%) | 0 (0.0%) |
| Food Preparation & Serving | 204 (41.0%) | 294 (59.0%) |
| Cleaning & Maintenance | 138 (46.2%) | 161 (53.8%) |
| Personal Care & Service | 136 (45.0%) | 166 (55.0%) |
| Total (Category) | 710 (49.0%) | 739 (51.0%) |
| Total (Overall) | 3,152 (56.5%) | 2,423 (43.5%) |
Sales and Office Occupations
The most common Sales and Office occupations in Lanham are Office & Administration (552 | 9.9%), and Sales & Related (332 | 6.0%).
Sales and Office Occupations by Sex
| Occupation | Male | Female |
| Sales & Related | 149 (44.9%) | 183 (55.1%) |
| Office & Administration | 88 (15.9%) | 464 (84.1%) |
| Total (Category) | 237 (26.8%) | 647 (73.2%) |
| Total (Overall) | 3,152 (56.5%) | 2,423 (43.5%) |
Natural Resources, Construction and Maintenance Occupations
The most common Natural Resources, Construction and Maintenance occupations in Lanham are Construction & Extraction (783 | 14.0%), and Installation, Maintenance & Repair (223 | 4.0%).
Natural Resources, Construction and Maintenance Occupations by Sex
| Occupation | Male | Female |
| Farming, Fishing & Forestry | 0 (0.0%) | 0 (0.0%) |
| Construction & Extraction | 783 (100.0%) | 0 (0.0%) |
| Installation, Maintenance & Repair | 223 (100.0%) | 0 (0.0%) |
| Total (Category) | 1,006 (100.0%) | 0 (0.0%) |
| Total (Overall) | 3,152 (56.5%) | 2,423 (43.5%) |
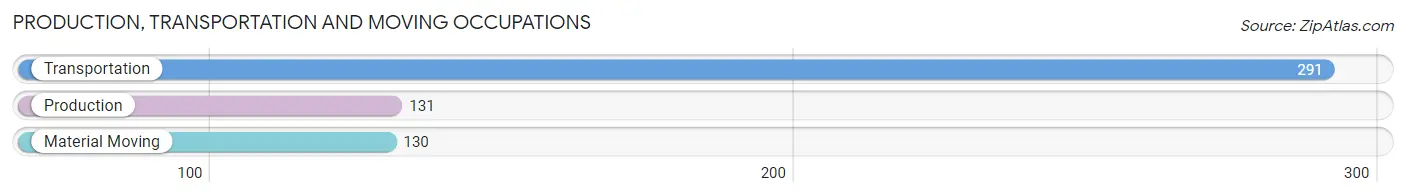
Production, Transportation and Moving Occupations
The most common Production, Transportation and Moving occupations in Lanham are Transportation (291 | 5.2%), Production (131 | 2.4%), and Material Moving (130 | 2.3%).
Production, Transportation and Moving Occupations by Sex
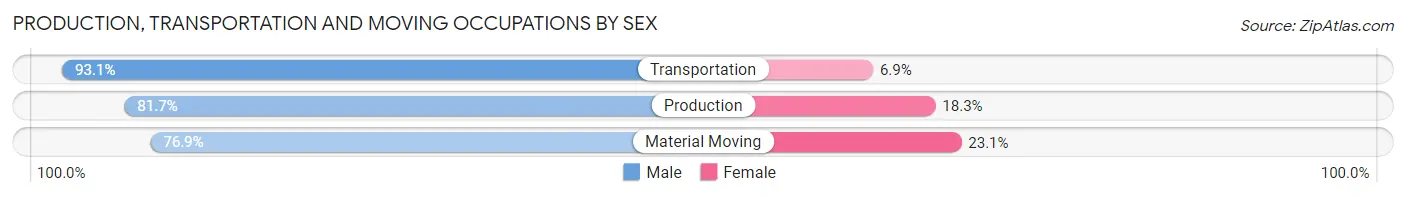
| Occupation | Male | Female |
| Production | 107 (81.7%) | 24 (18.3%) |
| Transportation | 271 (93.1%) | 20 (6.9%) |
| Material Moving | 100 (76.9%) | 30 (23.1%) |
| Total (Category) | 478 (86.6%) | 74 (13.4%) |
| Total (Overall) | 3,152 (56.5%) | 2,423 (43.5%) |
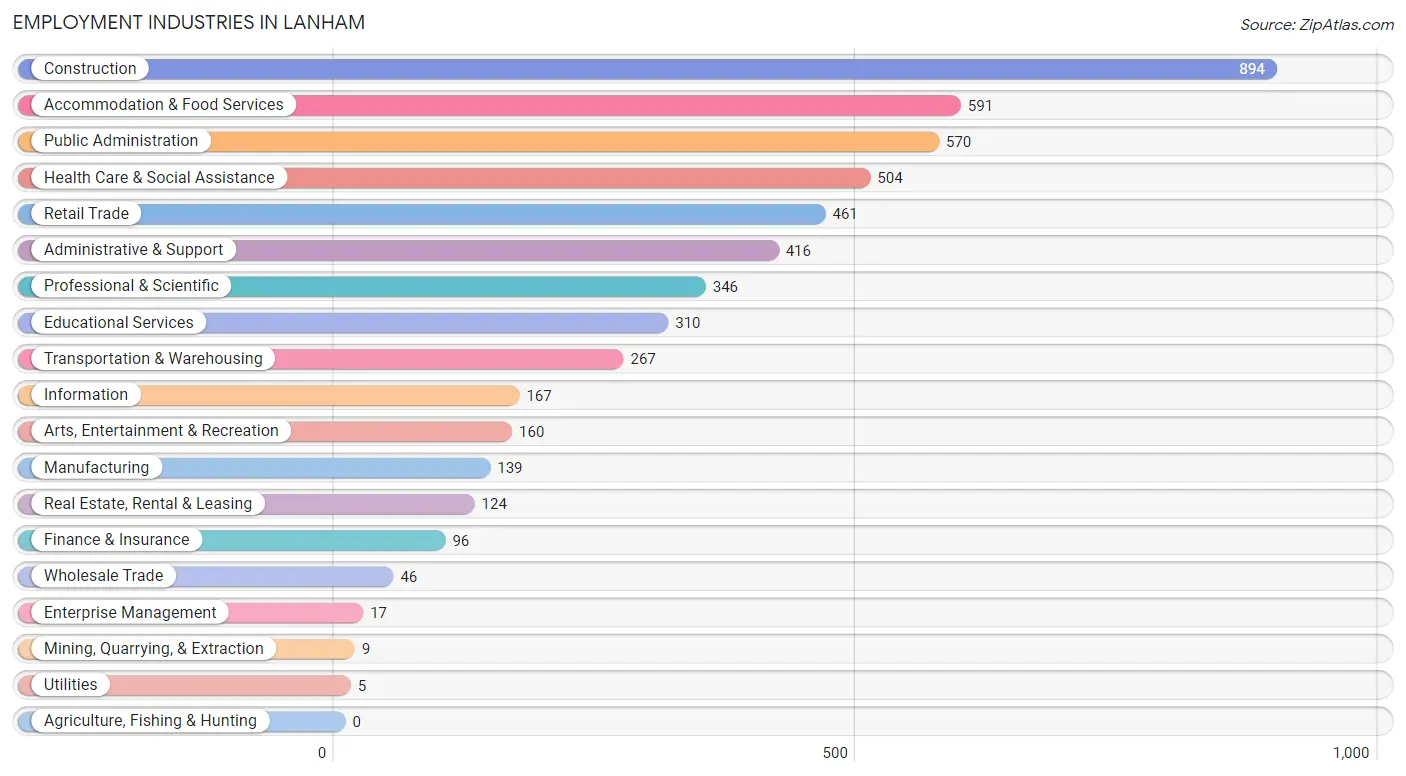
Employment Industries by Sex in Lanham
Employment Industries in Lanham
The major employment industries in Lanham include Construction (894 | 16.0%), Accommodation & Food Services (591 | 10.6%), Public Administration (570 | 10.2%), Health Care & Social Assistance (504 | 9.0%), and Retail Trade (461 | 8.3%).
Employment Industries by Sex in Lanham
The Lanham industries that see more men than women are Mining, Quarrying, & Extraction (100.0%), Construction (100.0%), and Utilities (100.0%), whereas the industries that tend to have a higher number of women are Finance & Insurance (95.8%), Information (74.3%), and Educational Services (70.0%).
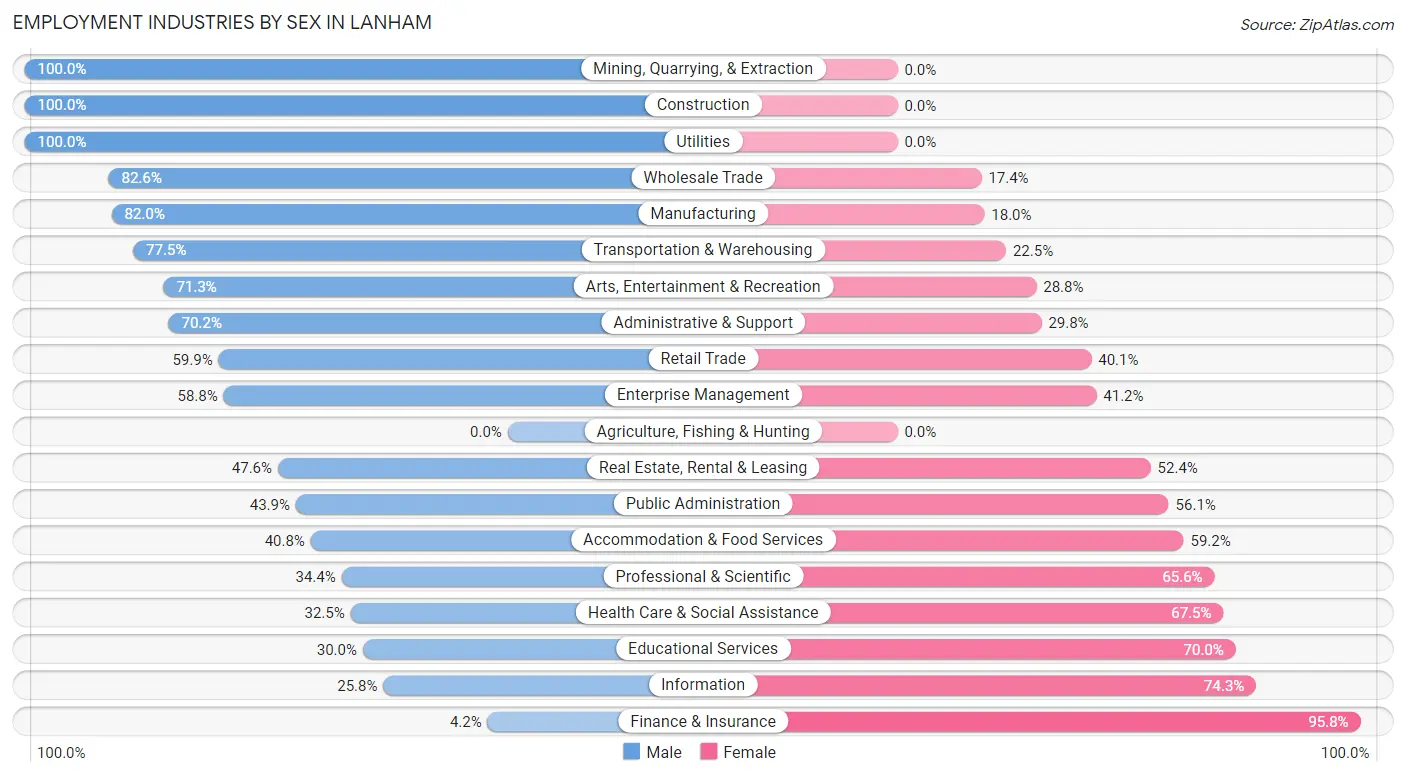
| Industry | Male | Female |
| Agriculture, Fishing & Hunting | 0 (0.0%) | 0 (0.0%) |
| Mining, Quarrying, & Extraction | 9 (100.0%) | 0 (0.0%) |
| Construction | 894 (100.0%) | 0 (0.0%) |
| Manufacturing | 114 (82.0%) | 25 (18.0%) |
| Wholesale Trade | 38 (82.6%) | 8 (17.4%) |
| Retail Trade | 276 (59.9%) | 185 (40.1%) |
| Transportation & Warehousing | 207 (77.5%) | 60 (22.5%) |
| Utilities | 5 (100.0%) | 0 (0.0%) |
| Information | 43 (25.8%) | 124 (74.3%) |
| Finance & Insurance | 4 (4.2%) | 92 (95.8%) |
| Real Estate, Rental & Leasing | 59 (47.6%) | 65 (52.4%) |
| Professional & Scientific | 119 (34.4%) | 227 (65.6%) |
| Enterprise Management | 10 (58.8%) | 7 (41.2%) |
| Administrative & Support | 292 (70.2%) | 124 (29.8%) |
| Educational Services | 93 (30.0%) | 217 (70.0%) |
| Health Care & Social Assistance | 164 (32.5%) | 340 (67.5%) |
| Arts, Entertainment & Recreation | 114 (71.3%) | 46 (28.7%) |
| Accommodation & Food Services | 241 (40.8%) | 350 (59.2%) |
| Public Administration | 250 (43.9%) | 320 (56.1%) |
| Total | 3,152 (56.5%) | 2,423 (43.5%) |
Education in Lanham
School Enrollment in Lanham
The most common levels of schooling among the 3,119 students in Lanham are middle school (864 | 27.7%), elementary school (651 | 20.9%), and college / undergraduate (591 | 19.0%).
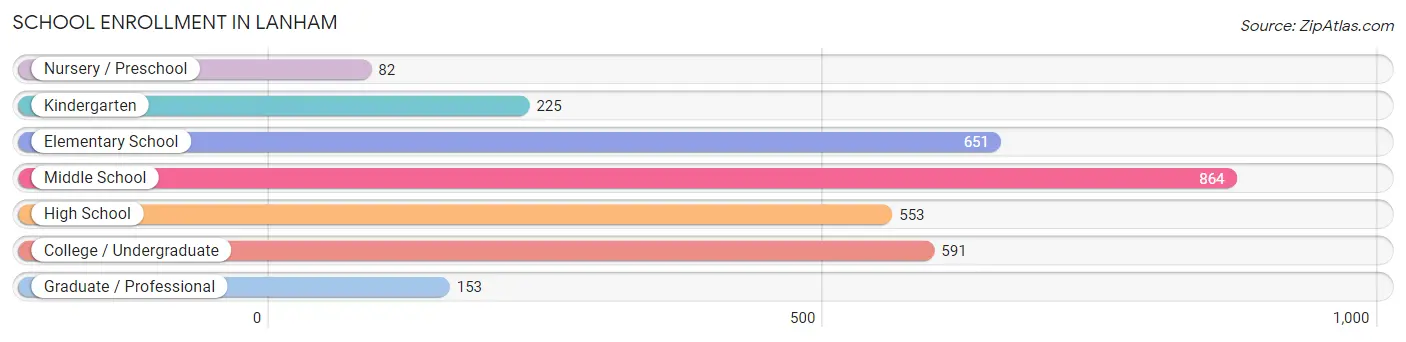
| School Level | # Students | % Students |
| Nursery / Preschool | 82 | 2.6% |
| Kindergarten | 225 | 7.2% |
| Elementary School | 651 | 20.9% |
| Middle School | 864 | 27.7% |
| High School | 553 | 17.7% |
| College / Undergraduate | 591 | 19.0% |
| Graduate / Professional | 153 | 4.9% |
| Total | 3,119 | 100.0% |
School Enrollment by Age by Funding Source in Lanham
Out of a total of 3,119 students who are enrolled in schools in Lanham, 387 (12.4%) attend a private institution, while the remaining 2,732 (87.6%) are enrolled in public schools. The age group of 25 to 34 year olds has the highest likelihood of being enrolled in private schools, with 72 (52.2% in the age bracket) enrolled. Conversely, the age group of 3 to 4 year olds has the lowest likelihood of being enrolled in a private school, with 112 (100.0% in the age bracket) attending a public institution.
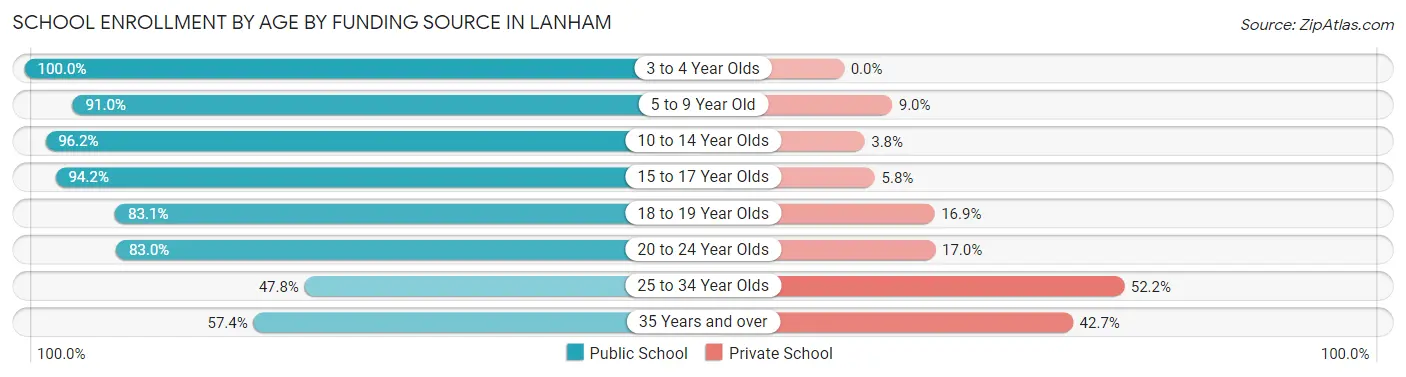
| Age Bracket | Public School | Private School |
| 3 to 4 Year Olds | 112 (100.0%) | 0 (0.0%) |
| 5 to 9 Year Old | 650 (91.0%) | 64 (9.0%) |
| 10 to 14 Year Olds | 902 (96.2%) | 36 (3.8%) |
| 15 to 17 Year Olds | 540 (94.2%) | 33 (5.8%) |
| 18 to 19 Year Olds | 69 (83.1%) | 14 (16.9%) |
| 20 to 24 Year Olds | 234 (83.0%) | 48 (17.0%) |
| 25 to 34 Year Olds | 66 (47.8%) | 72 (52.2%) |
| 35 Years and over | 160 (57.4%) | 119 (42.6%) |
| Total | 2,732 (87.6%) | 387 (12.4%) |
Educational Attainment by Field of Study in Lanham
Business (491 | 22.3%), science & technology (244 | 11.1%), communications (220 | 10.0%), computers & mathematics (206 | 9.4%), and social sciences (150 | 6.8%) are the most common fields of study among 2,202 individuals in Lanham who have obtained a bachelor's degree or higher.
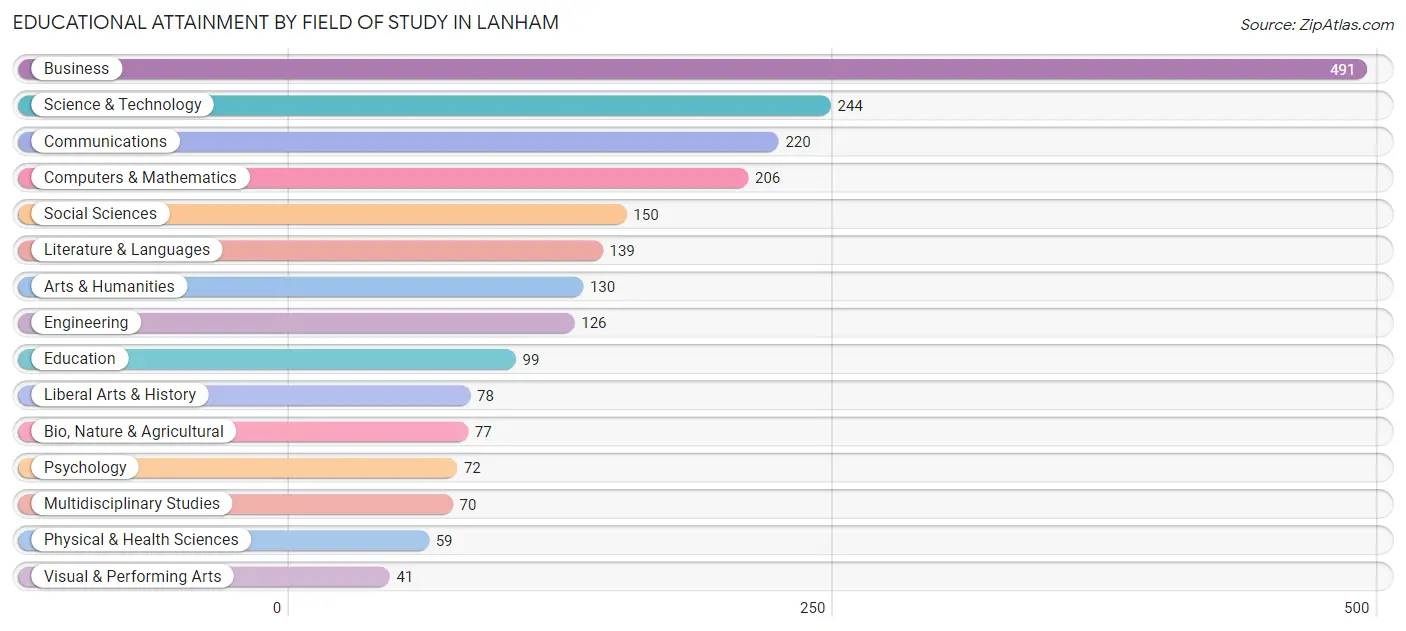
| Field of Study | # Graduates | % Graduates |
| Computers & Mathematics | 206 | 9.4% |
| Bio, Nature & Agricultural | 77 | 3.5% |
| Physical & Health Sciences | 59 | 2.7% |
| Psychology | 72 | 3.3% |
| Social Sciences | 150 | 6.8% |
| Engineering | 126 | 5.7% |
| Multidisciplinary Studies | 70 | 3.2% |
| Science & Technology | 244 | 11.1% |
| Business | 491 | 22.3% |
| Education | 99 | 4.5% |
| Literature & Languages | 139 | 6.3% |
| Liberal Arts & History | 78 | 3.5% |
| Visual & Performing Arts | 41 | 1.9% |
| Communications | 220 | 10.0% |
| Arts & Humanities | 130 | 5.9% |
| Total | 2,202 | 100.0% |
Transportation & Commute in Lanham
Vehicle Availability by Sex in Lanham
The most prevalent vehicle ownership categories in Lanham are males with 2 vehicles (999, accounting for 32.5%) and females with 2 vehicles (854, making up 42.3%).
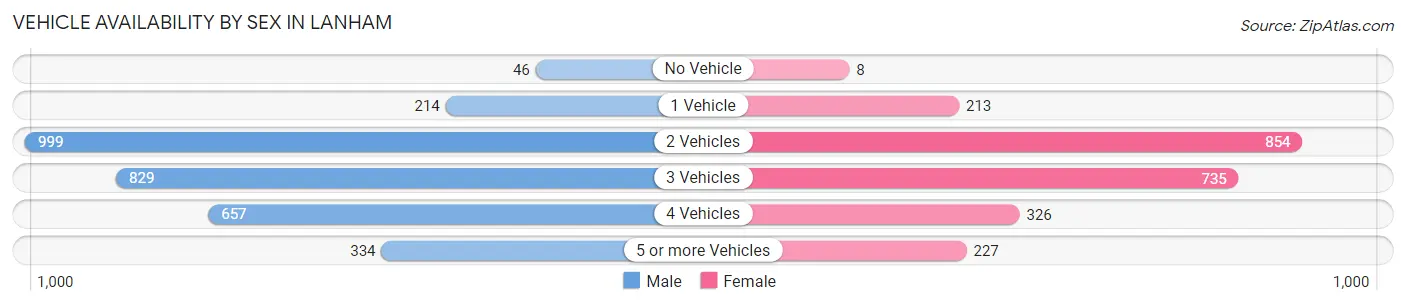
| Vehicles Available | Male | Female |
| No Vehicle | 46 (1.5%) | 8 (0.3%) |
| 1 Vehicle | 214 (7.0%) | 213 (9.0%) |
| 2 Vehicles | 999 (32.5%) | 854 (36.1%) |
| 3 Vehicles | 829 (26.9%) | 735 (31.1%) |
| 4 Vehicles | 657 (21.3%) | 326 (13.8%) |
| 5 or more Vehicles | 334 (10.8%) | 227 (9.6%) |
| Total | 3,079 (100.0%) | 2,363 (100.0%) |
Commute Time in Lanham
The most frequently occuring commute durations in Lanham are 30 to 34 minutes (1,352 commuters, 27.5%), 25 to 29 minutes (745 commuters, 15.2%), and 20 to 24 minutes (719 commuters, 14.6%).
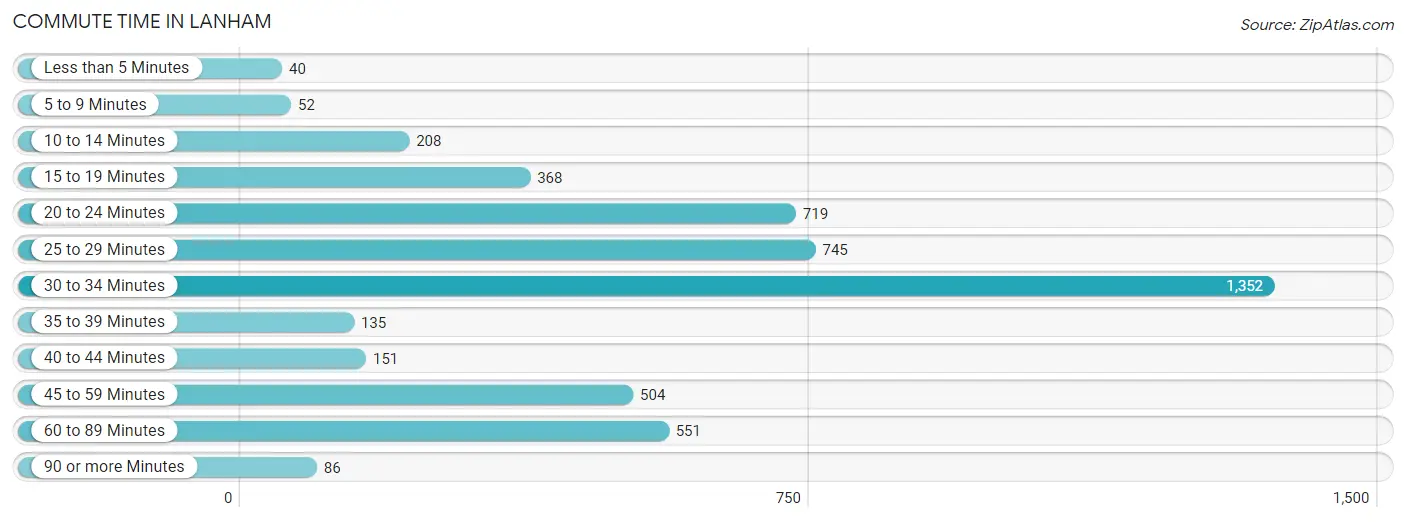
| Commute Time | # Commuters | % Commuters |
| Less than 5 Minutes | 40 | 0.8% |
| 5 to 9 Minutes | 52 | 1.1% |
| 10 to 14 Minutes | 208 | 4.2% |
| 15 to 19 Minutes | 368 | 7.5% |
| 20 to 24 Minutes | 719 | 14.6% |
| 25 to 29 Minutes | 745 | 15.2% |
| 30 to 34 Minutes | 1,352 | 27.5% |
| 35 to 39 Minutes | 135 | 2.8% |
| 40 to 44 Minutes | 151 | 3.1% |
| 45 to 59 Minutes | 504 | 10.3% |
| 60 to 89 Minutes | 551 | 11.2% |
| 90 or more Minutes | 86 | 1.8% |
Commute Time by Sex in Lanham
The most common commute times in Lanham are 30 to 34 minutes (839 commuters, 28.3%) for males and 30 to 34 minutes (513 commuters, 26.3%) for females.
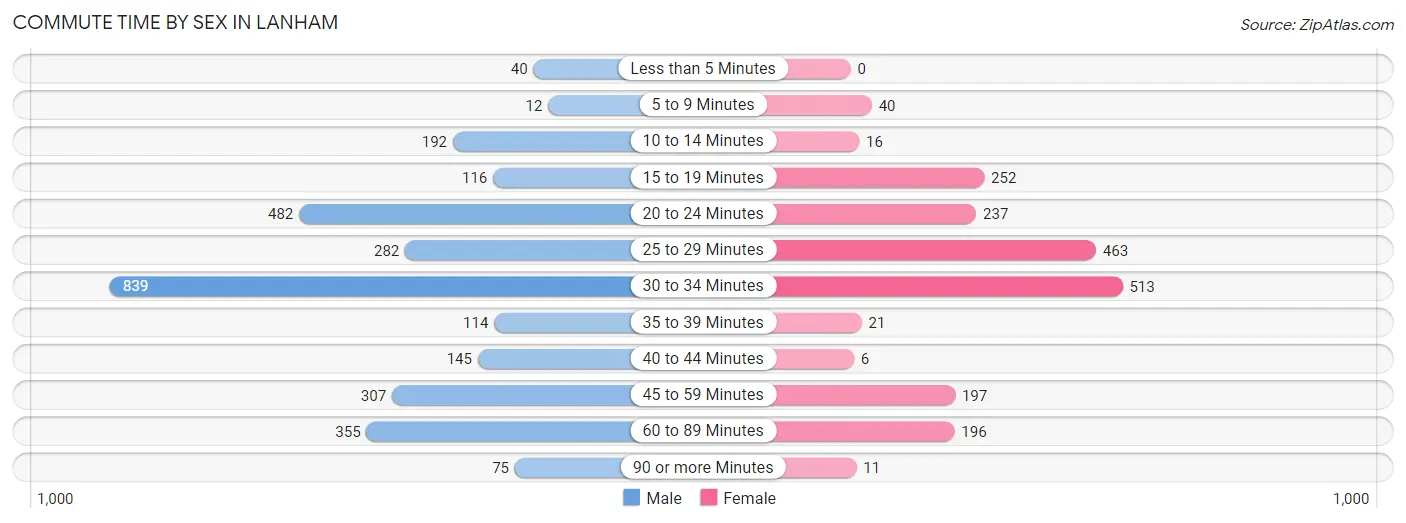
| Commute Time | Male | Female |
| Less than 5 Minutes | 40 (1.3%) | 0 (0.0%) |
| 5 to 9 Minutes | 12 (0.4%) | 40 (2.1%) |
| 10 to 14 Minutes | 192 (6.5%) | 16 (0.8%) |
| 15 to 19 Minutes | 116 (3.9%) | 252 (12.9%) |
| 20 to 24 Minutes | 482 (16.3%) | 237 (12.1%) |
| 25 to 29 Minutes | 282 (9.5%) | 463 (23.7%) |
| 30 to 34 Minutes | 839 (28.3%) | 513 (26.3%) |
| 35 to 39 Minutes | 114 (3.8%) | 21 (1.1%) |
| 40 to 44 Minutes | 145 (4.9%) | 6 (0.3%) |
| 45 to 59 Minutes | 307 (10.4%) | 197 (10.1%) |
| 60 to 89 Minutes | 355 (12.0%) | 196 (10.0%) |
| 90 or more Minutes | 75 (2.5%) | 11 (0.6%) |
Time of Departure to Work by Sex in Lanham
The most frequent times of departure to work in Lanham are 6:00 AM to 6:29 AM (628, 21.2%) for males and 4:00 PM to 11:59 PM (307, 15.7%) for females.
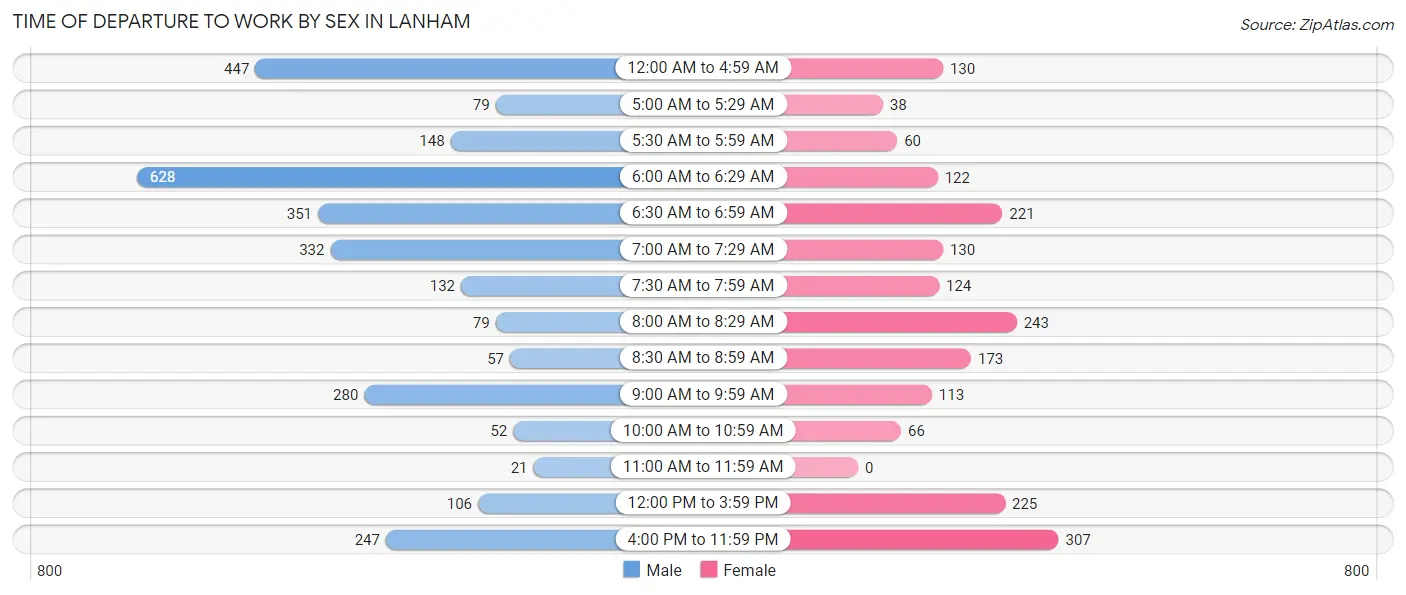
| Time of Departure | Male | Female |
| 12:00 AM to 4:59 AM | 447 (15.1%) | 130 (6.7%) |
| 5:00 AM to 5:29 AM | 79 (2.7%) | 38 (1.9%) |
| 5:30 AM to 5:59 AM | 148 (5.0%) | 60 (3.1%) |
| 6:00 AM to 6:29 AM | 628 (21.2%) | 122 (6.2%) |
| 6:30 AM to 6:59 AM | 351 (11.9%) | 221 (11.3%) |
| 7:00 AM to 7:29 AM | 332 (11.2%) | 130 (6.7%) |
| 7:30 AM to 7:59 AM | 132 (4.5%) | 124 (6.4%) |
| 8:00 AM to 8:29 AM | 79 (2.7%) | 243 (12.4%) |
| 8:30 AM to 8:59 AM | 57 (1.9%) | 173 (8.9%) |
| 9:00 AM to 9:59 AM | 280 (9.5%) | 113 (5.8%) |
| 10:00 AM to 10:59 AM | 52 (1.8%) | 66 (3.4%) |
| 11:00 AM to 11:59 AM | 21 (0.7%) | 0 (0.0%) |
| 12:00 PM to 3:59 PM | 106 (3.6%) | 225 (11.5%) |
| 4:00 PM to 11:59 PM | 247 (8.4%) | 307 (15.7%) |
| Total | 2,959 (100.0%) | 1,952 (100.0%) |
Housing Occupancy in Lanham
Occupancy by Ownership in Lanham
Of the total 3,125 dwellings in Lanham, owner-occupied units account for 2,438 (78.0%), while renter-occupied units make up 687 (22.0%).
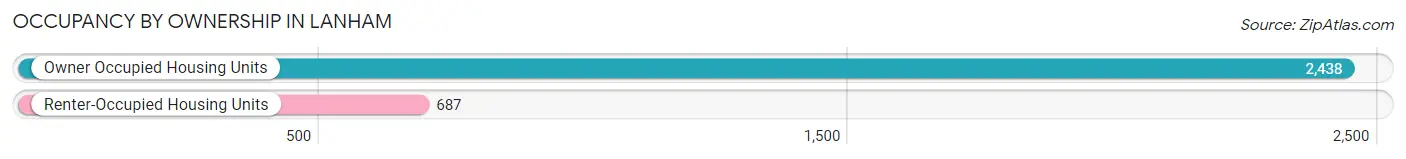
| Occupancy | # Housing Units | % Housing Units |
| Owner Occupied Housing Units | 2,438 | 78.0% |
| Renter-Occupied Housing Units | 687 | 22.0% |
| Total Occupied Housing Units | 3,125 | 100.0% |
Occupancy by Household Size in Lanham
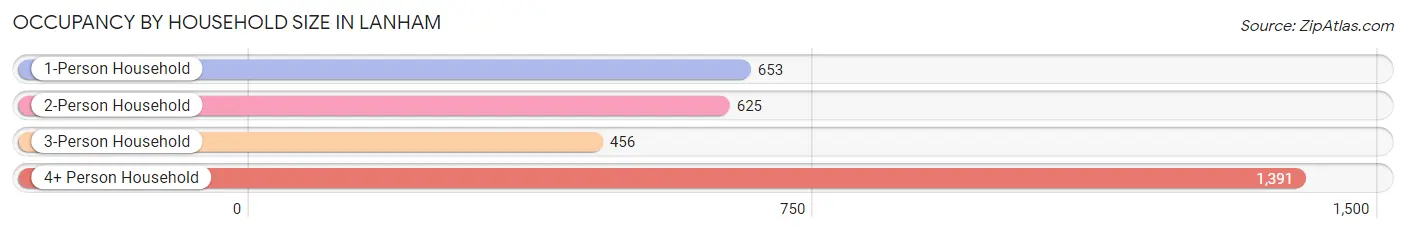
| Household Size | # Housing Units | % Housing Units |
| 1-Person Household | 653 | 20.9% |
| 2-Person Household | 625 | 20.0% |
| 3-Person Household | 456 | 14.6% |
| 4+ Person Household | 1,391 | 44.5% |
| Total Housing Units | 3,125 | 100.0% |
Occupancy by Ownership by Household Size in Lanham
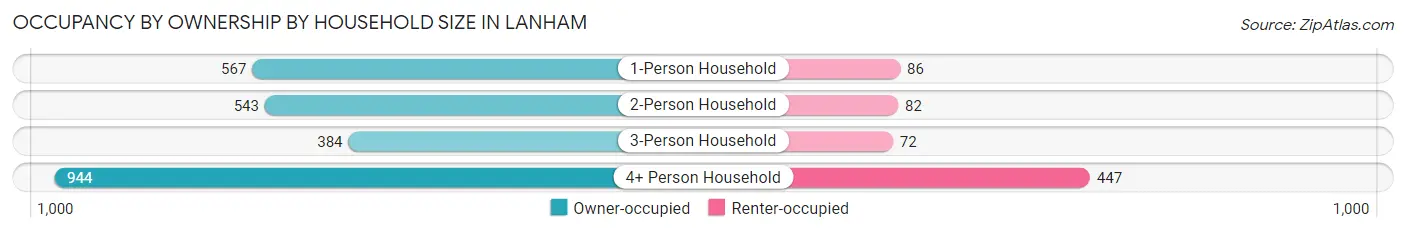
| Household Size | Owner-occupied | Renter-occupied |
| 1-Person Household | 567 (86.8%) | 86 (13.2%) |
| 2-Person Household | 543 (86.9%) | 82 (13.1%) |
| 3-Person Household | 384 (84.2%) | 72 (15.8%) |
| 4+ Person Household | 944 (67.9%) | 447 (32.1%) |
| Total Housing Units | 2,438 (78.0%) | 687 (22.0%) |
Occupancy by Educational Attainment in Lanham
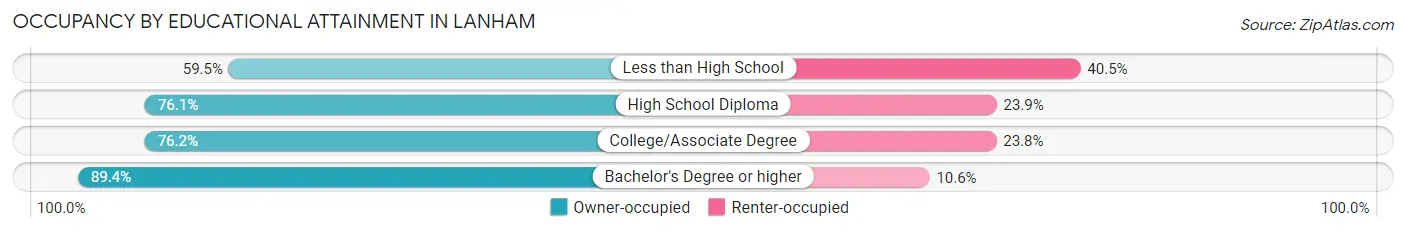
| Household Size | Owner-occupied | Renter-occupied |
| Less than High School | 269 (59.5%) | 183 (40.5%) |
| High School Diploma | 638 (76.1%) | 200 (23.9%) |
| College/Associate Degree | 633 (76.2%) | 198 (23.8%) |
| Bachelor's Degree or higher | 898 (89.4%) | 106 (10.6%) |
Occupancy by Age of Householder in Lanham
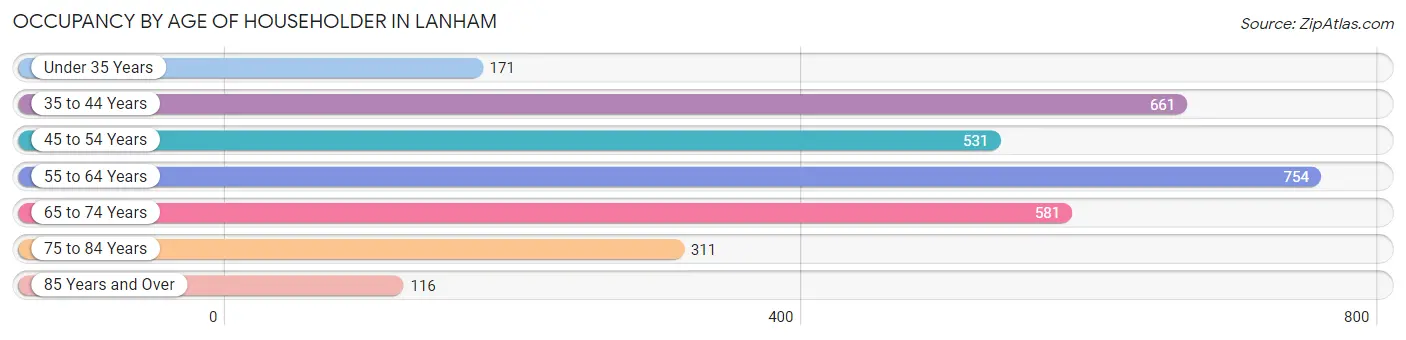
| Age Bracket | # Households | % Households |
| Under 35 Years | 171 | 5.5% |
| 35 to 44 Years | 661 | 21.1% |
| 45 to 54 Years | 531 | 17.0% |
| 55 to 64 Years | 754 | 24.1% |
| 65 to 74 Years | 581 | 18.6% |
| 75 to 84 Years | 311 | 10.0% |
| 85 Years and Over | 116 | 3.7% |
| Total | 3,125 | 100.0% |
Housing Finances in Lanham
Median Income by Occupancy in Lanham
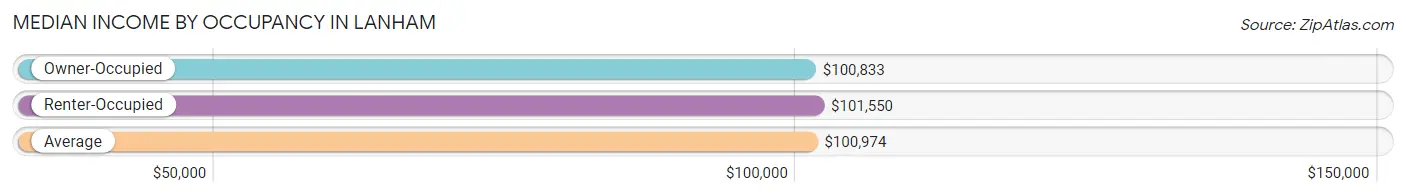
| Occupancy Type | # Households | Median Income |
| Owner-Occupied | 2,438 (78.0%) | $100,833 |
| Renter-Occupied | 687 (22.0%) | $101,550 |
| Average | 3,125 (100.0%) | $100,974 |
Occupancy by Householder Income Bracket in Lanham
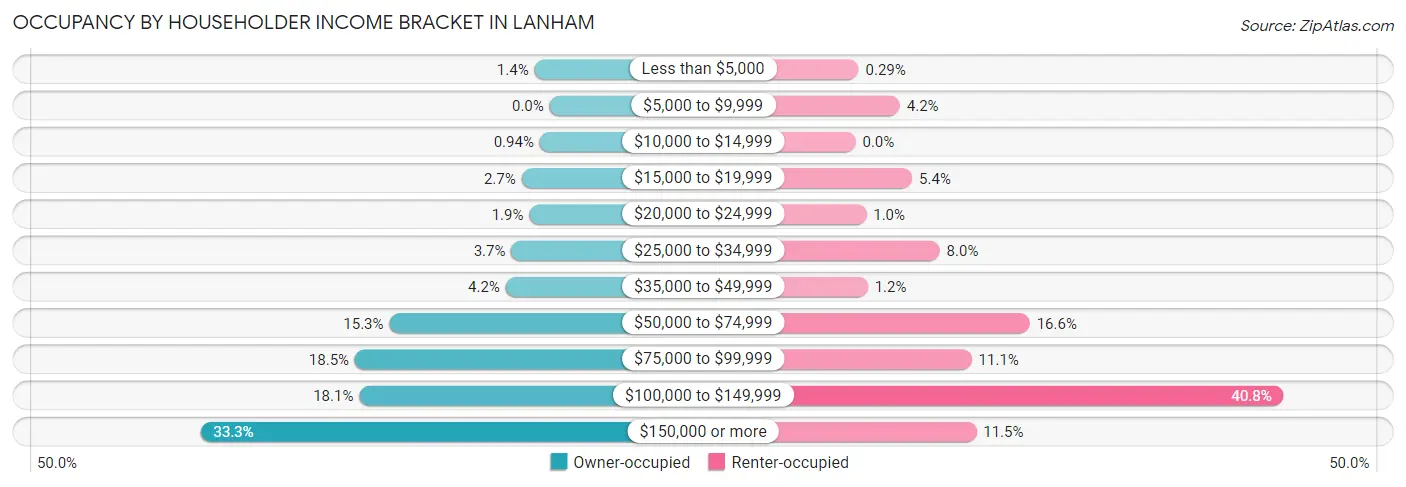
| Income Bracket | Owner-occupied | Renter-occupied |
| Less than $5,000 | 35 (1.4%) | 2 (0.3%) |
| $5,000 to $9,999 | 0 (0.0%) | 29 (4.2%) |
| $10,000 to $14,999 | 23 (0.9%) | 0 (0.0%) |
| $15,000 to $19,999 | 65 (2.7%) | 37 (5.4%) |
| $20,000 to $24,999 | 47 (1.9%) | 7 (1.0%) |
| $25,000 to $34,999 | 89 (3.6%) | 55 (8.0%) |
| $35,000 to $49,999 | 102 (4.2%) | 8 (1.2%) |
| $50,000 to $74,999 | 372 (15.3%) | 114 (16.6%) |
| $75,000 to $99,999 | 452 (18.5%) | 76 (11.1%) |
| $100,000 to $149,999 | 442 (18.1%) | 280 (40.8%) |
| $150,000 or more | 811 (33.3%) | 79 (11.5%) |
| Total | 2,438 (100.0%) | 687 (100.0%) |
Monthly Housing Cost Tiers in Lanham
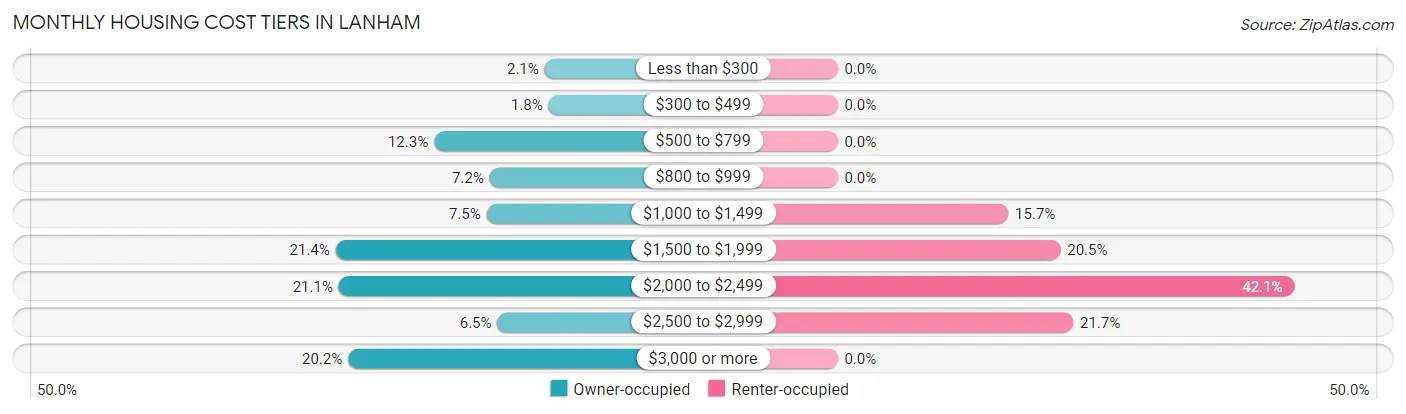
| Monthly Cost | Owner-occupied | Renter-occupied |
| Less than $300 | 52 (2.1%) | 0 (0.0%) |
| $300 to $499 | 43 (1.8%) | 0 (0.0%) |
| $500 to $799 | 300 (12.3%) | 0 (0.0%) |
| $800 to $999 | 175 (7.2%) | 0 (0.0%) |
| $1,000 to $1,499 | 182 (7.5%) | 108 (15.7%) |
| $1,500 to $1,999 | 521 (21.4%) | 141 (20.5%) |
| $2,000 to $2,499 | 514 (21.1%) | 289 (42.1%) |
| $2,500 to $2,999 | 158 (6.5%) | 149 (21.7%) |
| $3,000 or more | 493 (20.2%) | 0 (0.0%) |
| Total | 2,438 (100.0%) | 687 (100.0%) |
Physical Housing Characteristics in Lanham
Housing Structures in Lanham
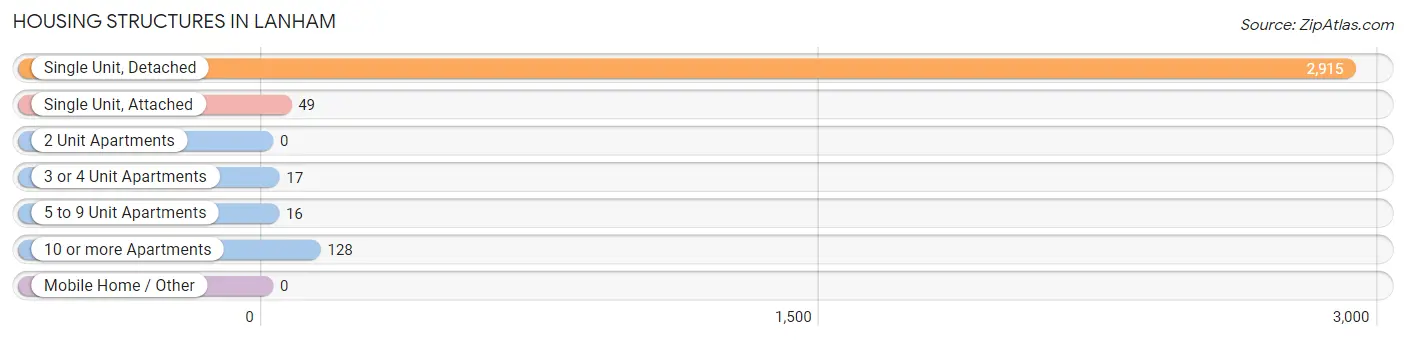
| Structure Type | # Housing Units | % Housing Units |
| Single Unit, Detached | 2,915 | 93.3% |
| Single Unit, Attached | 49 | 1.6% |
| 2 Unit Apartments | 0 | 0.0% |
| 3 or 4 Unit Apartments | 17 | 0.5% |
| 5 to 9 Unit Apartments | 16 | 0.5% |
| 10 or more Apartments | 128 | 4.1% |
| Mobile Home / Other | 0 | 0.0% |
| Total | 3,125 | 100.0% |
Housing Structures by Occupancy in Lanham
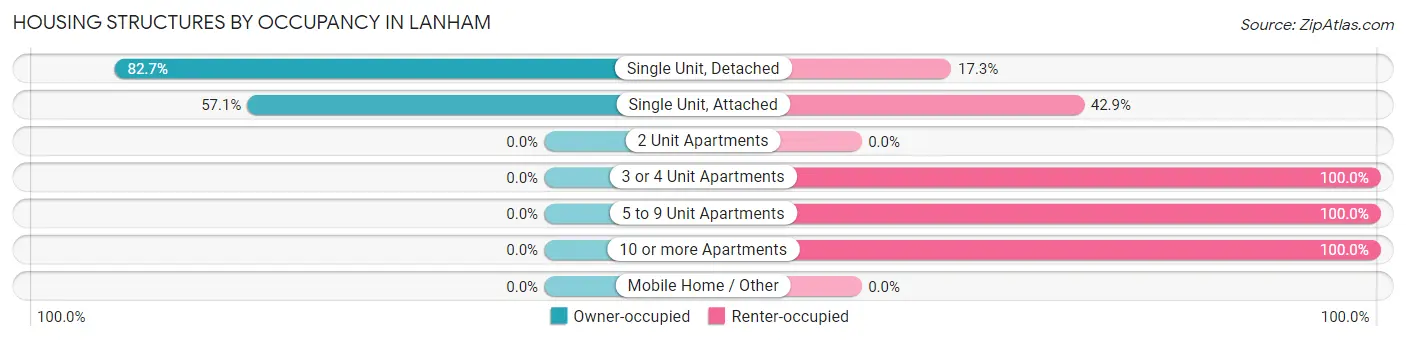
| Structure Type | Owner-occupied | Renter-occupied |
| Single Unit, Detached | 2,410 (82.7%) | 505 (17.3%) |
| Single Unit, Attached | 28 (57.1%) | 21 (42.9%) |
| 2 Unit Apartments | 0 (0.0%) | 0 (0.0%) |
| 3 or 4 Unit Apartments | 0 (0.0%) | 17 (100.0%) |
| 5 to 9 Unit Apartments | 0 (0.0%) | 16 (100.0%) |
| 10 or more Apartments | 0 (0.0%) | 128 (100.0%) |
| Mobile Home / Other | 0 (0.0%) | 0 (0.0%) |
| Total | 2,438 (78.0%) | 687 (22.0%) |
Housing Structures by Number of Rooms in Lanham
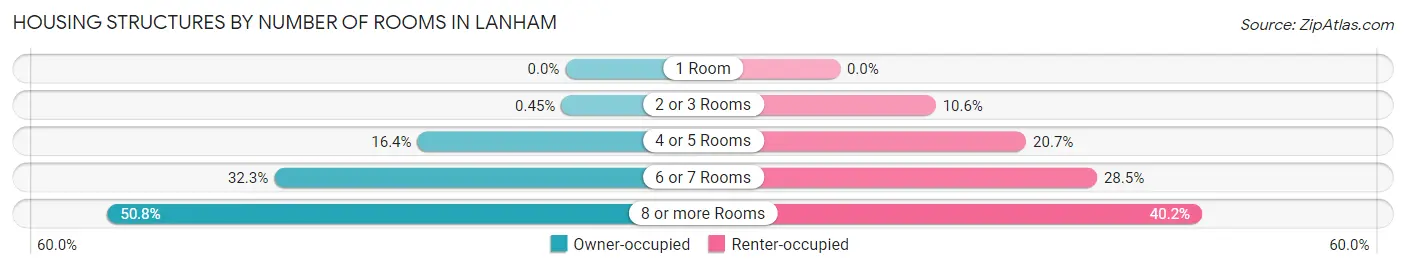
| Number of Rooms | Owner-occupied | Renter-occupied |
| 1 Room | 0 (0.0%) | 0 (0.0%) |
| 2 or 3 Rooms | 11 (0.4%) | 73 (10.6%) |
| 4 or 5 Rooms | 400 (16.4%) | 142 (20.7%) |
| 6 or 7 Rooms | 788 (32.3%) | 196 (28.5%) |
| 8 or more Rooms | 1,239 (50.8%) | 276 (40.2%) |
| Total | 2,438 (100.0%) | 687 (100.0%) |
Housing Structure by Heating Type in Lanham
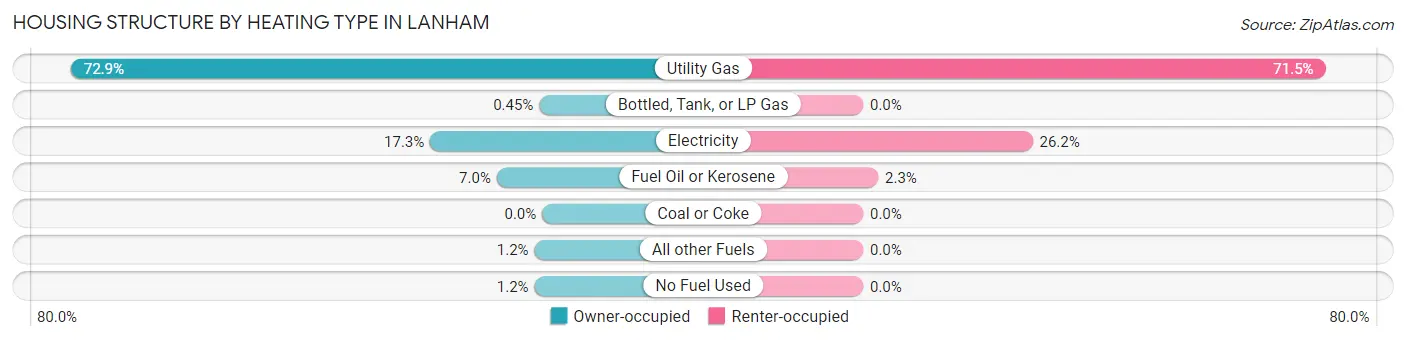
| Heating Type | Owner-occupied | Renter-occupied |
| Utility Gas | 1,776 (72.9%) | 491 (71.5%) |
| Bottled, Tank, or LP Gas | 11 (0.4%) | 0 (0.0%) |
| Electricity | 422 (17.3%) | 180 (26.2%) |
| Fuel Oil or Kerosene | 171 (7.0%) | 16 (2.3%) |
| Coal or Coke | 0 (0.0%) | 0 (0.0%) |
| All other Fuels | 29 (1.2%) | 0 (0.0%) |
| No Fuel Used | 29 (1.2%) | 0 (0.0%) |
| Total | 2,438 (100.0%) | 687 (100.0%) |
Household Vehicle Usage in Lanham
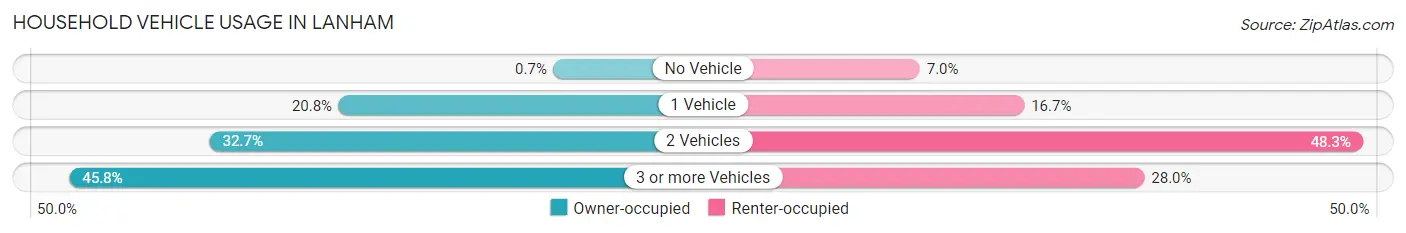
| Vehicles per Household | Owner-occupied | Renter-occupied |
| No Vehicle | 17 (0.7%) | 48 (7.0%) |
| 1 Vehicle | 506 (20.7%) | 115 (16.7%) |
| 2 Vehicles | 798 (32.7%) | 332 (48.3%) |
| 3 or more Vehicles | 1,117 (45.8%) | 192 (28.0%) |
| Total | 2,438 (100.0%) | 687 (100.0%) |
Real Estate & Mortgages in Lanham
Real Estate and Mortgage Overview in Lanham
| Characteristic | Without Mortgage | With Mortgage |
| Housing Units | 495 | 1,943 |
| Median Property Value | $349,000 | $399,200 |
| Median Household Income | $98,560 | $686 |
| Monthly Housing Costs | $709 | $493 |
| Real Estate Taxes | $4,503 | $80 |
Property Value by Mortgage Status in Lanham
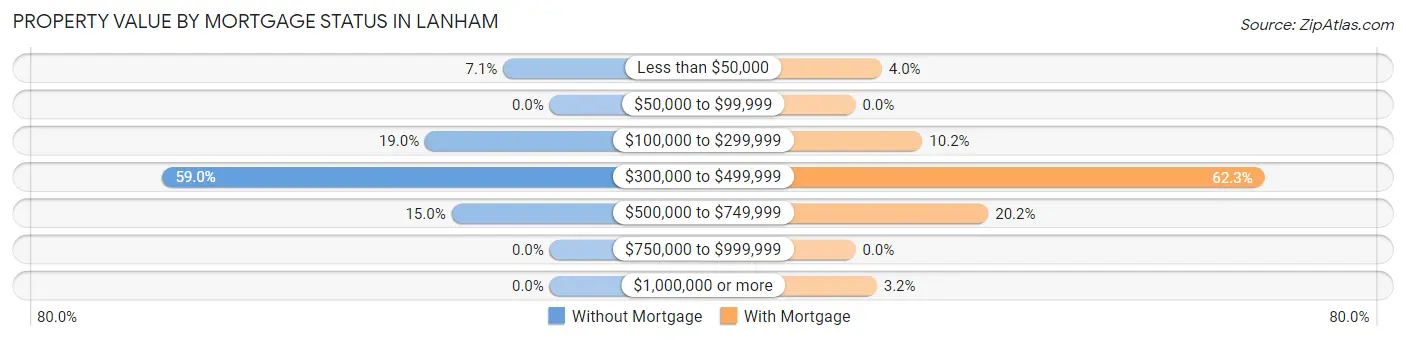
| Property Value | Without Mortgage | With Mortgage |
| Less than $50,000 | 35 (7.1%) | 78 (4.0%) |
| $50,000 to $99,999 | 0 (0.0%) | 0 (0.0%) |
| $100,000 to $299,999 | 94 (19.0%) | 198 (10.2%) |
| $300,000 to $499,999 | 292 (59.0%) | 1,211 (62.3%) |
| $500,000 to $749,999 | 74 (14.9%) | 393 (20.2%) |
| $750,000 to $999,999 | 0 (0.0%) | 0 (0.0%) |
| $1,000,000 or more | 0 (0.0%) | 63 (3.2%) |
| Total | 495 (100.0%) | 1,943 (100.0%) |
Household Income by Mortgage Status in Lanham
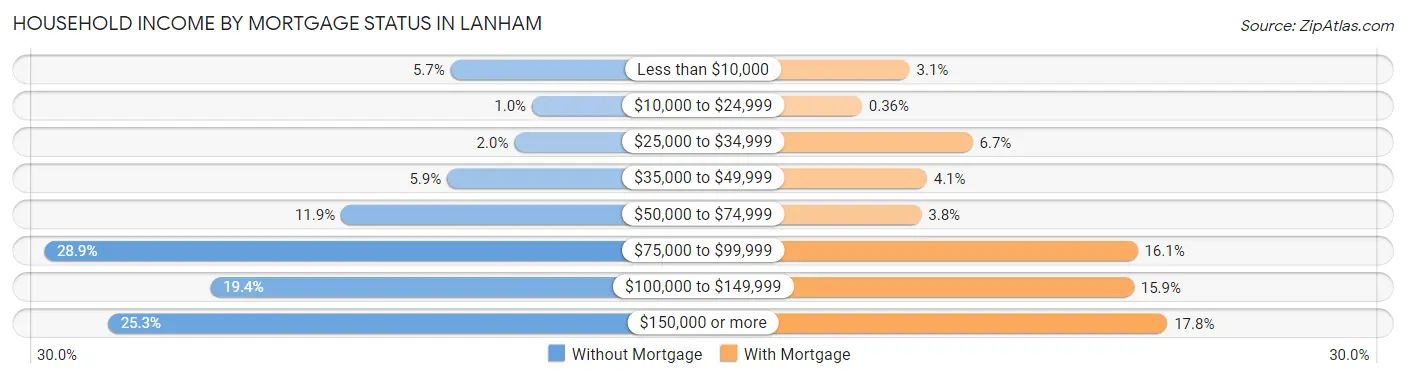
| Household Income | Without Mortgage | With Mortgage |
| Less than $10,000 | 28 (5.7%) | 60 (3.1%) |
| $10,000 to $24,999 | 5 (1.0%) | 7 (0.4%) |
| $25,000 to $34,999 | 10 (2.0%) | 130 (6.7%) |
| $35,000 to $49,999 | 29 (5.9%) | 79 (4.1%) |
| $50,000 to $74,999 | 59 (11.9%) | 73 (3.8%) |
| $75,000 to $99,999 | 143 (28.9%) | 313 (16.1%) |
| $100,000 to $149,999 | 96 (19.4%) | 309 (15.9%) |
| $150,000 or more | 125 (25.3%) | 346 (17.8%) |
| Total | 495 (100.0%) | 1,943 (100.0%) |
Property Value to Household Income Ratio in Lanham
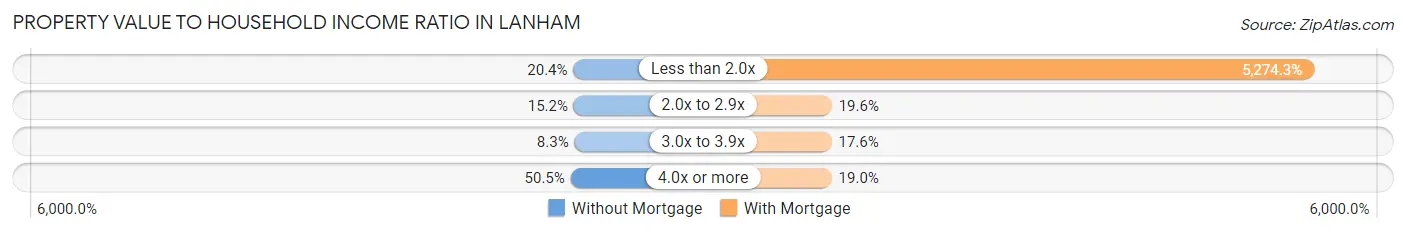
| Value-to-Income Ratio | Without Mortgage | With Mortgage |
| Less than 2.0x | 101 (20.4%) | 102,480 (5,274.3%) |
| 2.0x to 2.9x | 75 (15.1%) | 381 (19.6%) |
| 3.0x to 3.9x | 41 (8.3%) | 342 (17.6%) |
| 4.0x or more | 250 (50.5%) | 369 (19.0%) |
| Total | 495 (100.0%) | 1,943 (100.0%) |
Real Estate Taxes by Mortgage Status in Lanham
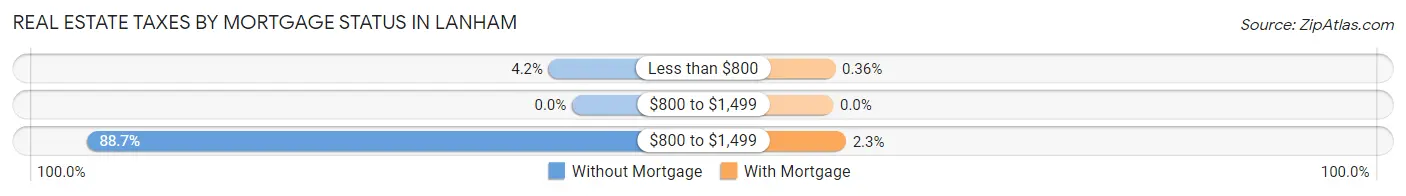
| Property Taxes | Without Mortgage | With Mortgage |
| Less than $800 | 21 (4.2%) | 7 (0.4%) |
| $800 to $1,499 | 0 (0.0%) | 0 (0.0%) |
| $800 to $1,499 | 439 (88.7%) | 45 (2.3%) |
| Total | 495 (100.0%) | 1,943 (100.0%) |
Health & Disability in Lanham
Health Insurance Coverage by Age in Lanham
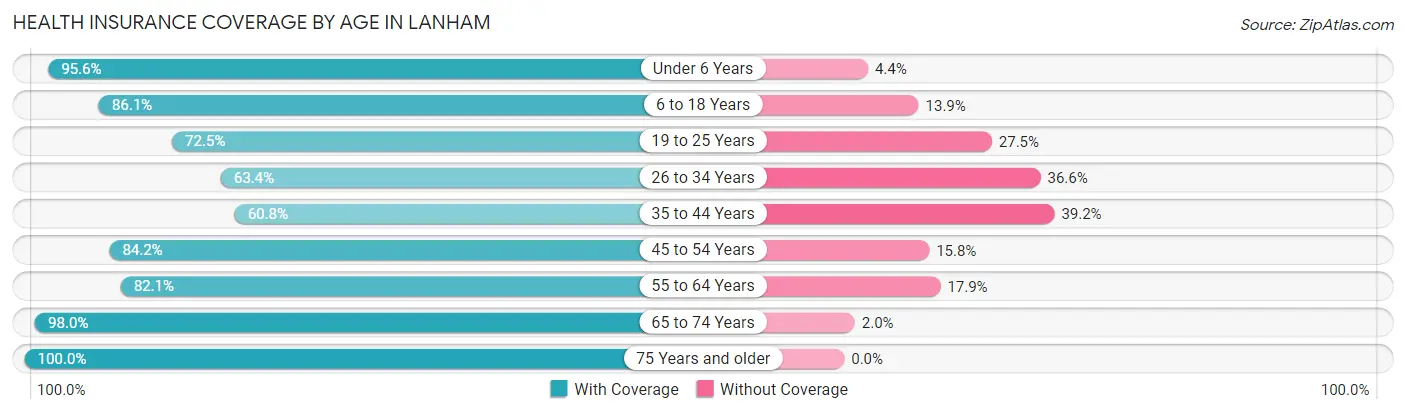
| Age Bracket | With Coverage | Without Coverage |
| Under 6 Years | 629 (95.6%) | 29 (4.4%) |
| 6 to 18 Years | 1,933 (86.1%) | 311 (13.9%) |
| 19 to 25 Years | 732 (72.5%) | 278 (27.5%) |
| 26 to 34 Years | 766 (63.4%) | 442 (36.6%) |
| 35 to 44 Years | 897 (60.8%) | 578 (39.2%) |
| 45 to 54 Years | 1,526 (84.2%) | 287 (15.8%) |
| 55 to 64 Years | 1,227 (82.1%) | 268 (17.9%) |
| 65 to 74 Years | 994 (98.0%) | 20 (2.0%) |
| 75 Years and older | 715 (100.0%) | 0 (0.0%) |
| Total | 9,419 (81.0%) | 2,213 (19.0%) |
Health Insurance Coverage by Citizenship Status in Lanham
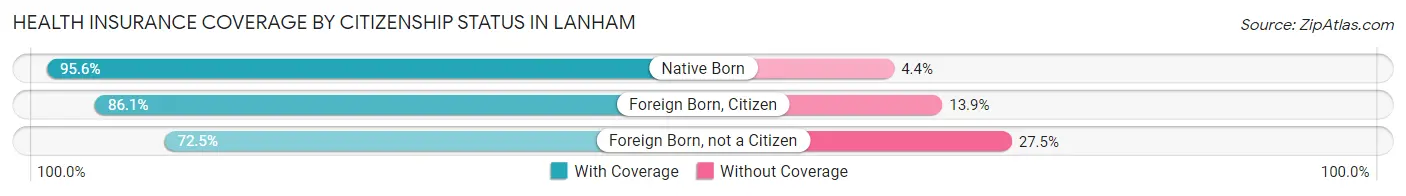
| Citizenship Status | With Coverage | Without Coverage |
| Native Born | 629 (95.6%) | 29 (4.4%) |
| Foreign Born, Citizen | 1,933 (86.1%) | 311 (13.9%) |
| Foreign Born, not a Citizen | 732 (72.5%) | 278 (27.5%) |
Health Insurance Coverage by Household Income in Lanham
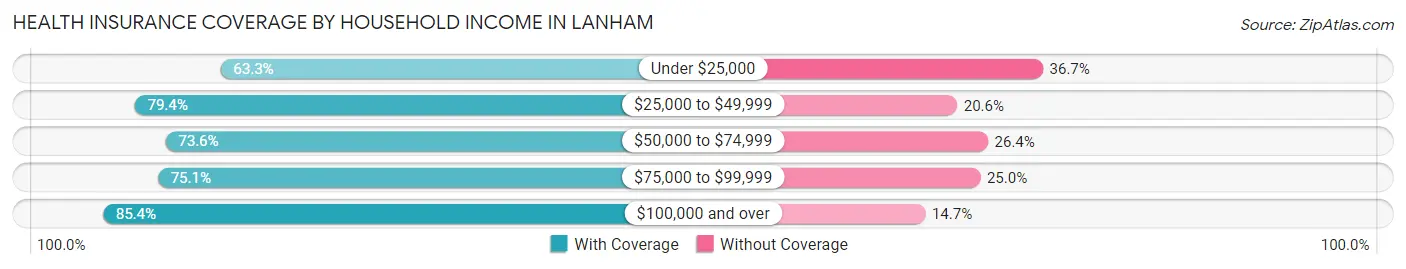
| Household Income | With Coverage | Without Coverage |
| Under $25,000 | 340 (63.3%) | 197 (36.7%) |
| $25,000 to $49,999 | 497 (79.4%) | 129 (20.6%) |
| $50,000 to $74,999 | 1,323 (73.6%) | 474 (26.4%) |
| $75,000 to $99,999 | 1,071 (75.0%) | 356 (24.9%) |
| $100,000 and over | 6,156 (85.4%) | 1,057 (14.6%) |
Public vs Private Health Insurance Coverage by Age in Lanham
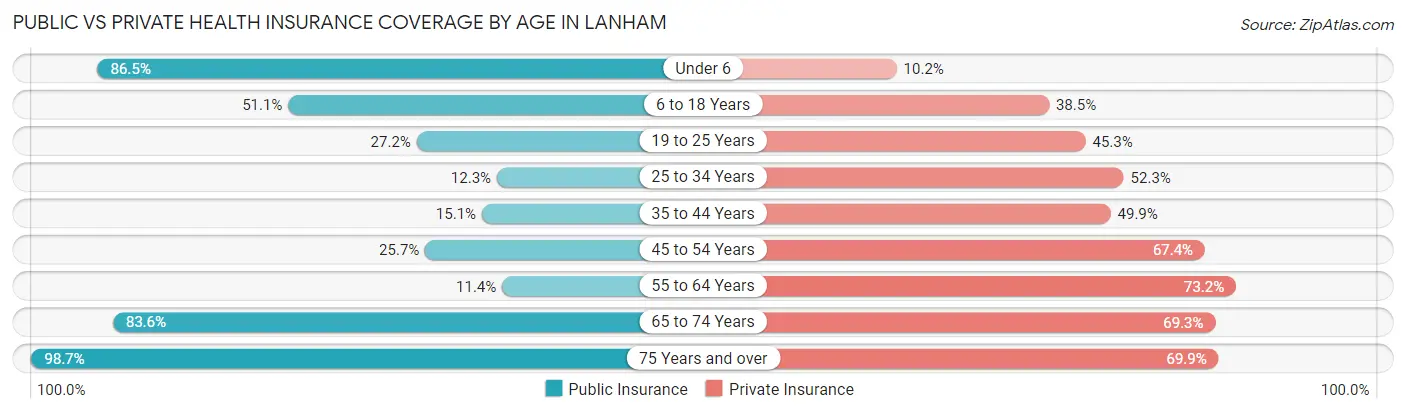
| Age Bracket | Public Insurance | Private Insurance |
| Under 6 | 569 (86.5%) | 67 (10.2%) |
| 6 to 18 Years | 1,146 (51.1%) | 863 (38.5%) |
| 19 to 25 Years | 275 (27.2%) | 457 (45.3%) |
| 25 to 34 Years | 149 (12.3%) | 632 (52.3%) |
| 35 to 44 Years | 223 (15.1%) | 736 (49.9%) |
| 45 to 54 Years | 465 (25.7%) | 1,222 (67.4%) |
| 55 to 64 Years | 170 (11.4%) | 1,094 (73.2%) |
| 65 to 74 Years | 848 (83.6%) | 703 (69.3%) |
| 75 Years and over | 706 (98.7%) | 500 (69.9%) |
| Total | 4,551 (39.1%) | 6,274 (53.9%) |
Disability Status by Sex by Age in Lanham
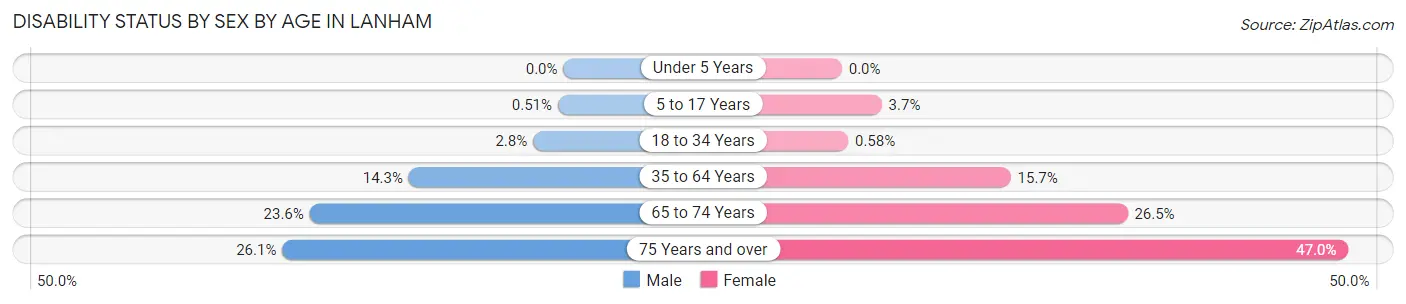
| Age Bracket | Male | Female |
| Under 5 Years | 0 (0.0%) | 0 (0.0%) |
| 5 to 17 Years | 6 (0.5%) | 42 (3.7%) |
| 18 to 34 Years | 35 (2.8%) | 6 (0.6%) |
| 35 to 64 Years | 361 (14.3%) | 355 (15.7%) |
| 65 to 74 Years | 110 (23.5%) | 145 (26.5%) |
| 75 Years and over | 60 (26.1%) | 228 (47.0%) |
Disability Class by Sex by Age in Lanham
Disability Class: Hearing Difficulty
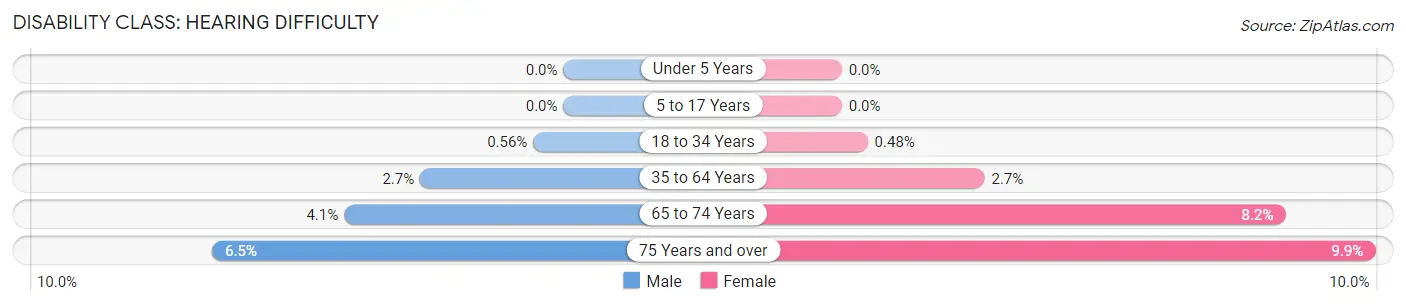
| Age Bracket | Male | Female |
| Under 5 Years | 0 (0.0%) | 0 (0.0%) |
| 5 to 17 Years | 0 (0.0%) | 0 (0.0%) |
| 18 to 34 Years | 7 (0.6%) | 5 (0.5%) |
| 35 to 64 Years | 67 (2.7%) | 60 (2.6%) |
| 65 to 74 Years | 19 (4.1%) | 45 (8.2%) |
| 75 Years and over | 15 (6.5%) | 48 (9.9%) |
Disability Class: Vision Difficulty
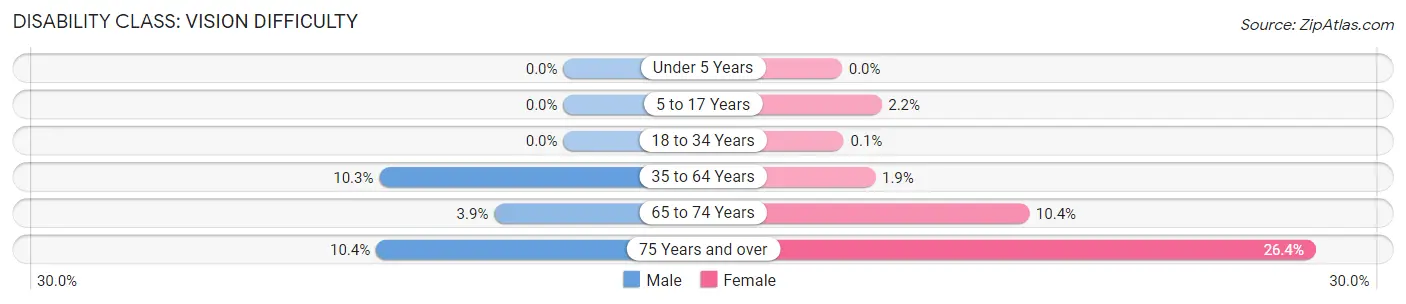
| Age Bracket | Male | Female |
| Under 5 Years | 0 (0.0%) | 0 (0.0%) |
| 5 to 17 Years | 0 (0.0%) | 25 (2.2%) |
| 18 to 34 Years | 0 (0.0%) | 1 (0.1%) |
| 35 to 64 Years | 258 (10.2%) | 42 (1.8%) |
| 65 to 74 Years | 18 (3.8%) | 57 (10.4%) |
| 75 Years and over | 24 (10.4%) | 128 (26.4%) |
Disability Class: Cognitive Difficulty
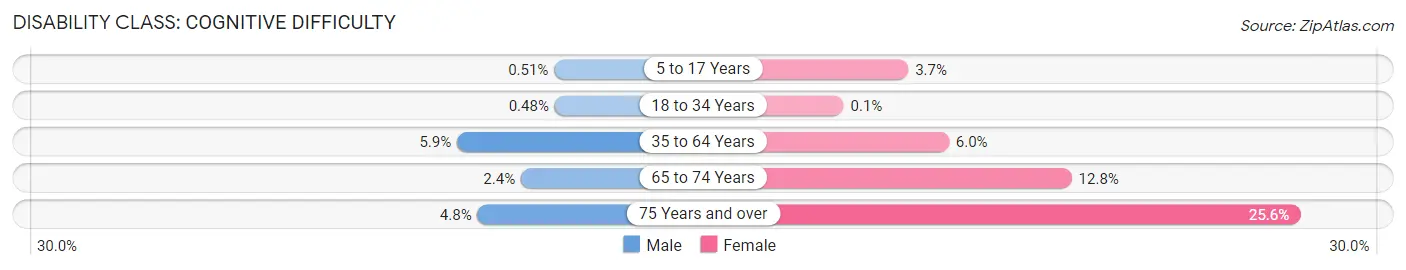
| Age Bracket | Male | Female |
| 5 to 17 Years | 6 (0.5%) | 42 (3.7%) |
| 18 to 34 Years | 6 (0.5%) | 1 (0.1%) |
| 35 to 64 Years | 149 (5.9%) | 135 (6.0%) |
| 65 to 74 Years | 11 (2.4%) | 70 (12.8%) |
| 75 Years and over | 11 (4.8%) | 124 (25.6%) |
Disability Class: Ambulatory Difficulty
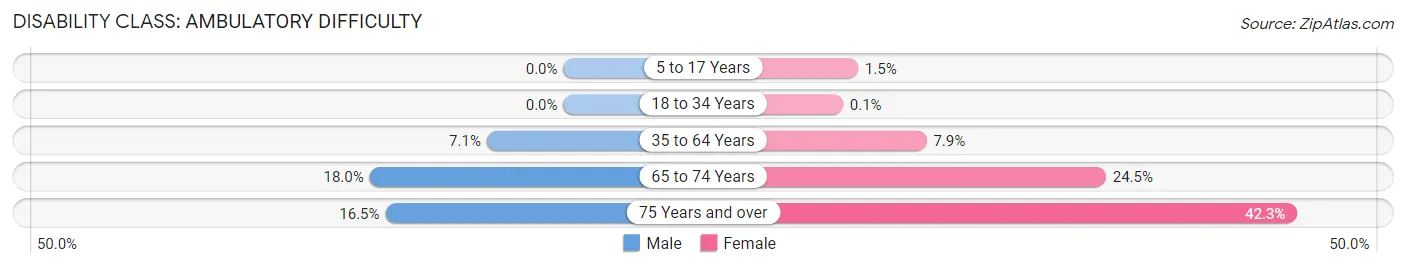
| Age Bracket | Male | Female |
| 5 to 17 Years | 0 (0.0%) | 17 (1.5%) |
| 18 to 34 Years | 0 (0.0%) | 1 (0.1%) |
| 35 to 64 Years | 179 (7.1%) | 178 (7.9%) |
| 65 to 74 Years | 84 (18.0%) | 134 (24.5%) |
| 75 Years and over | 38 (16.5%) | 205 (42.3%) |
Disability Class: Self-Care Difficulty
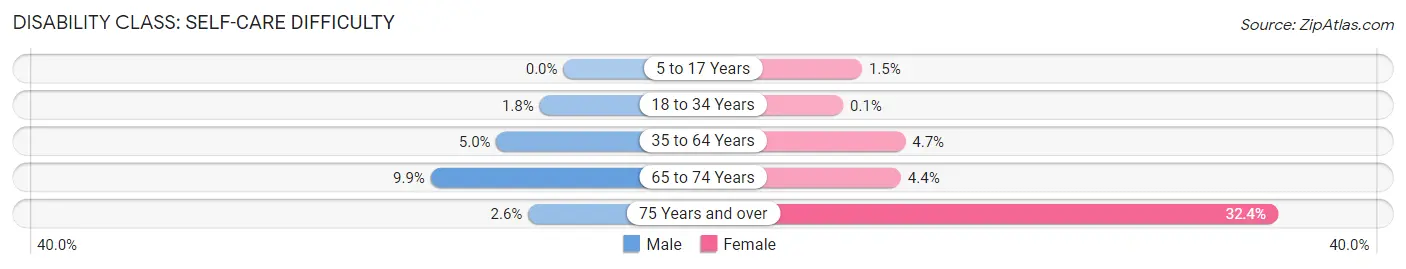
| Age Bracket | Male | Female |
| 5 to 17 Years | 0 (0.0%) | 17 (1.5%) |
| 18 to 34 Years | 22 (1.8%) | 1 (0.1%) |
| 35 to 64 Years | 125 (5.0%) | 107 (4.7%) |
| 65 to 74 Years | 46 (9.9%) | 24 (4.4%) |
| 75 Years and over | 6 (2.6%) | 157 (32.4%) |
Technology Access in Lanham
Computing Device Access in Lanham
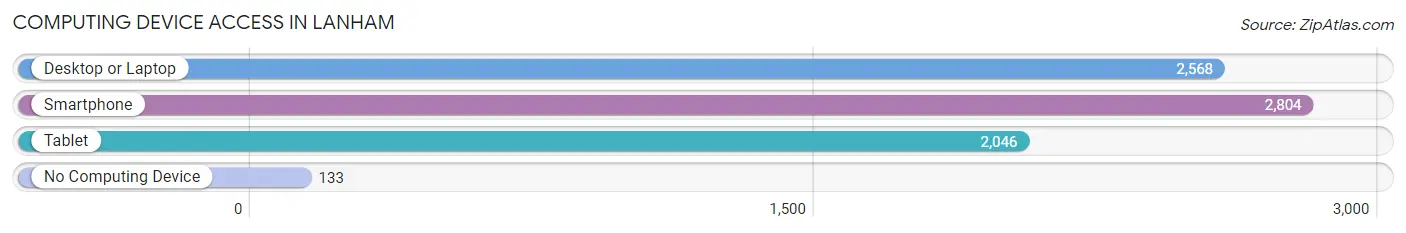
| Device Type | # Households | % Households |
| Desktop or Laptop | 2,568 | 82.2% |
| Smartphone | 2,804 | 89.7% |
| Tablet | 2,046 | 65.5% |
| No Computing Device | 133 | 4.3% |
| Total | 3,125 | 100.0% |
Internet Access in Lanham
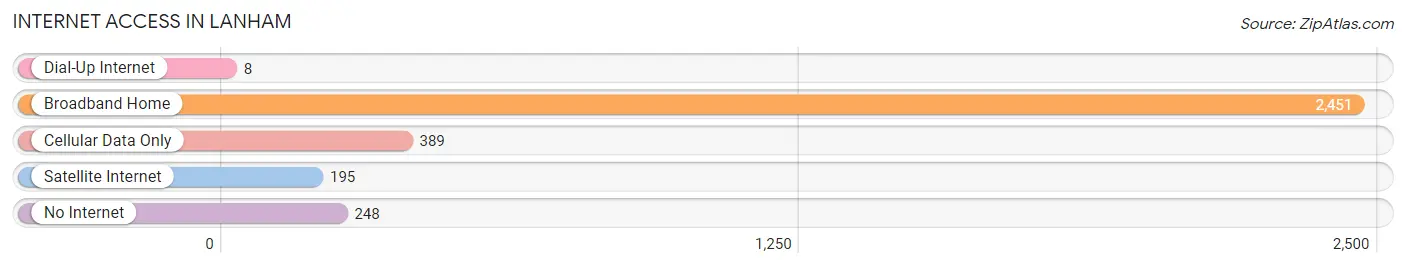
| Internet Type | # Households | % Households |
| Dial-Up Internet | 8 | 0.3% |
| Broadband Home | 2,451 | 78.4% |
| Cellular Data Only | 389 | 12.4% |
| Satellite Internet | 195 | 6.2% |
| No Internet | 248 | 7.9% |
| Total | 3,125 | 100.0% |
Lanham Summary
Lanham is a census-designated place (CDP) located in Prince George's County, Maryland, United States. It is located approximately 8 miles east of Washington, D.C. and is part of the Washington metropolitan area. As of the 2010 census, the population of Lanham was 10,157.
Geography
Lanham is located at 38°56'45" North, 76°52'17" West (38.94583, -76.87139). It is situated in the Piedmont region of Maryland, and is bordered by the cities of Bowie and Greenbelt to the north, Glenn Dale to the east, and Seabrook to the south. The CDP has a total area of 4.2 square miles, all of which is land.
Economy
Lanham is home to several major employers, including the United States Postal Service, the National Oceanic and Atmospheric Administration, and the Goddard Space Flight Center. The area is also home to several small businesses, including restaurants, retail stores, and professional services.
Demographics
As of the 2010 census, there were 10,157 people, 3,845 households, and 2,541 families residing in the CDP. The population density was 2,417.2 people per square mile. The racial makeup of the CDP was 44.3% White, 37.2% African American, 0.4% Native American, 8.3% Asian, 0.1% Pacific Islander, 5.7% from other races, and 4.0% from two or more races. Hispanic or Latino of any race were 11.7% of the population.
The median income for a household in the CDP was $63,945, and the median income for a family was $76,945. The per capita income for the CDP was $30,945. About 5.2% of families and 7.2% of the population were below the poverty line, including 8.3% of those under age 18 and 5.2% of those age 65 or over.
History
Lanham was first settled in the early 1700s by the Lanham family, who were among the first settlers in the area. The town was officially incorporated in 1873, and was named after the Lanham family. The town grew steadily throughout the 19th and 20th centuries, and by the 1950s, it had become a major suburban community.
In the late 20th century, Lanham experienced a period of rapid growth and development, as the Washington metropolitan area expanded. The area is now home to a diverse population, and is a popular destination for commuters to the nation's capital.
Common Questions
What is Per Capita Income in Lanham?
Per Capita income in Lanham is $33,272.
What is the Median Family Income in Lanham?
Median Family Income in Lanham is $112,139.
What is the Median Household income in Lanham?
Median Household Income in Lanham is $100,974.
What is Income or Wage Gap in Lanham?
Income or Wage Gap in Lanham is 14.9%.
Women in Lanham earn 85.1 cents for every dollar earned by a man.
What is Inequality or Gini Index in Lanham?
Inequality or Gini Index in Lanham is 0.36.
What is the Total Population of Lanham?
Total Population of Lanham is 11,662.
What is the Total Male Population of Lanham?
Total Male Population of Lanham is 5,925.
What is the Total Female Population of Lanham?
Total Female Population of Lanham is 5,737.
What is the Ratio of Males per 100 Females in Lanham?
There are 103.28 Males per 100 Females in Lanham.
What is the Ratio of Females per 100 Males in Lanham?
There are 96.83 Females per 100 Males in Lanham.
What is the Median Population Age in Lanham?
Median Population Age in Lanham is 39.8 Years.
What is the Average Family Size in Lanham
Average Family Size in Lanham is 4.3 People.
What is the Average Household Size in Lanham
Average Household Size in Lanham is 3.7 People.
How Large is the Labor Force in Lanham?
There are 6,124 People in the Labor Forcein in Lanham.
What is the Percentage of People in the Labor Force in Lanham?
67.4% of People are in the Labor Force in Lanham.
What is the Unemployment Rate in Lanham?
Unemployment Rate in Lanham is 9.0%.